Bonds – July 30, 2026

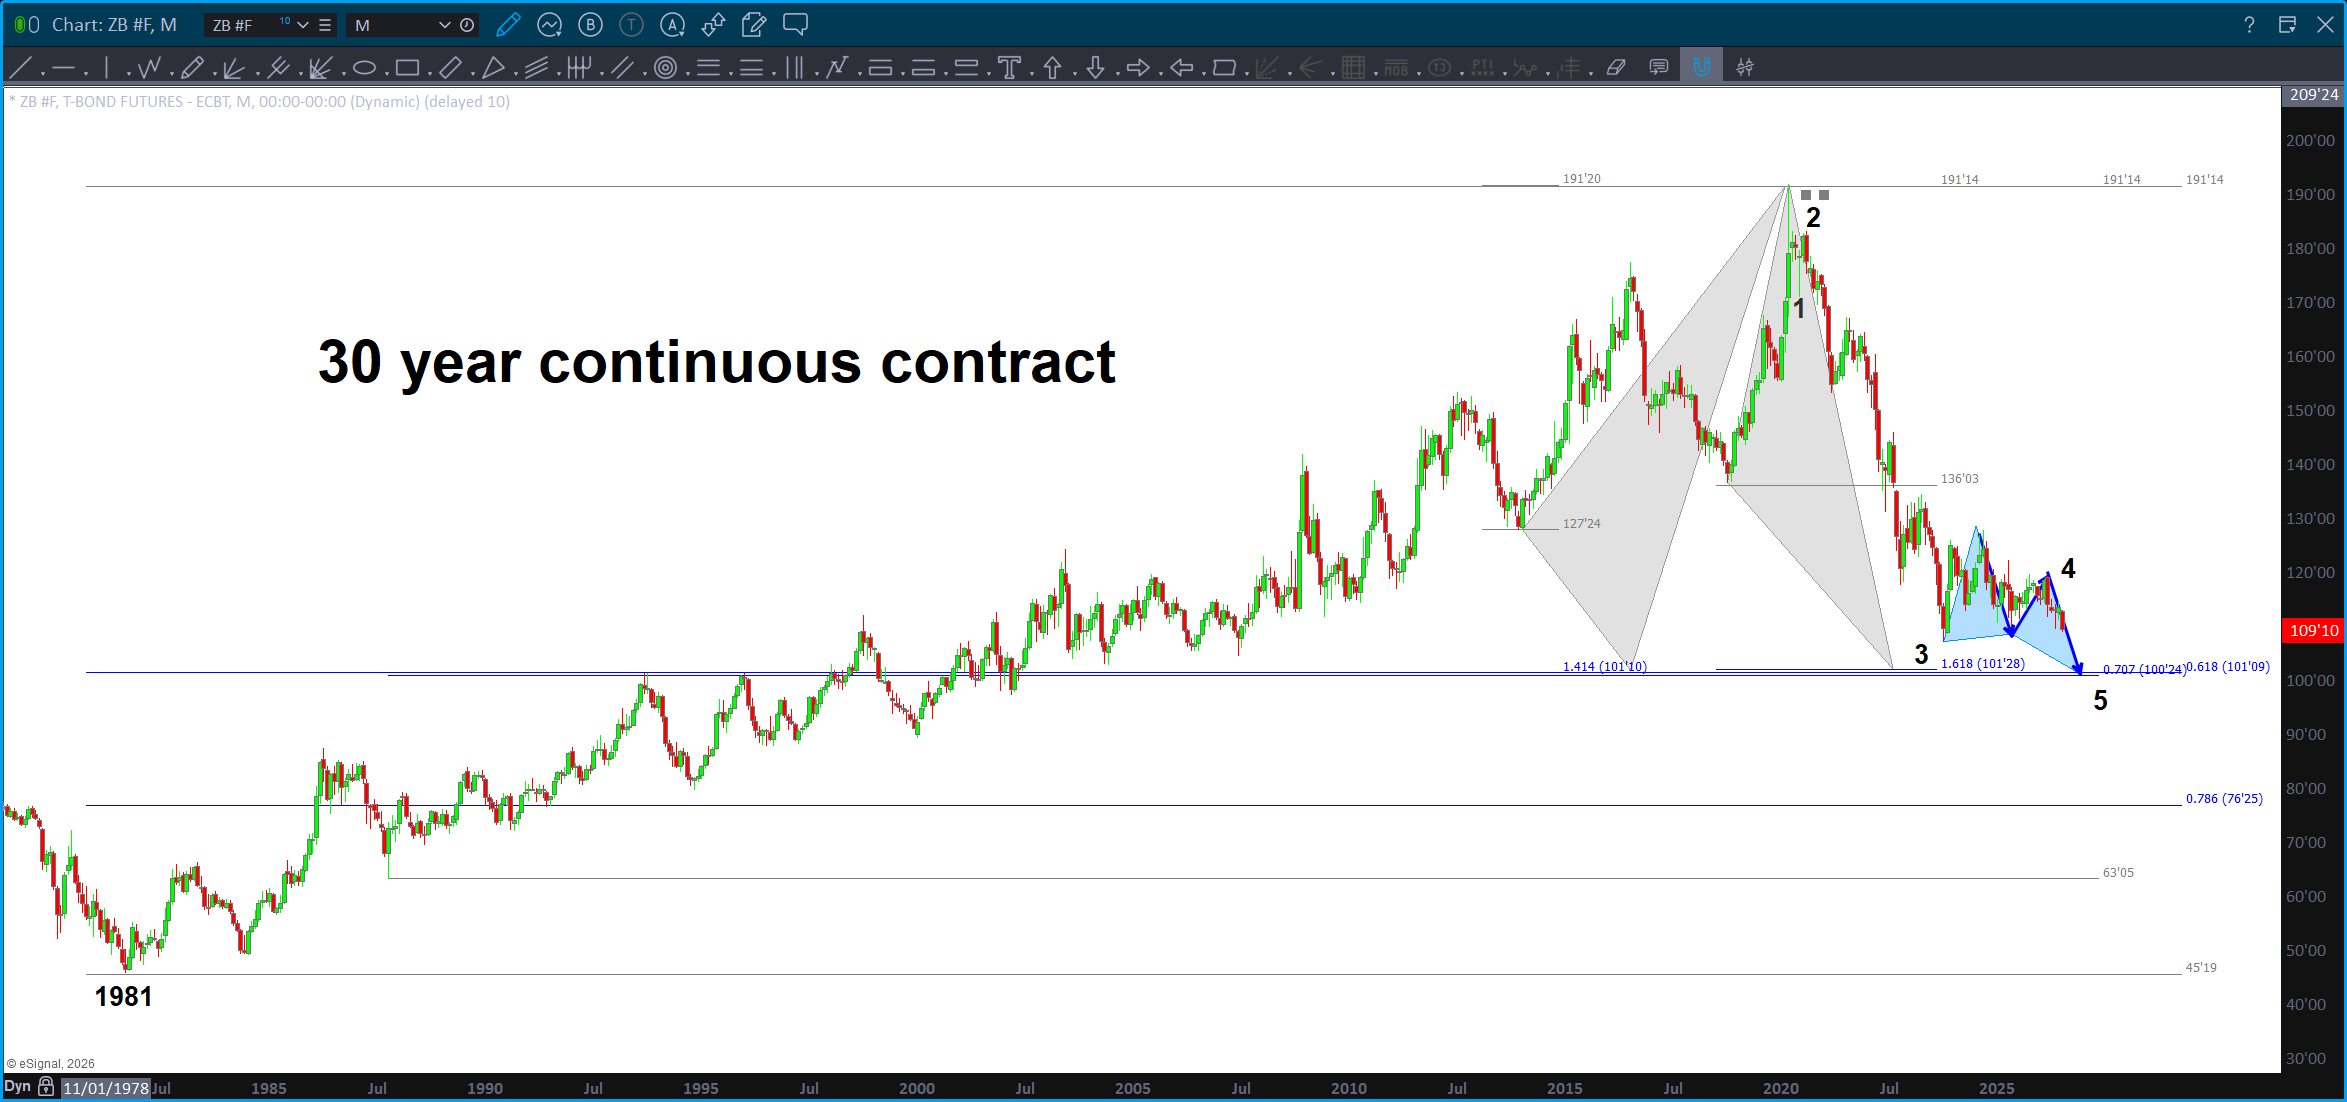
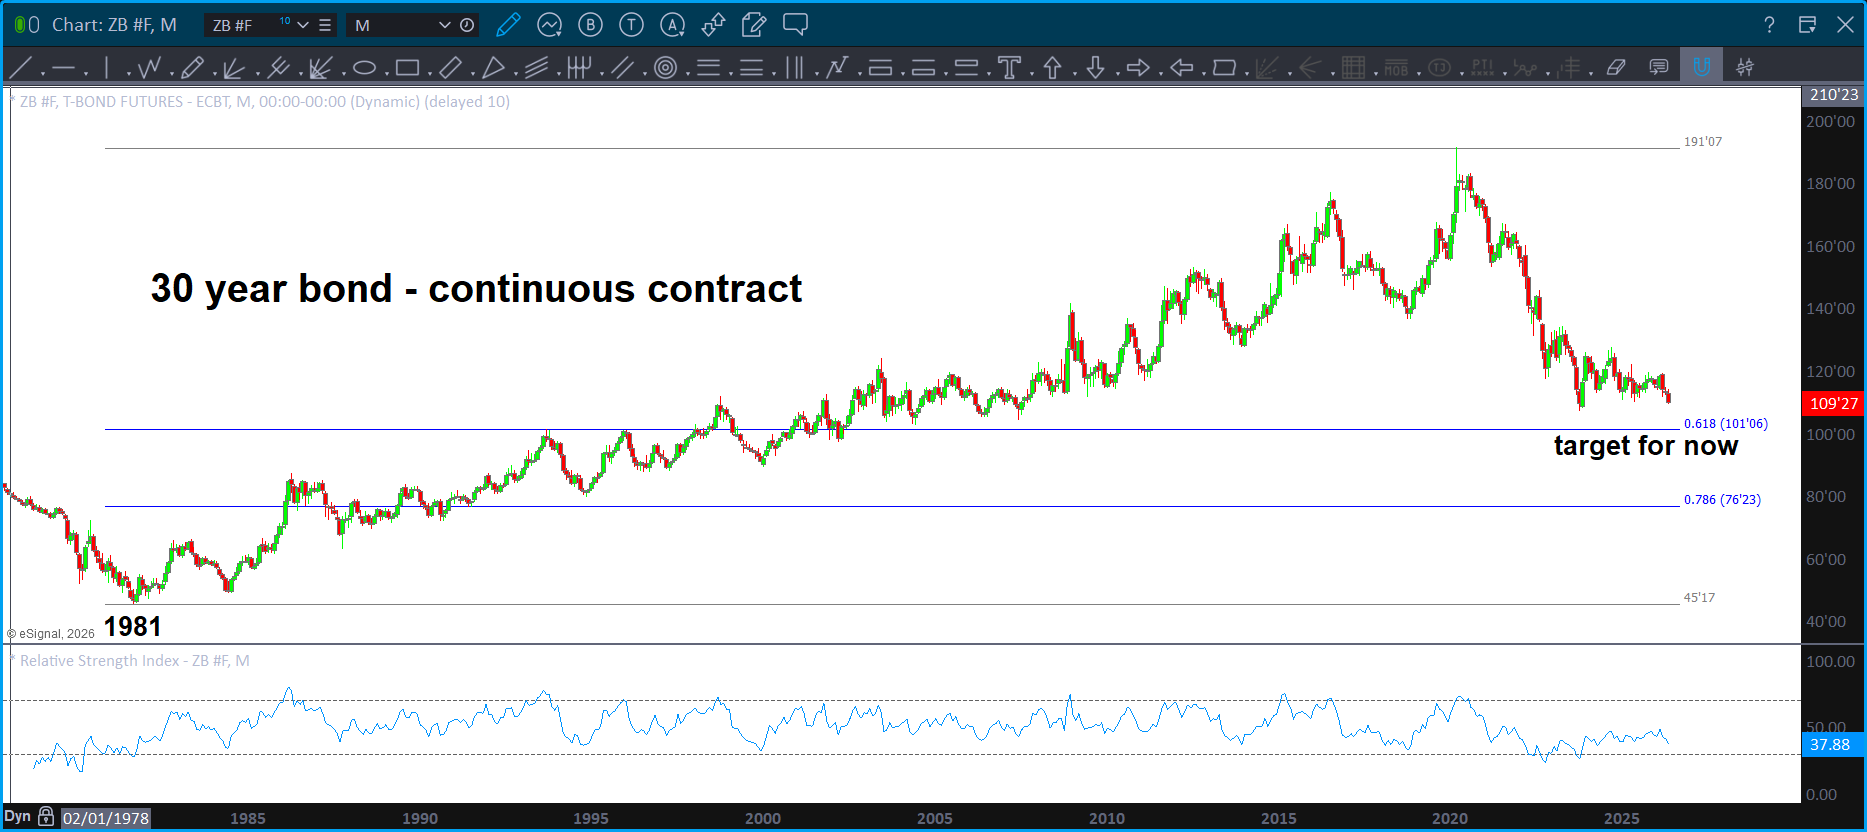
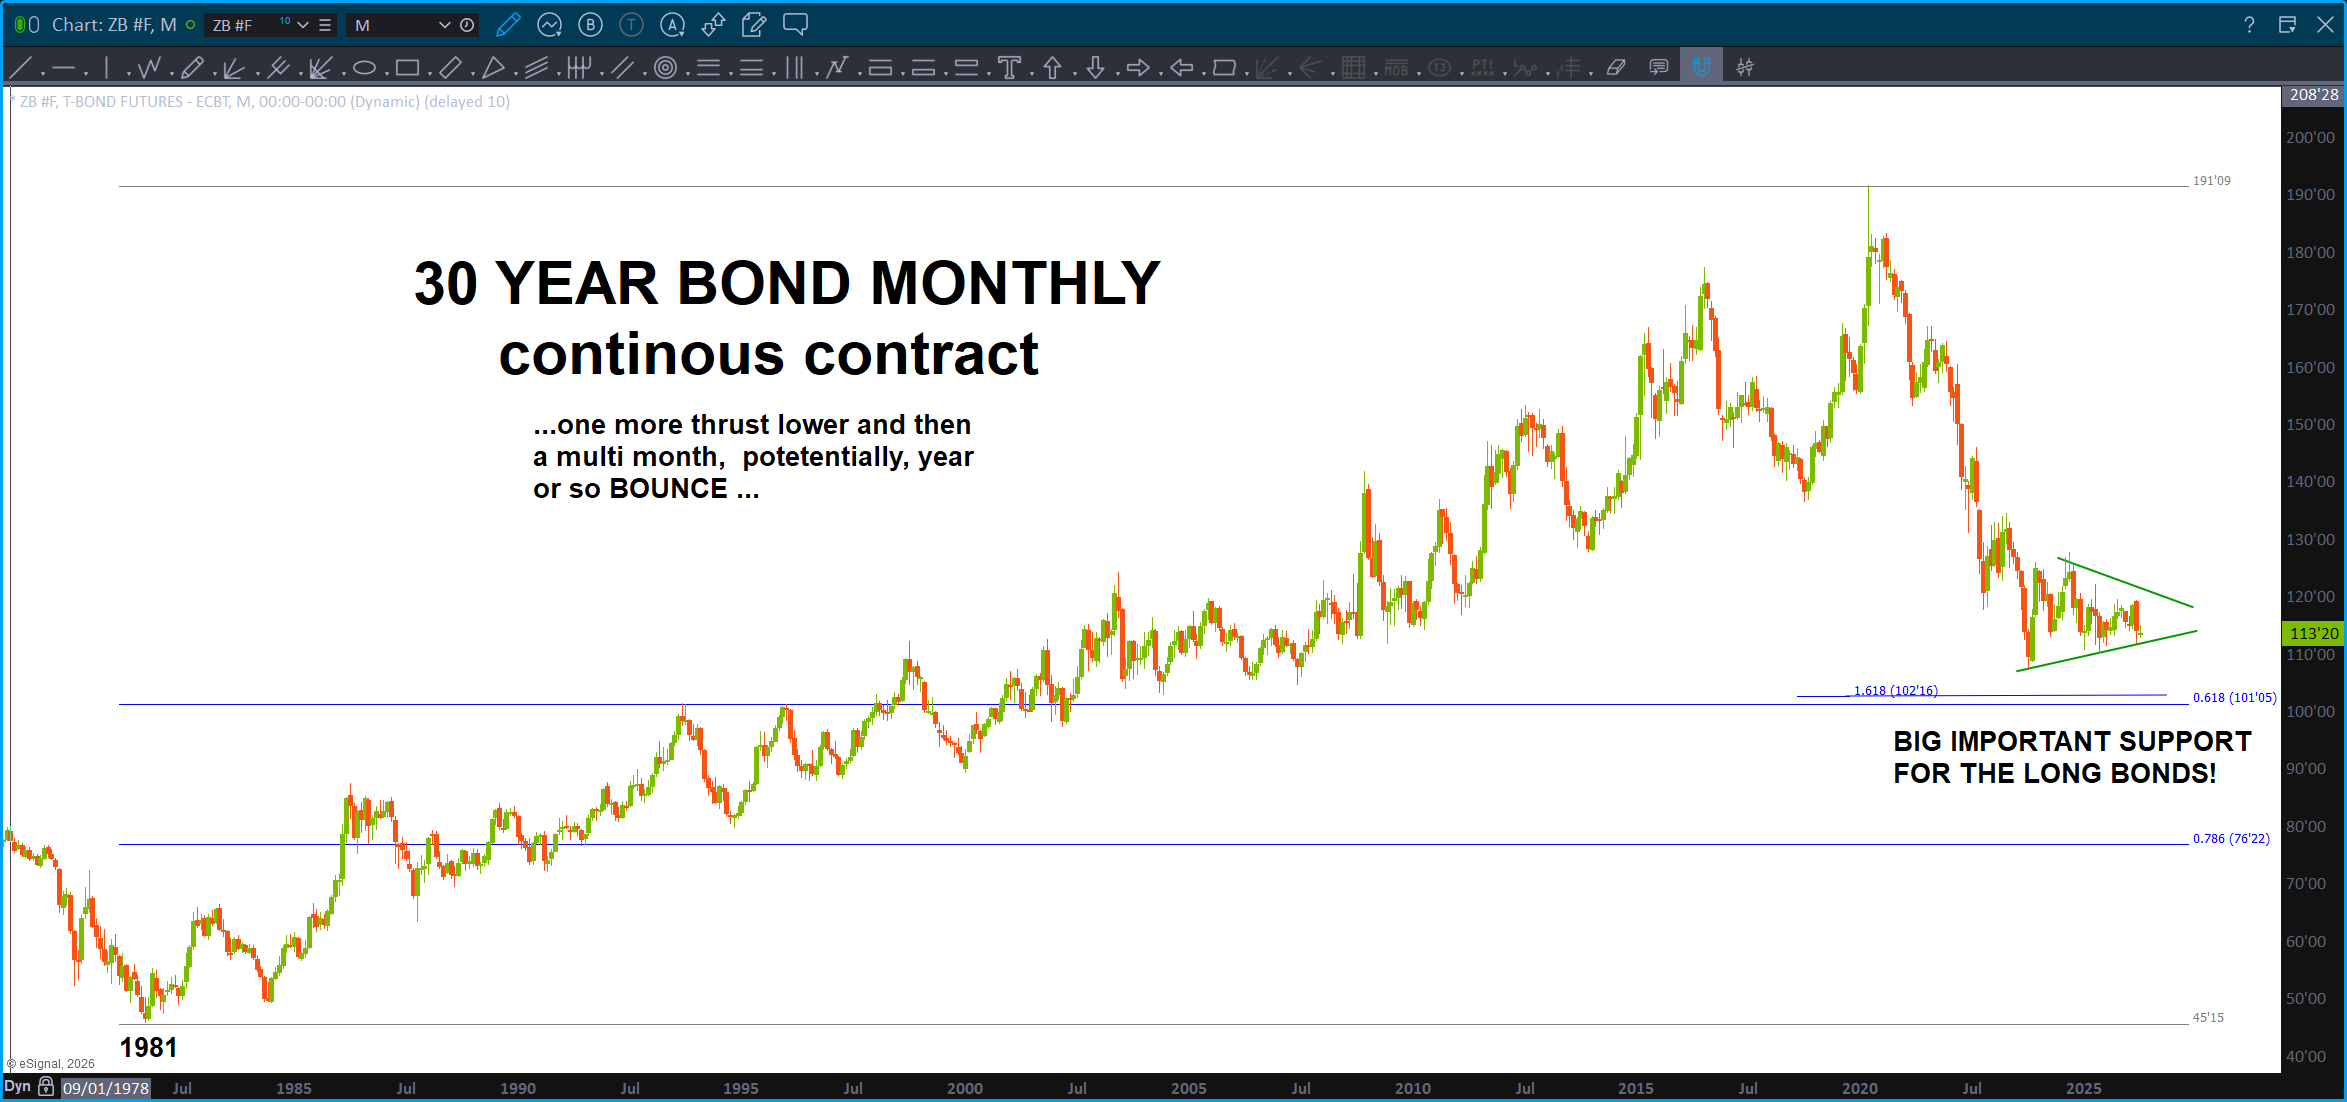
Expect interest rates to continue to rise … they are barreling towards huge resistance on the 10 year around 6 percent and monster support on the long bond around 100-101. I am expecting a good multi month if not multi year – bounce. Yes, only a bounce in bonds but should be a good one after being down for 6 years.

the Ratio – July 29, 2026

I’ve decided to check in on the XLP/NYA and let it guide our way … hopefully this will answer any question on what is ahead and provide strategies to manage risk and profit.
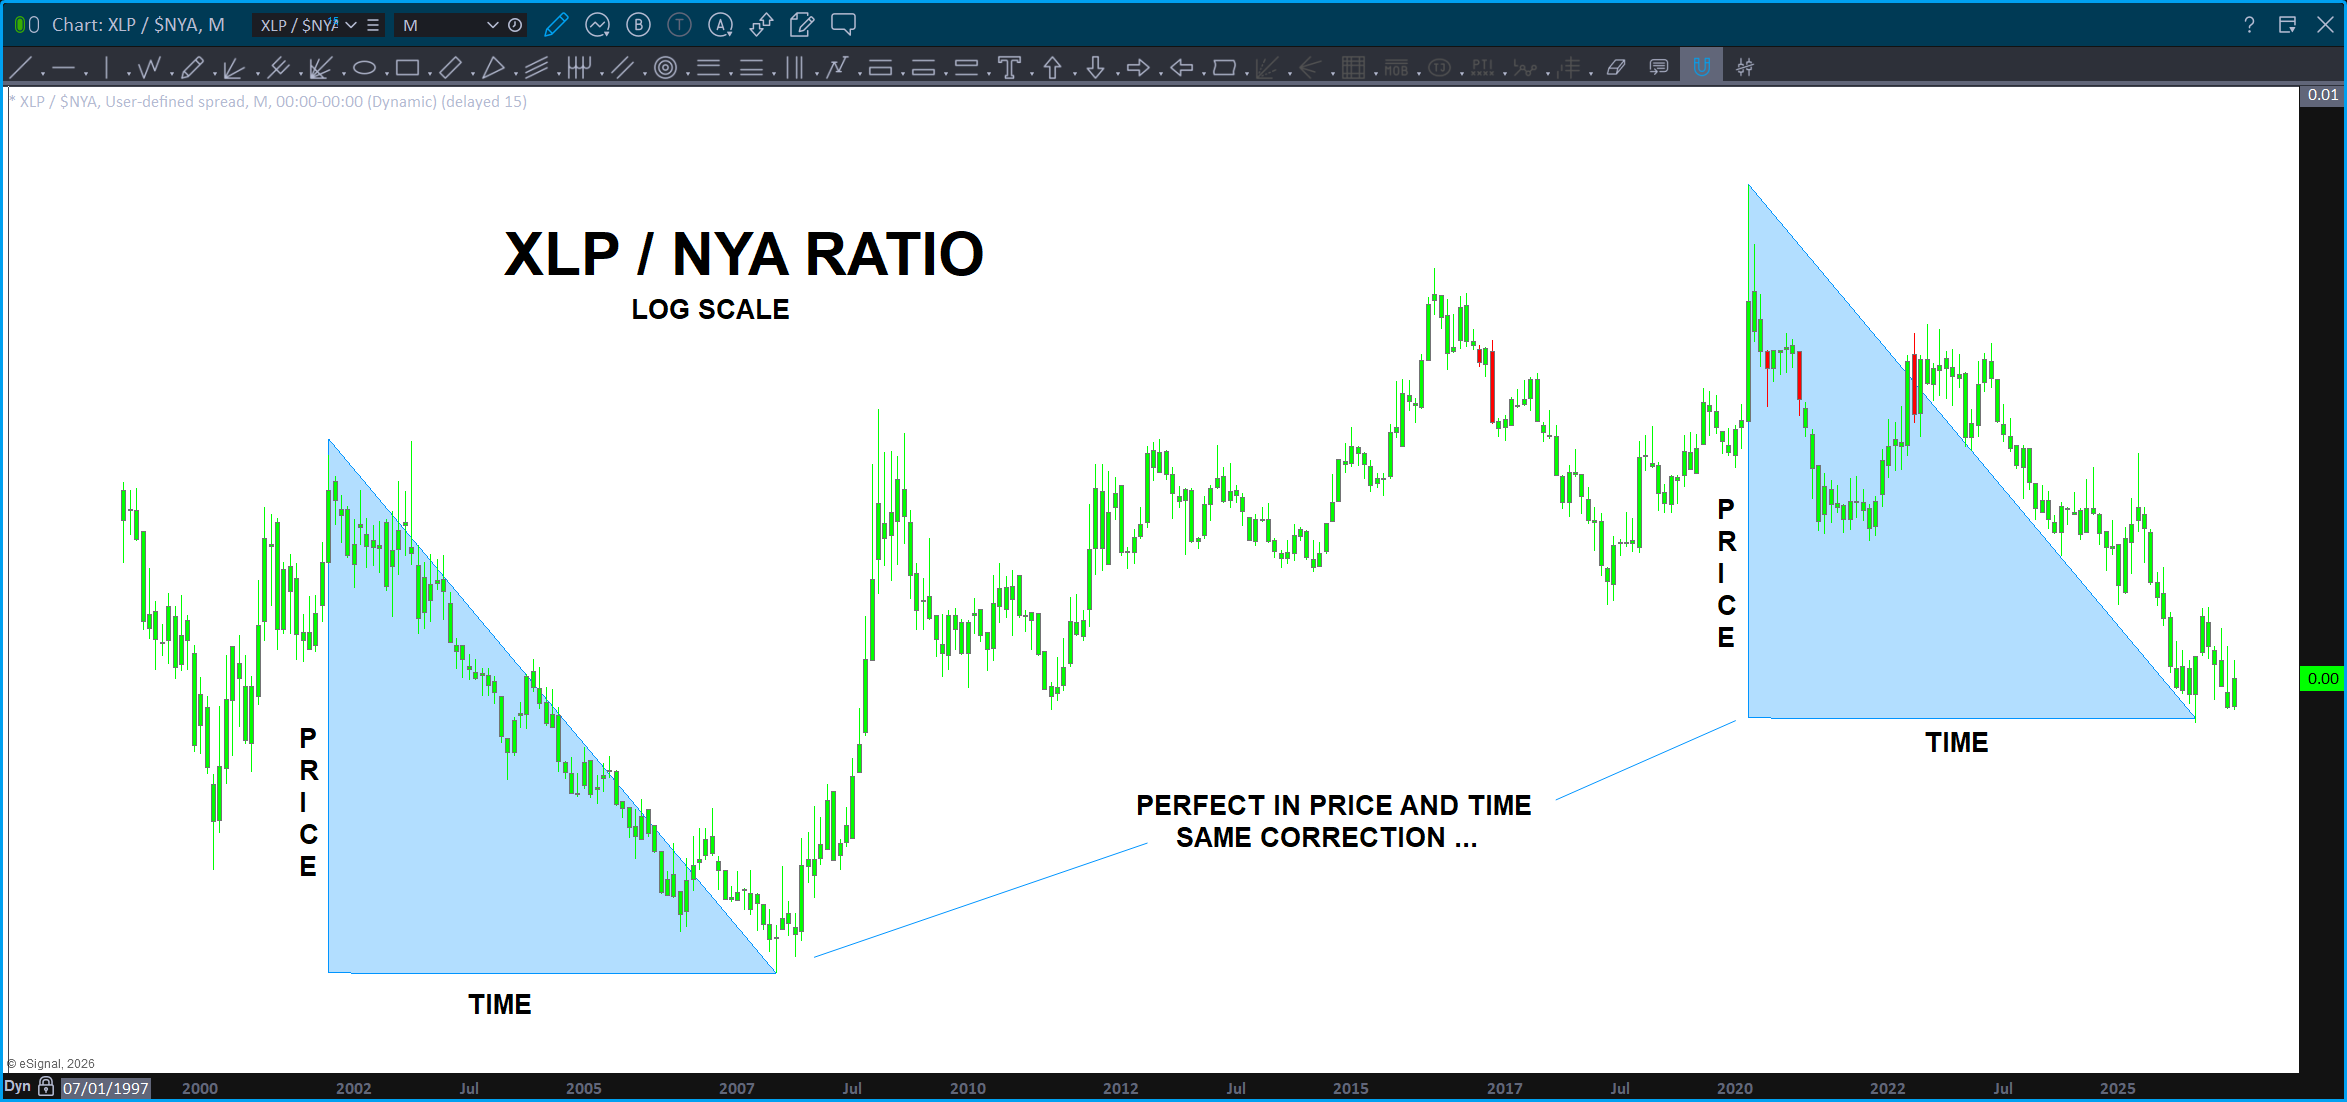
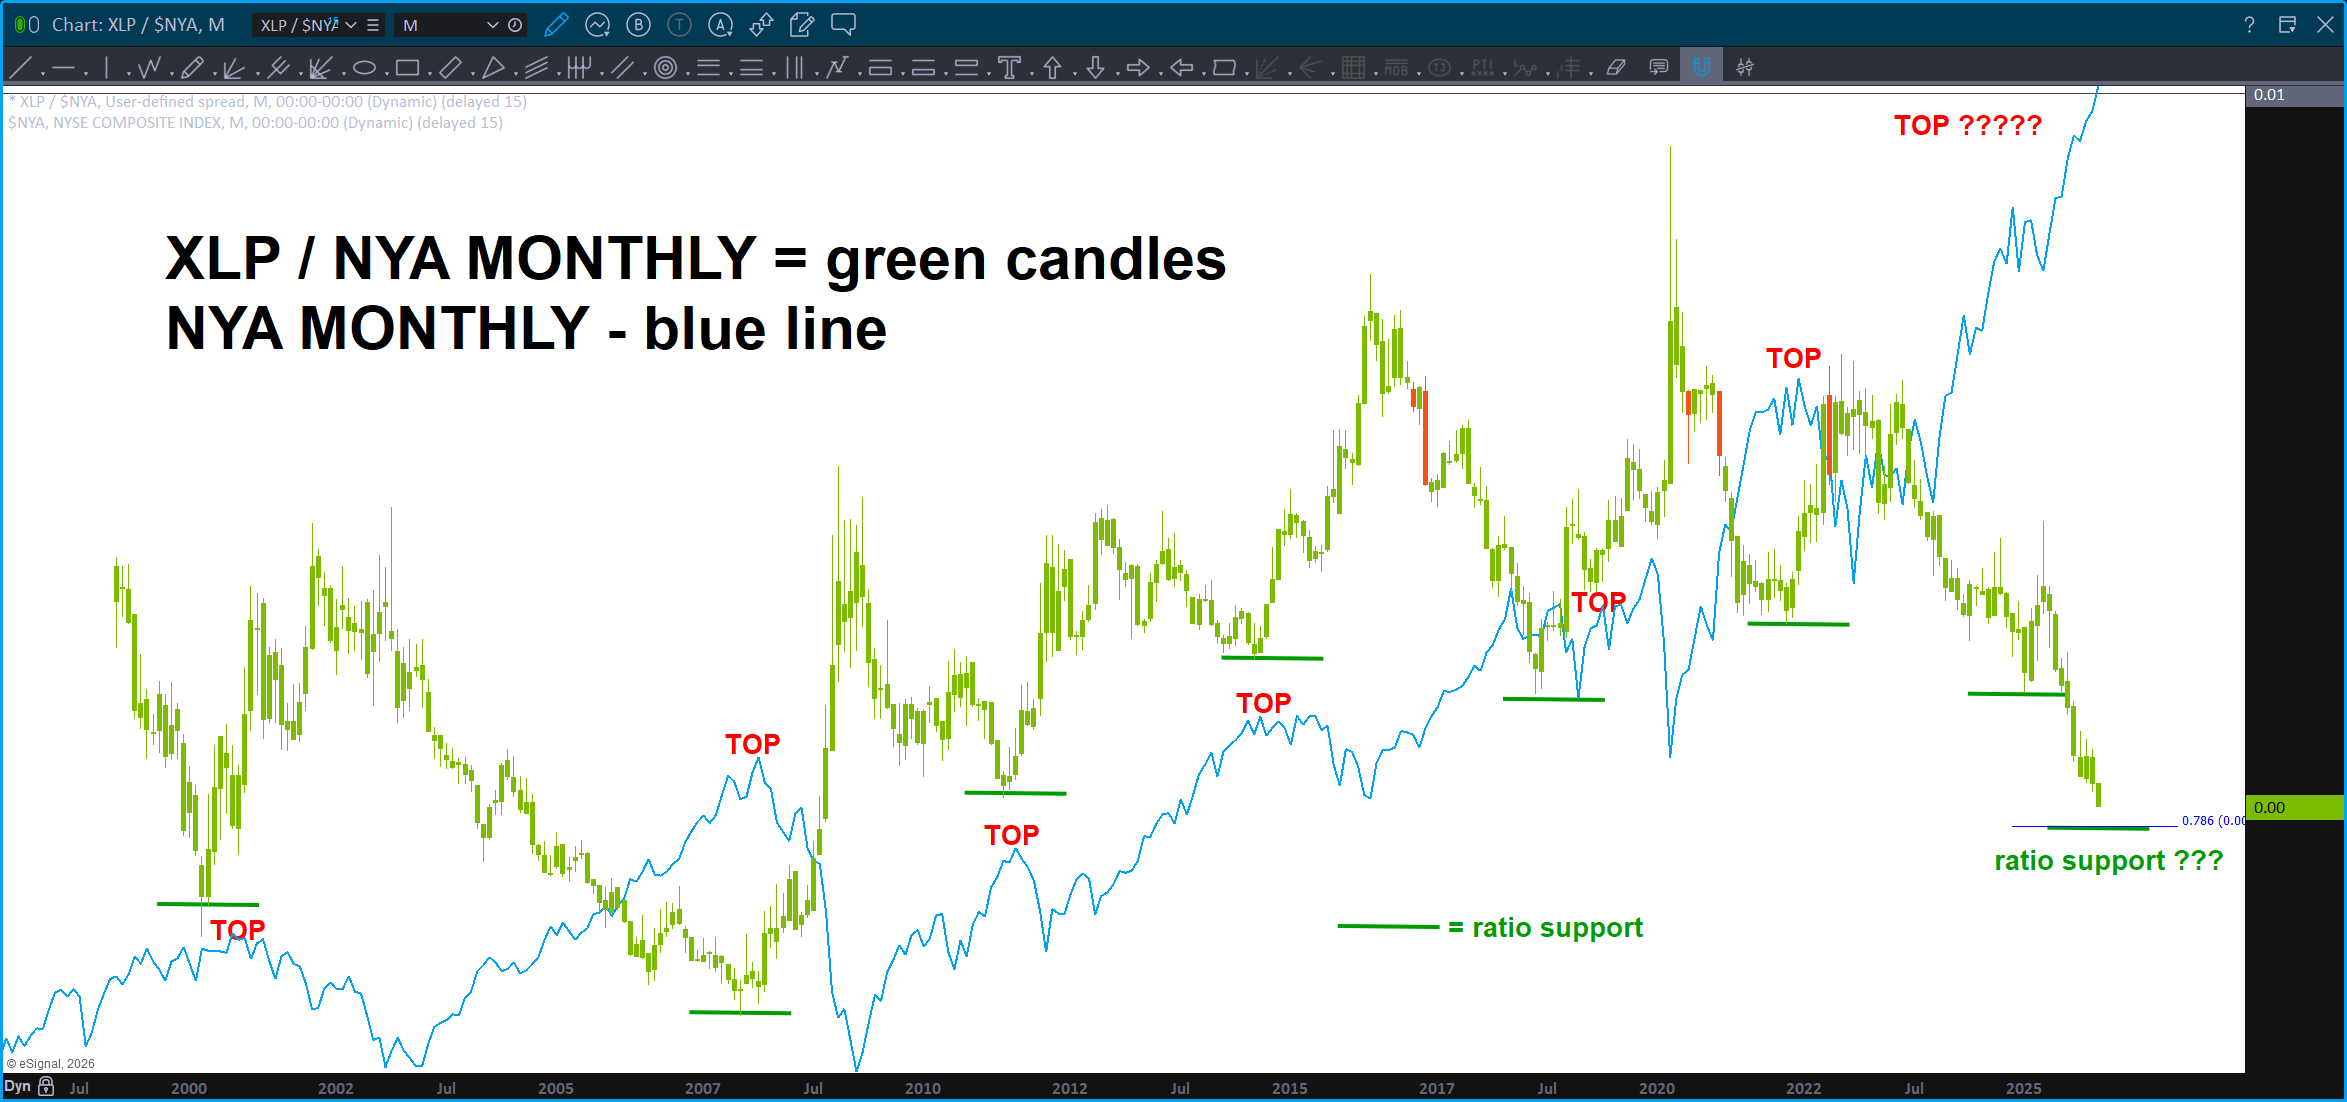
I truly live and die by the XLP/NYA ratio. It’s a ‘near perfect’ indicator of real-time institutional mindset – are they risk on or risk off? I use the NYA (NYSE Composite Index) because its big and isn’t weighted and just gives, big picture, how it’s really going … at least for me.
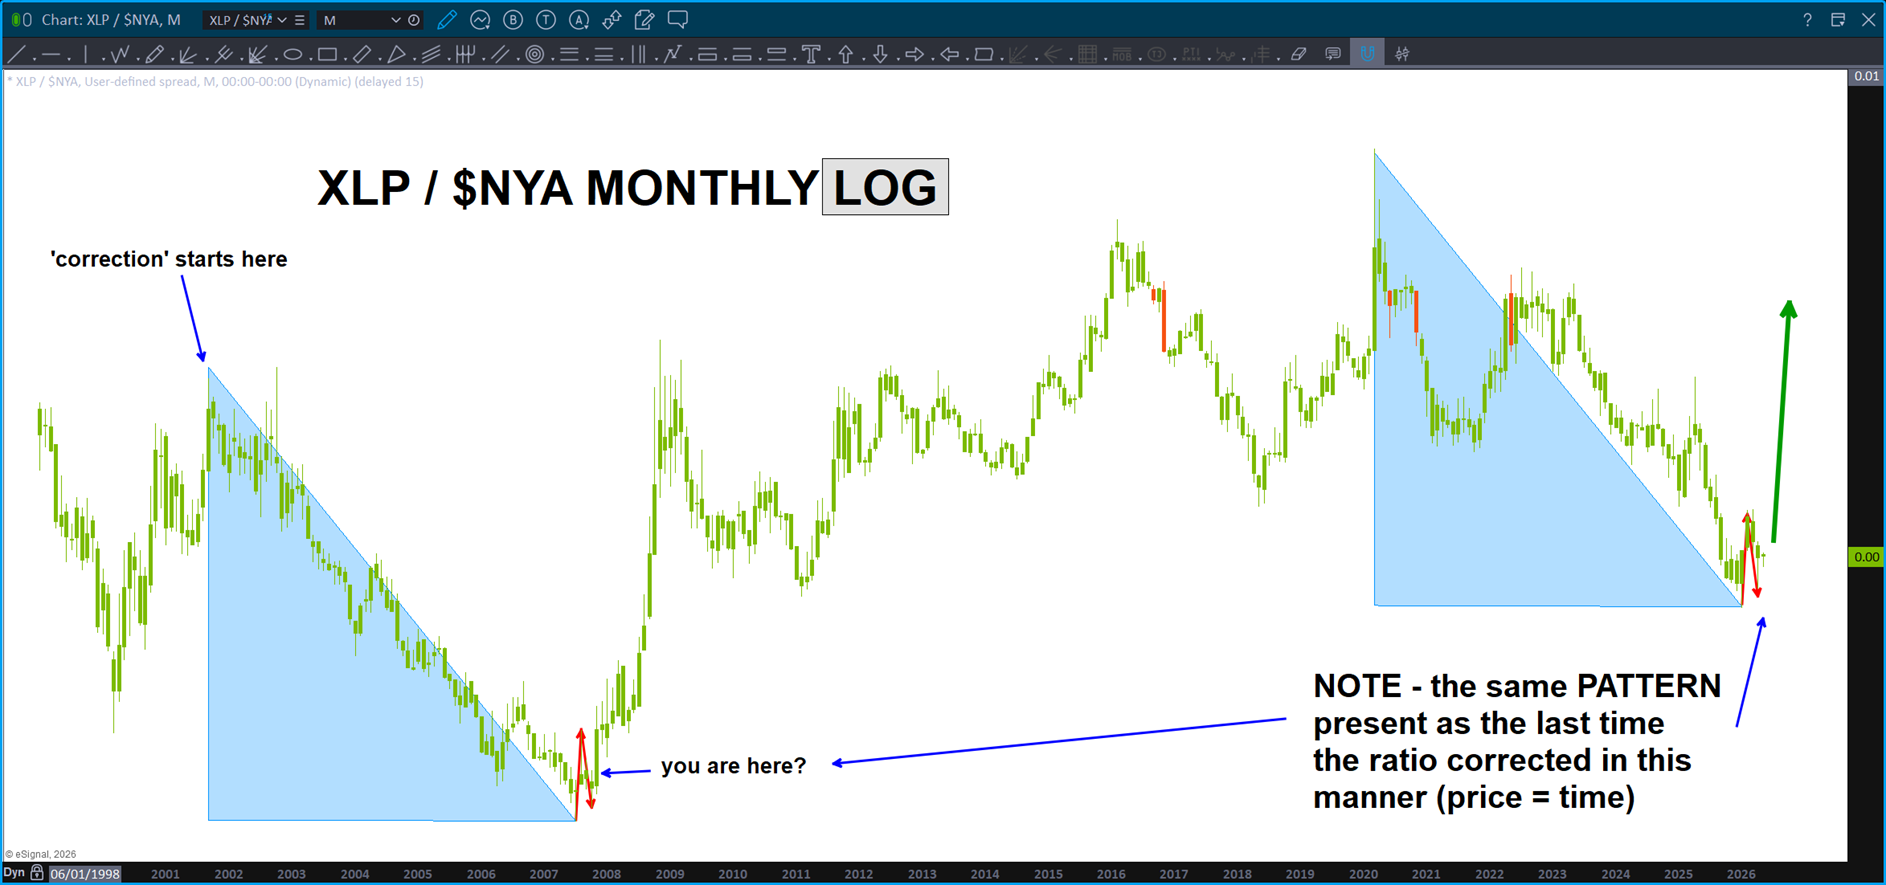
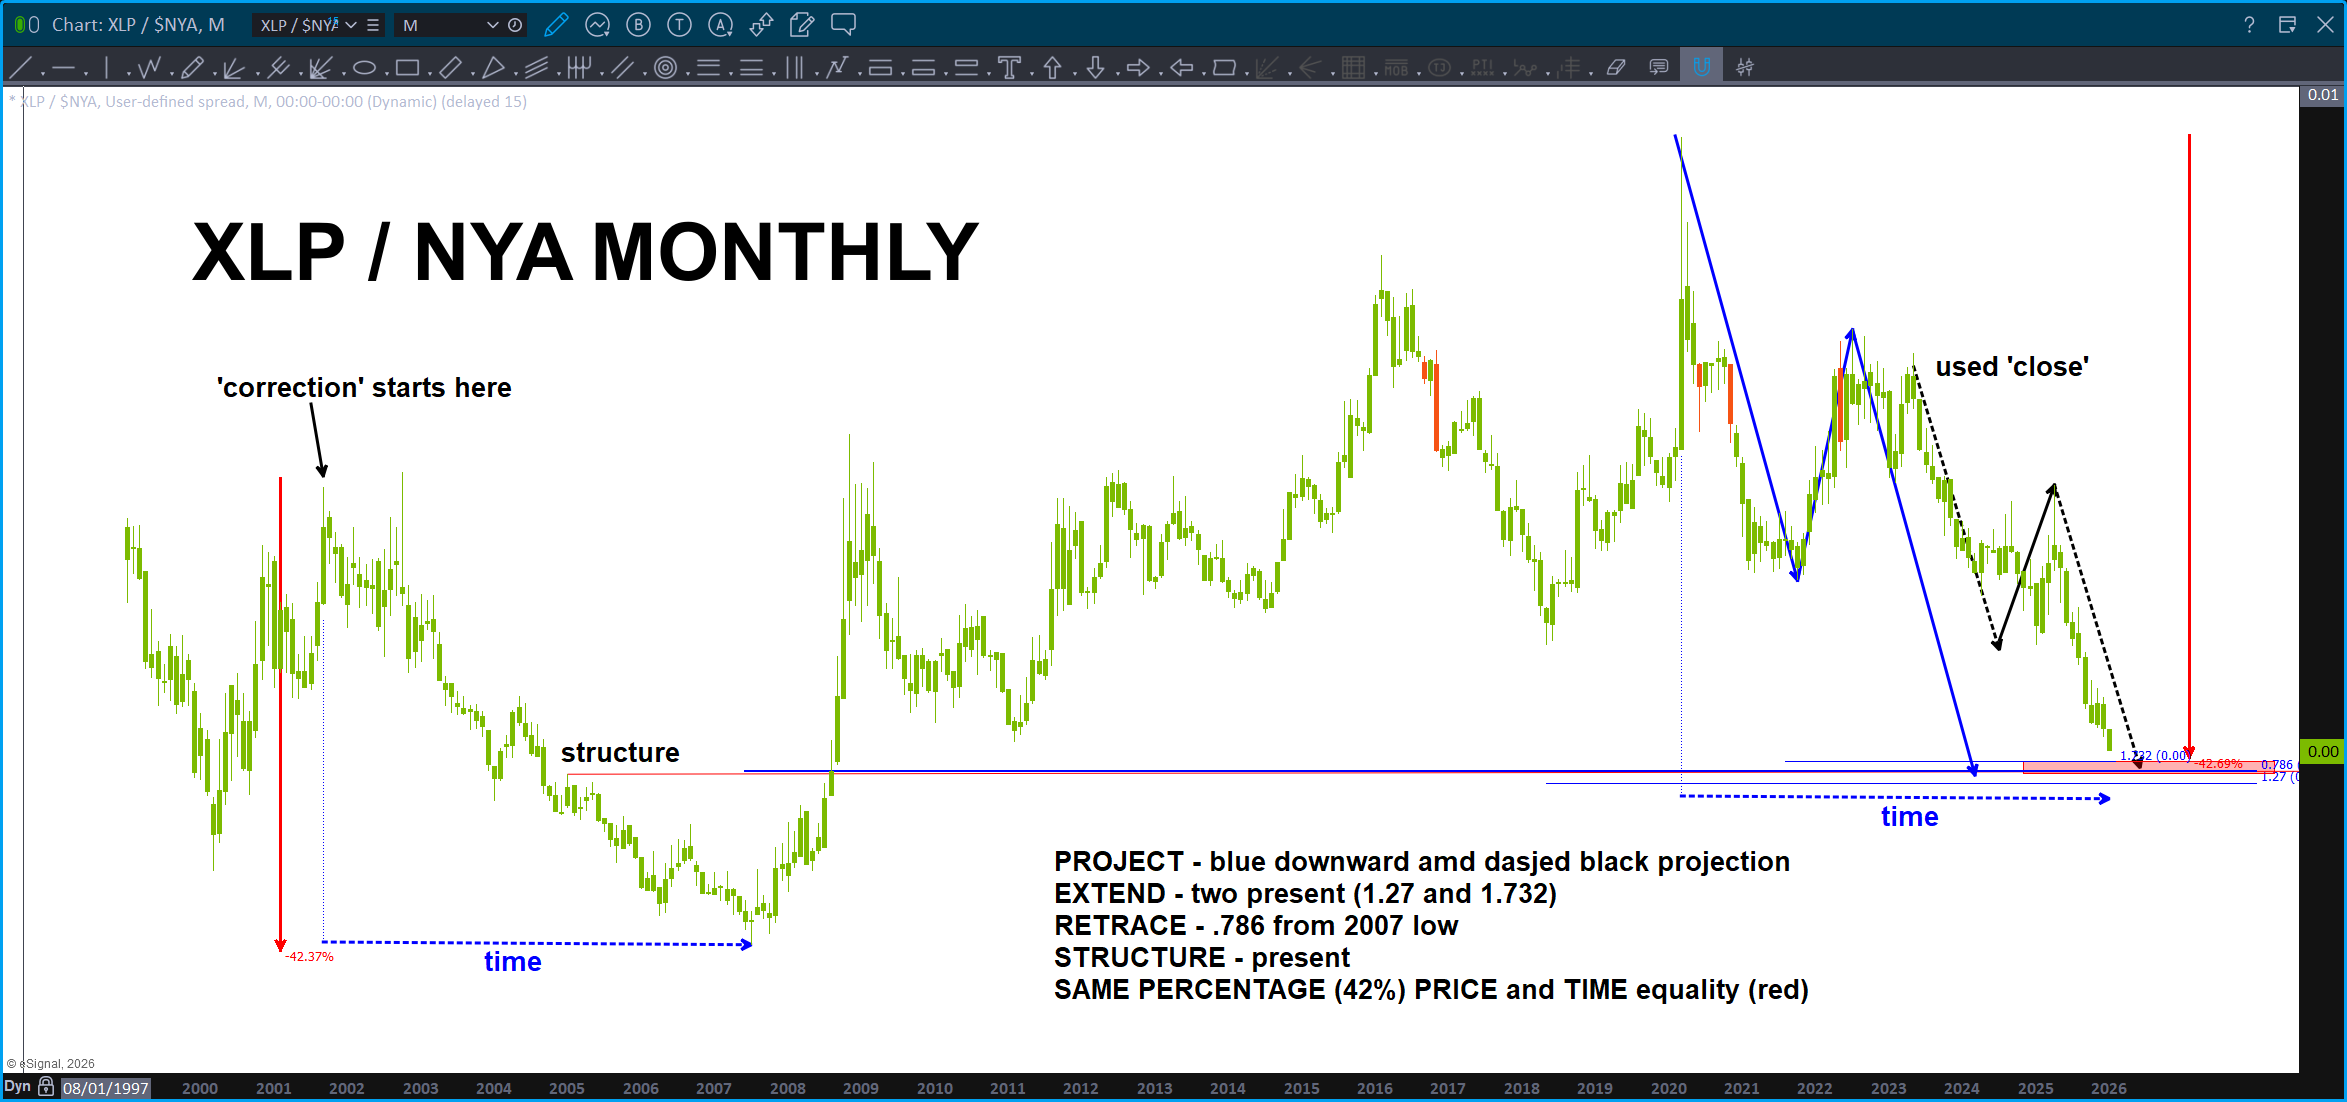
The chart below is truly a picture perfect work of art … it’s a LONG TERM monthly chart on the log scale. Think ‘percentages’ versus pure ‘price.’ The correction that we have just performed matches in both PRICE and TIME the same correction in the past. Why the big deal? It’s a perfect match of the biggest ‘correction’ for the history of the ratio.
Hence, that is why it was a line in the sand. I went on Stock Twits a few weeks ago and said “well, we are pretty much ‘here’ because I knew we were butting right up against support on the ratio and the move was coming – it was either 1/ going to find support and start up (bad for equities) or 2/ crash on thru the biggest correction and the replica of it in price and time. Market would have exploded higher …
Guess what?
Looks like it’s starting back up …
So, w/ the probability the ratio going up versus going down, where could it go?
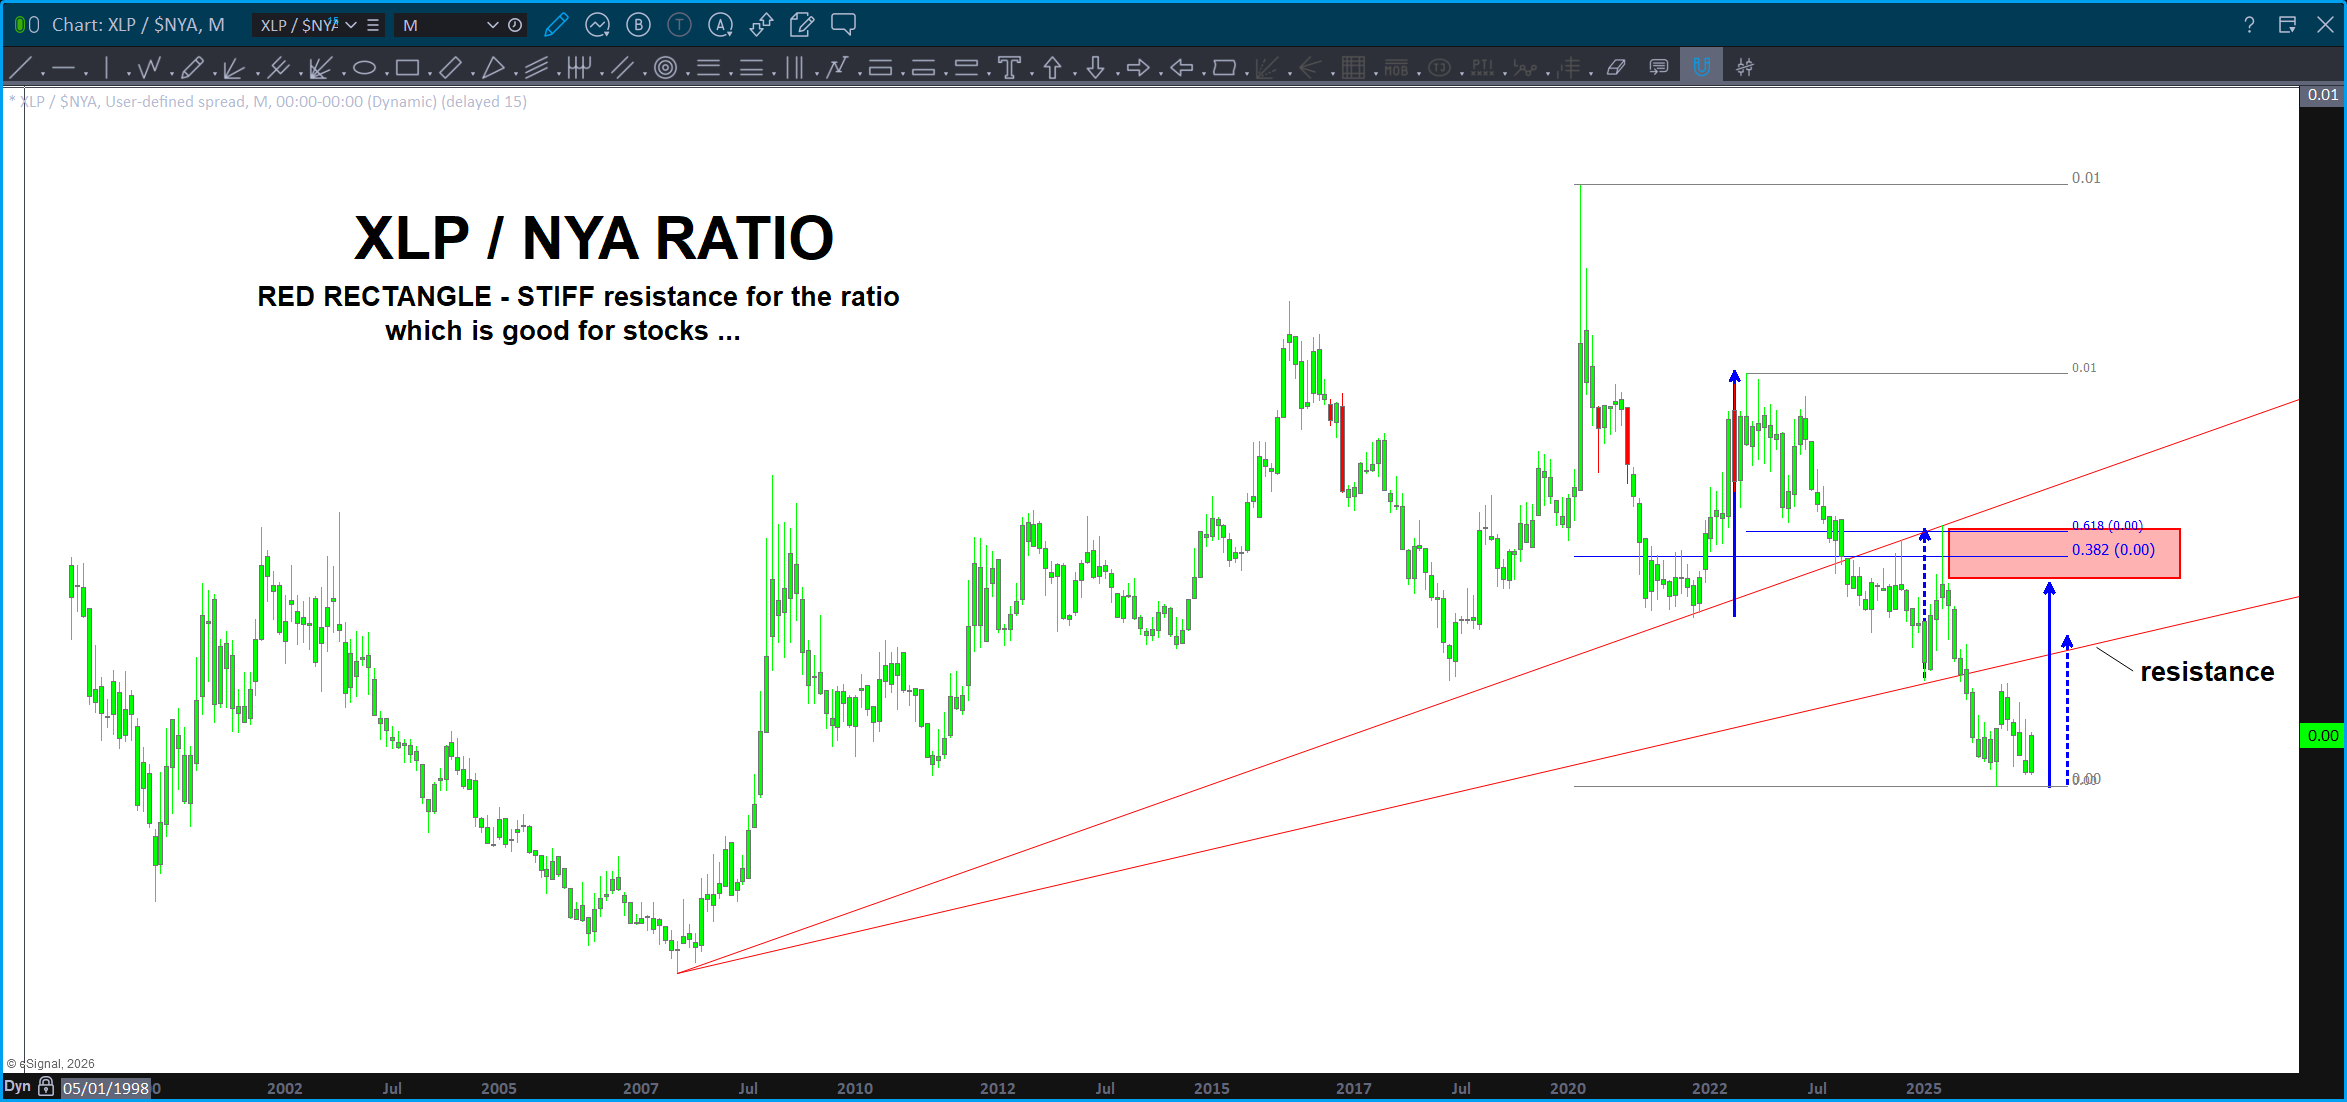
In the chart above, I’m using ‘measured moves’ of the prior corrections (the blue and dashed blue arrows) to PROJECT where this ‘correction’ could be going …
Using the concept of polarity and using the trend line from the all time low we can see that strong resistance ‘should’ be present at the arrow and it’s also about equal to a minor correction in the past.
Using the larger corrective moves and a Fibonacci confluence zone, this is where we will start to think about getting LONG the stock market. Yes, that appears to be a far distance and, frankly, it is.
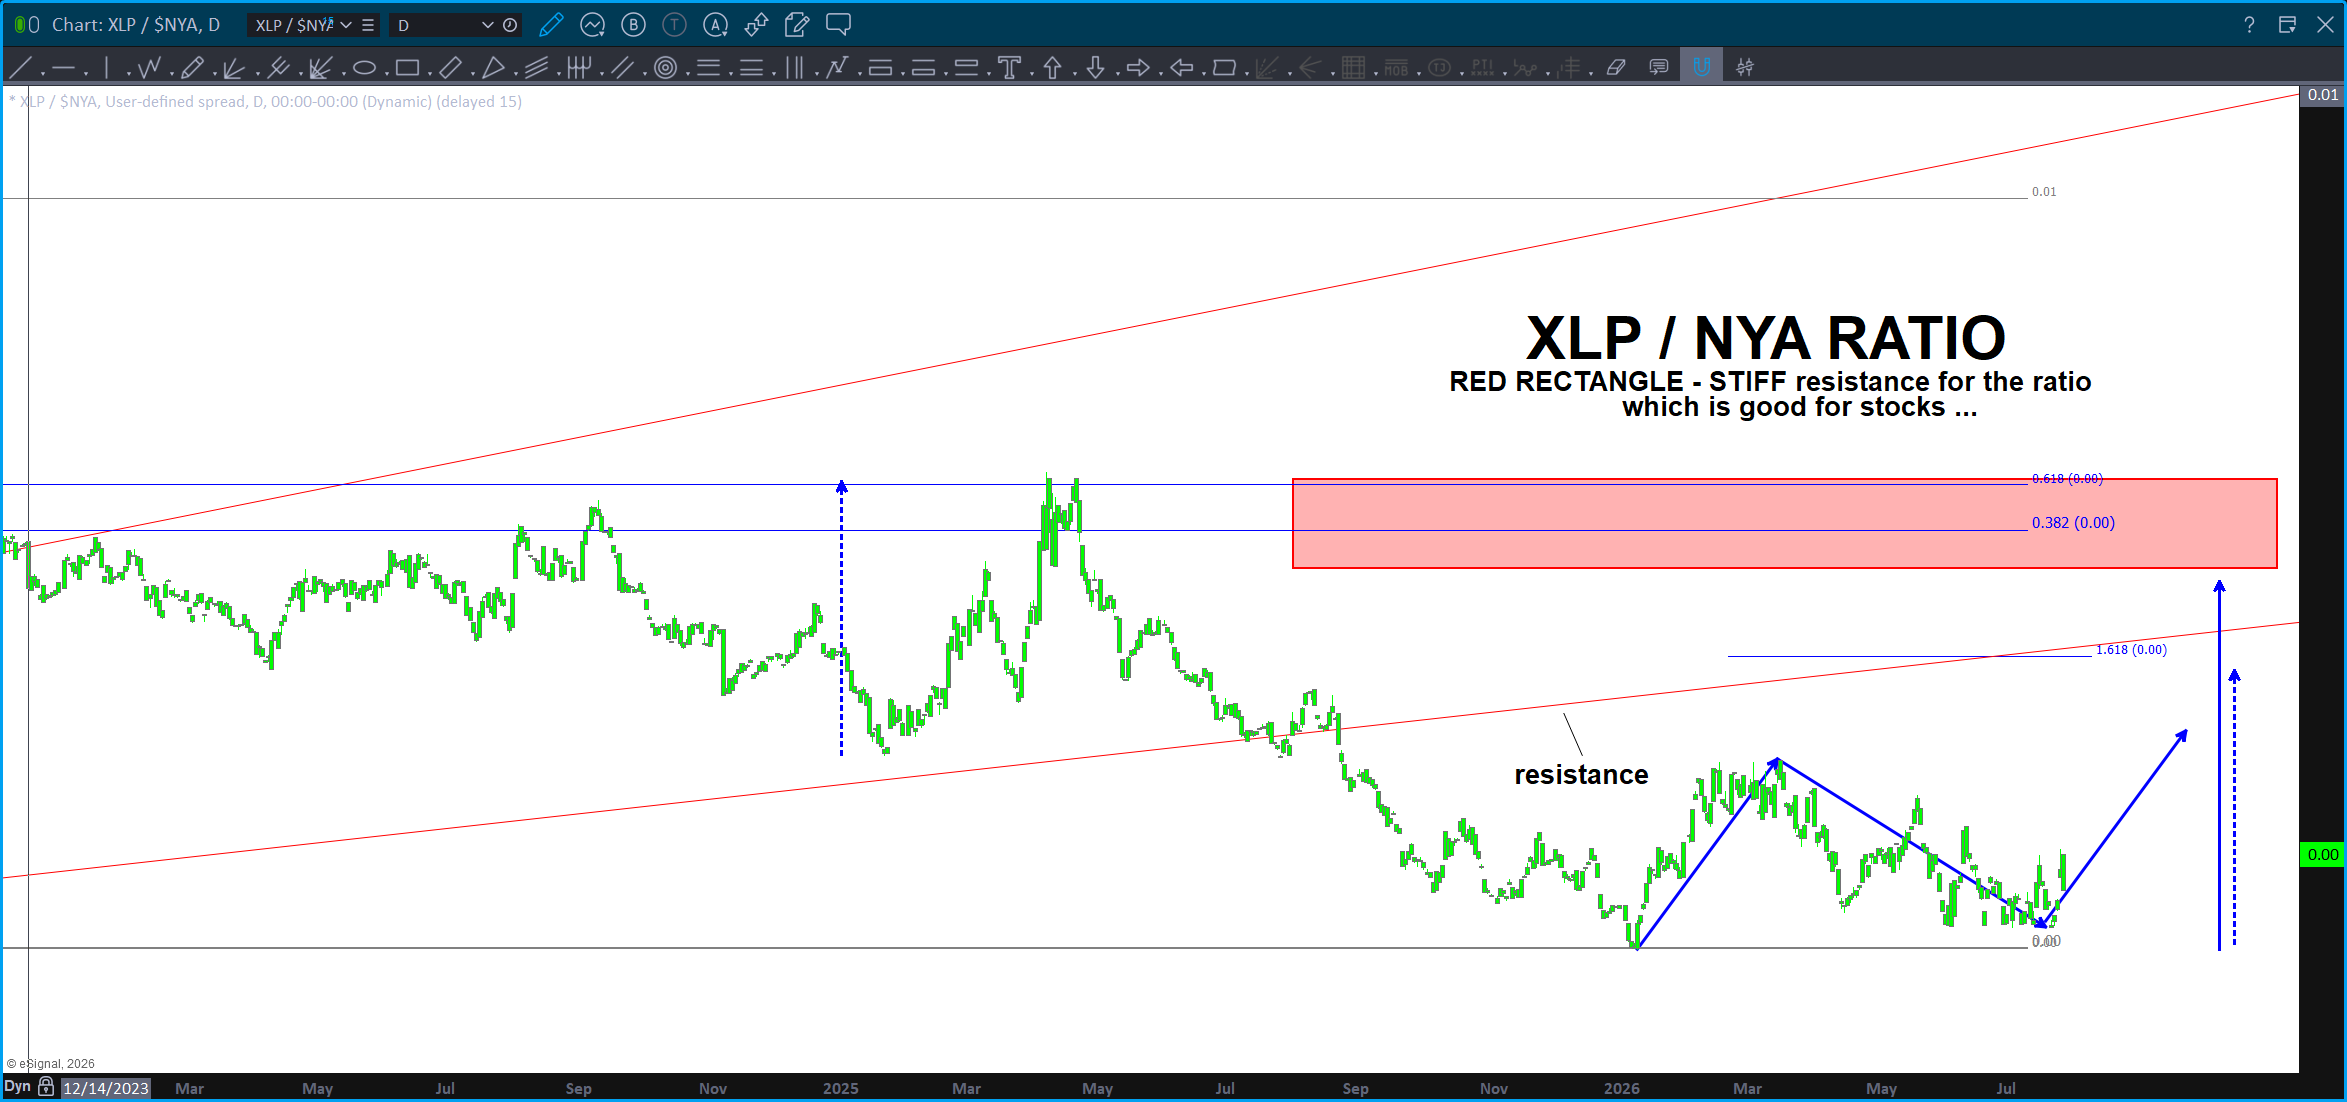
Above is the daily chart – take note we have moved from Monthly, Weekly, down to the daily. Always funnel yourself into time frames where you can take action. As discussed above, the target zones are above. It doesn’t ‘have to’ go all the way up there … we need to see strength in the rotation (as in continued selling – the institutions – who most of the time have to stay invested all the time – are getting out of speculative holdings and moving over to good old Toilet Paper!
Also, take a look at this target on the JUNK BONDS. Yup … I was telling someone the other day, forget who it was, that the Junk Bonds have been diverging from the markets and that’s usually been and ‘other’ in the world of goods and others. Looks like the are selling off, below, but also look at the VERY powerful support confluence on JNK. That should be STRONG SUPPORT.
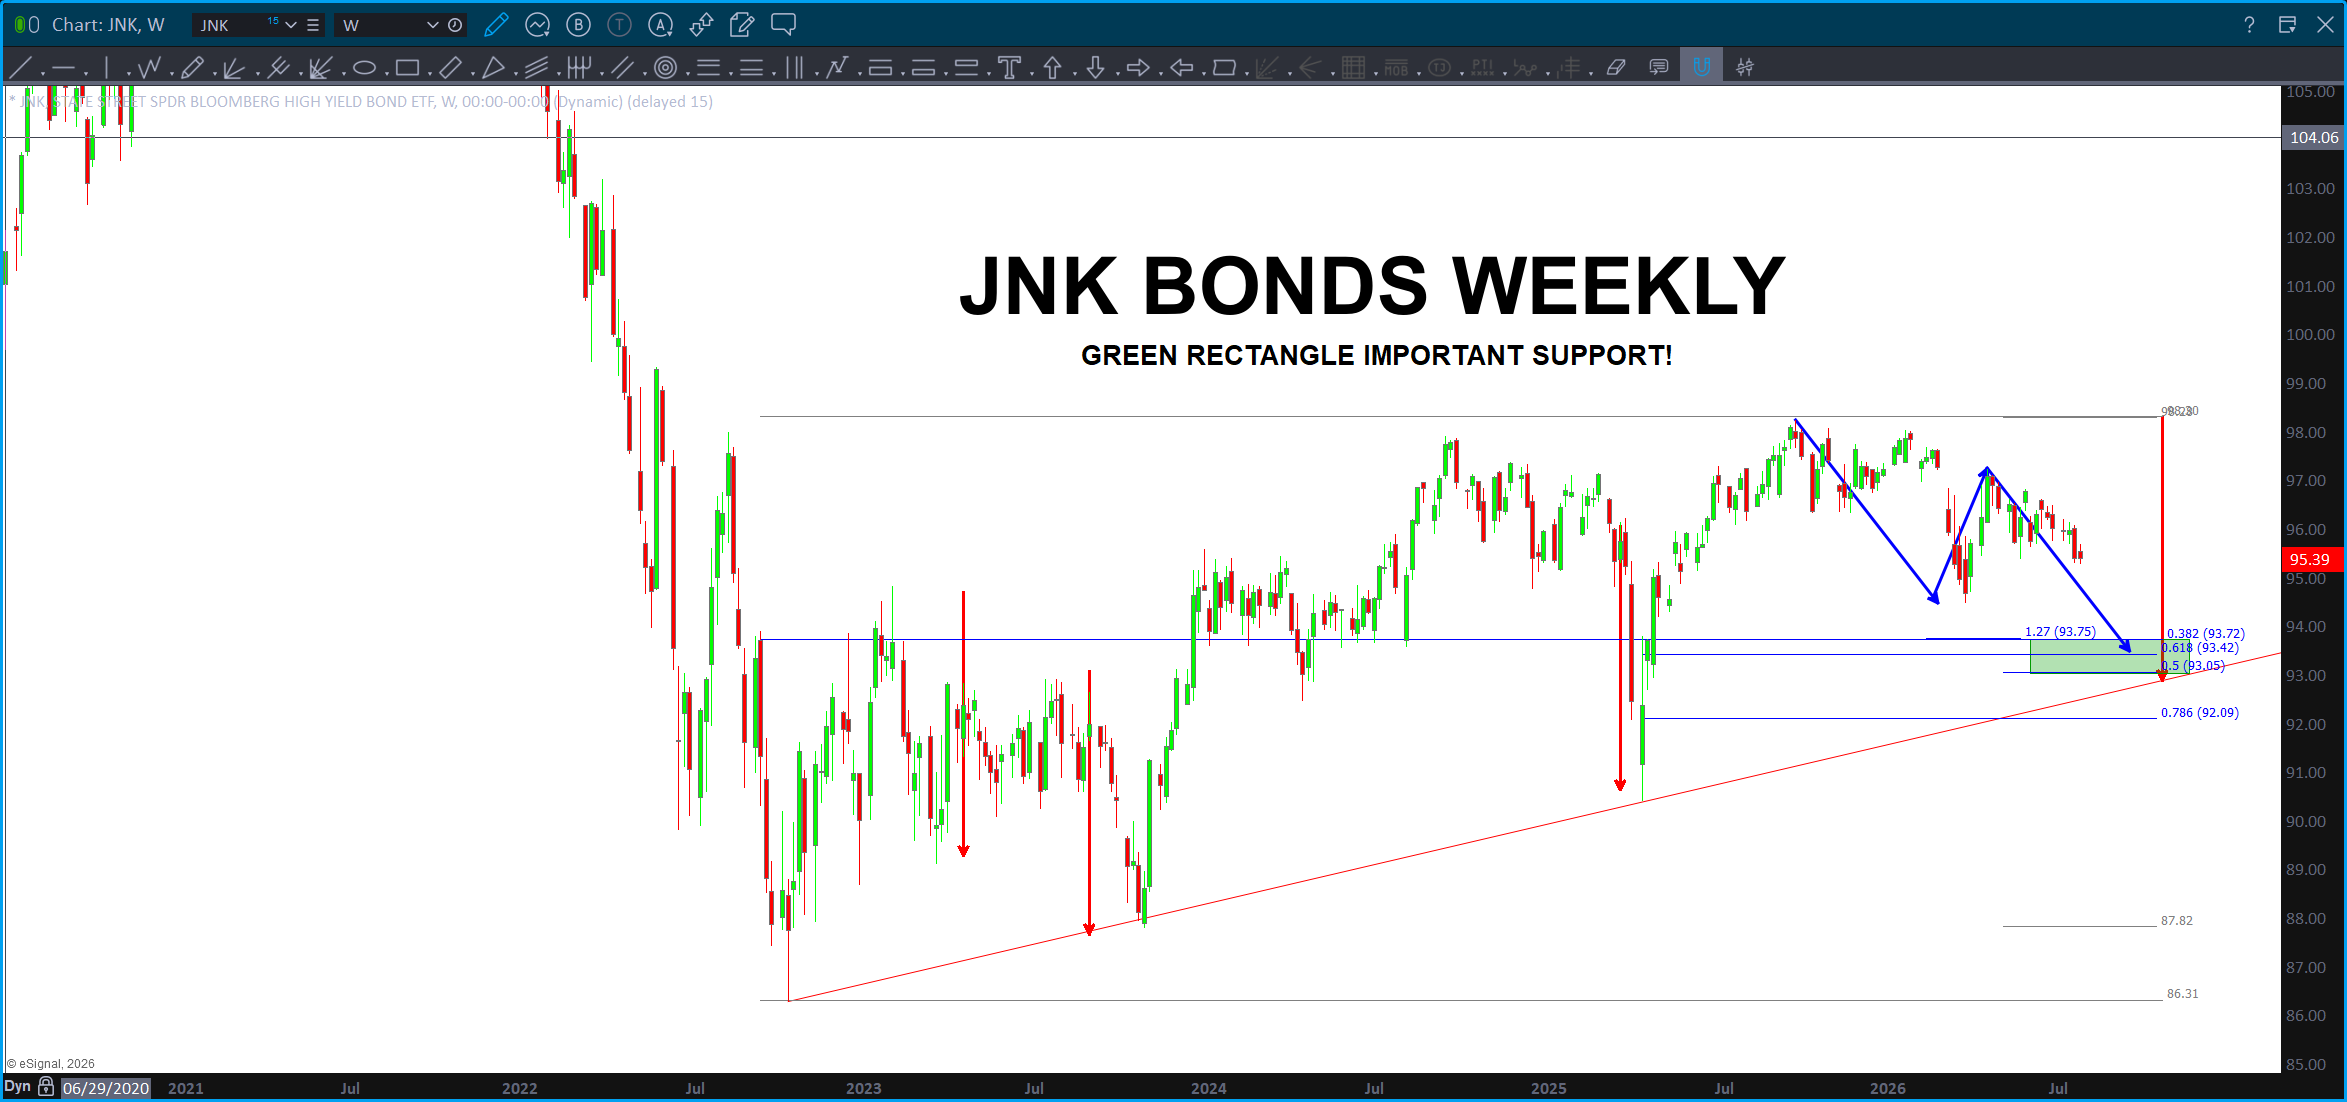
This is a weekly BUY pattern w/ a zone showing measured moves, ‘the’ bullish trend lines that have kept the junk bonds alive and a bunch of ‘numbers’ creating a confluent zone. If we are going to get a ‘first clue’ IF this is a BIG TOP or if this is a pretty normal, perhaps a little scary because ‘some’ sectors of the market were going parabolic but for the ‘steady eddies’ they’ll correct but, ultimately, release some steam and then start chugging again.
The pattern shown on the JNK is, in my humble opinion, THE level to watch for the severity of the correction. W/ today’s sell off it sure looks like some selling will continue in conjunction w/ the JNK so, simply, expect that. Let’s get really really interested when price approaches the green support – BUY – zone. That’s a good first line in the sand to see what’s really going on …
Technology or Toilet Paper – Mr. Institution?
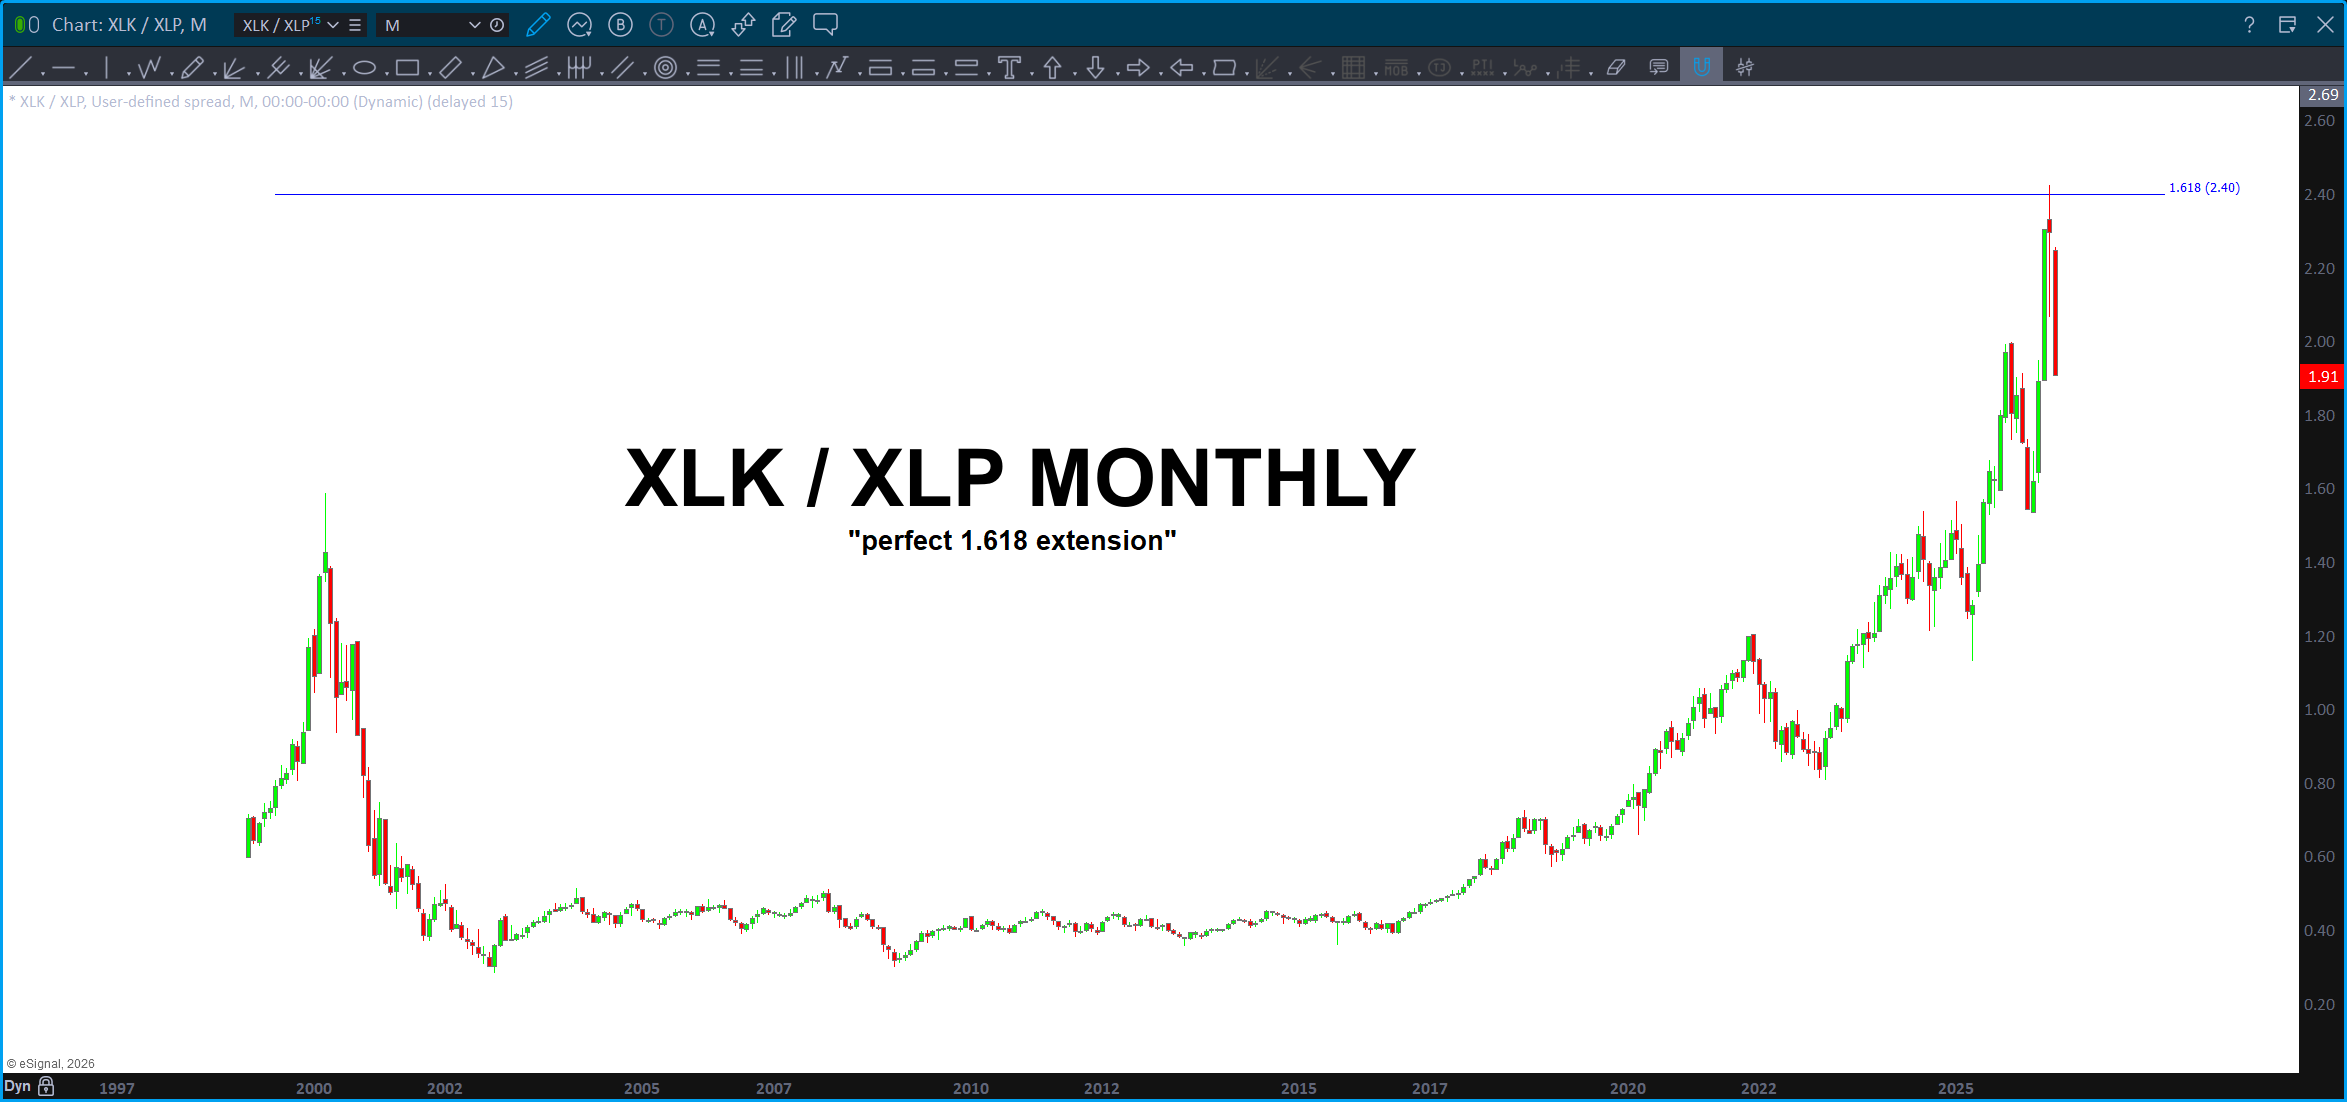
The XLK (technology)/ XLP (staples) ratio slammed right into the 1.618 extension and certainly looks like it wants to go lower …
So, some good targets for the ratio. My bet is the patterns have held and today’s price action gave us the first hint to expect some selling. The real severity of the selling? We’ve got some perfect targets below …
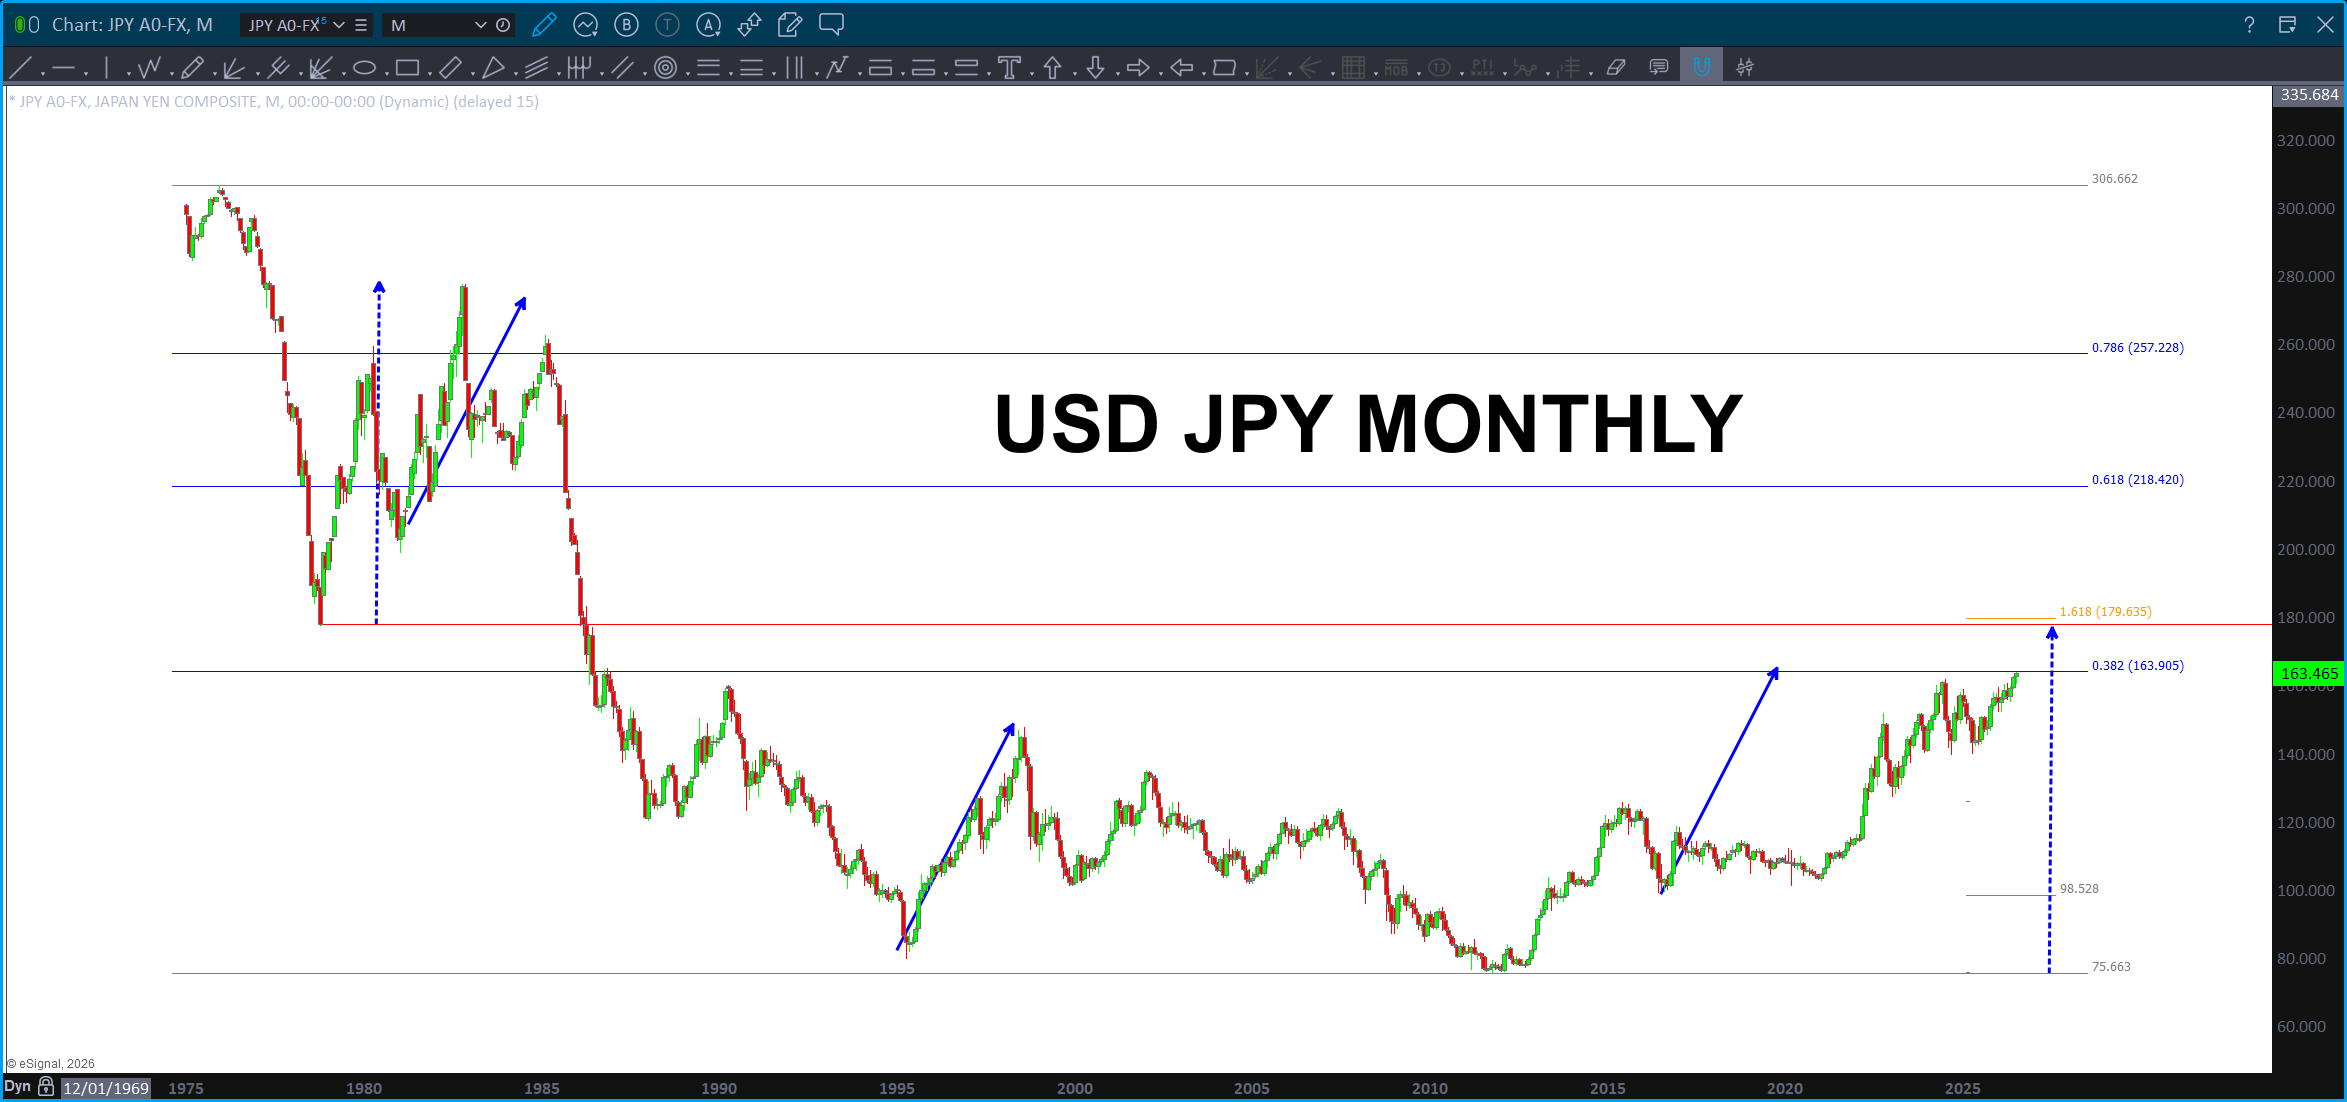
Keep an eye on Japan. The Yen keeps losing strength, but there is quite the thumping going on, unfortunately, for our Asian friends and their markets. No kidding, people were SO LEVERED they are getting wiped out … does this mean it will be a contagion spreading to other markets? I have no idea, objectively. Subjectively, just me who isn’t a fundamentalist at all. (Not smart enough.) But, wouldn’t it make sense that there would be some reciprocal selling? Probs …
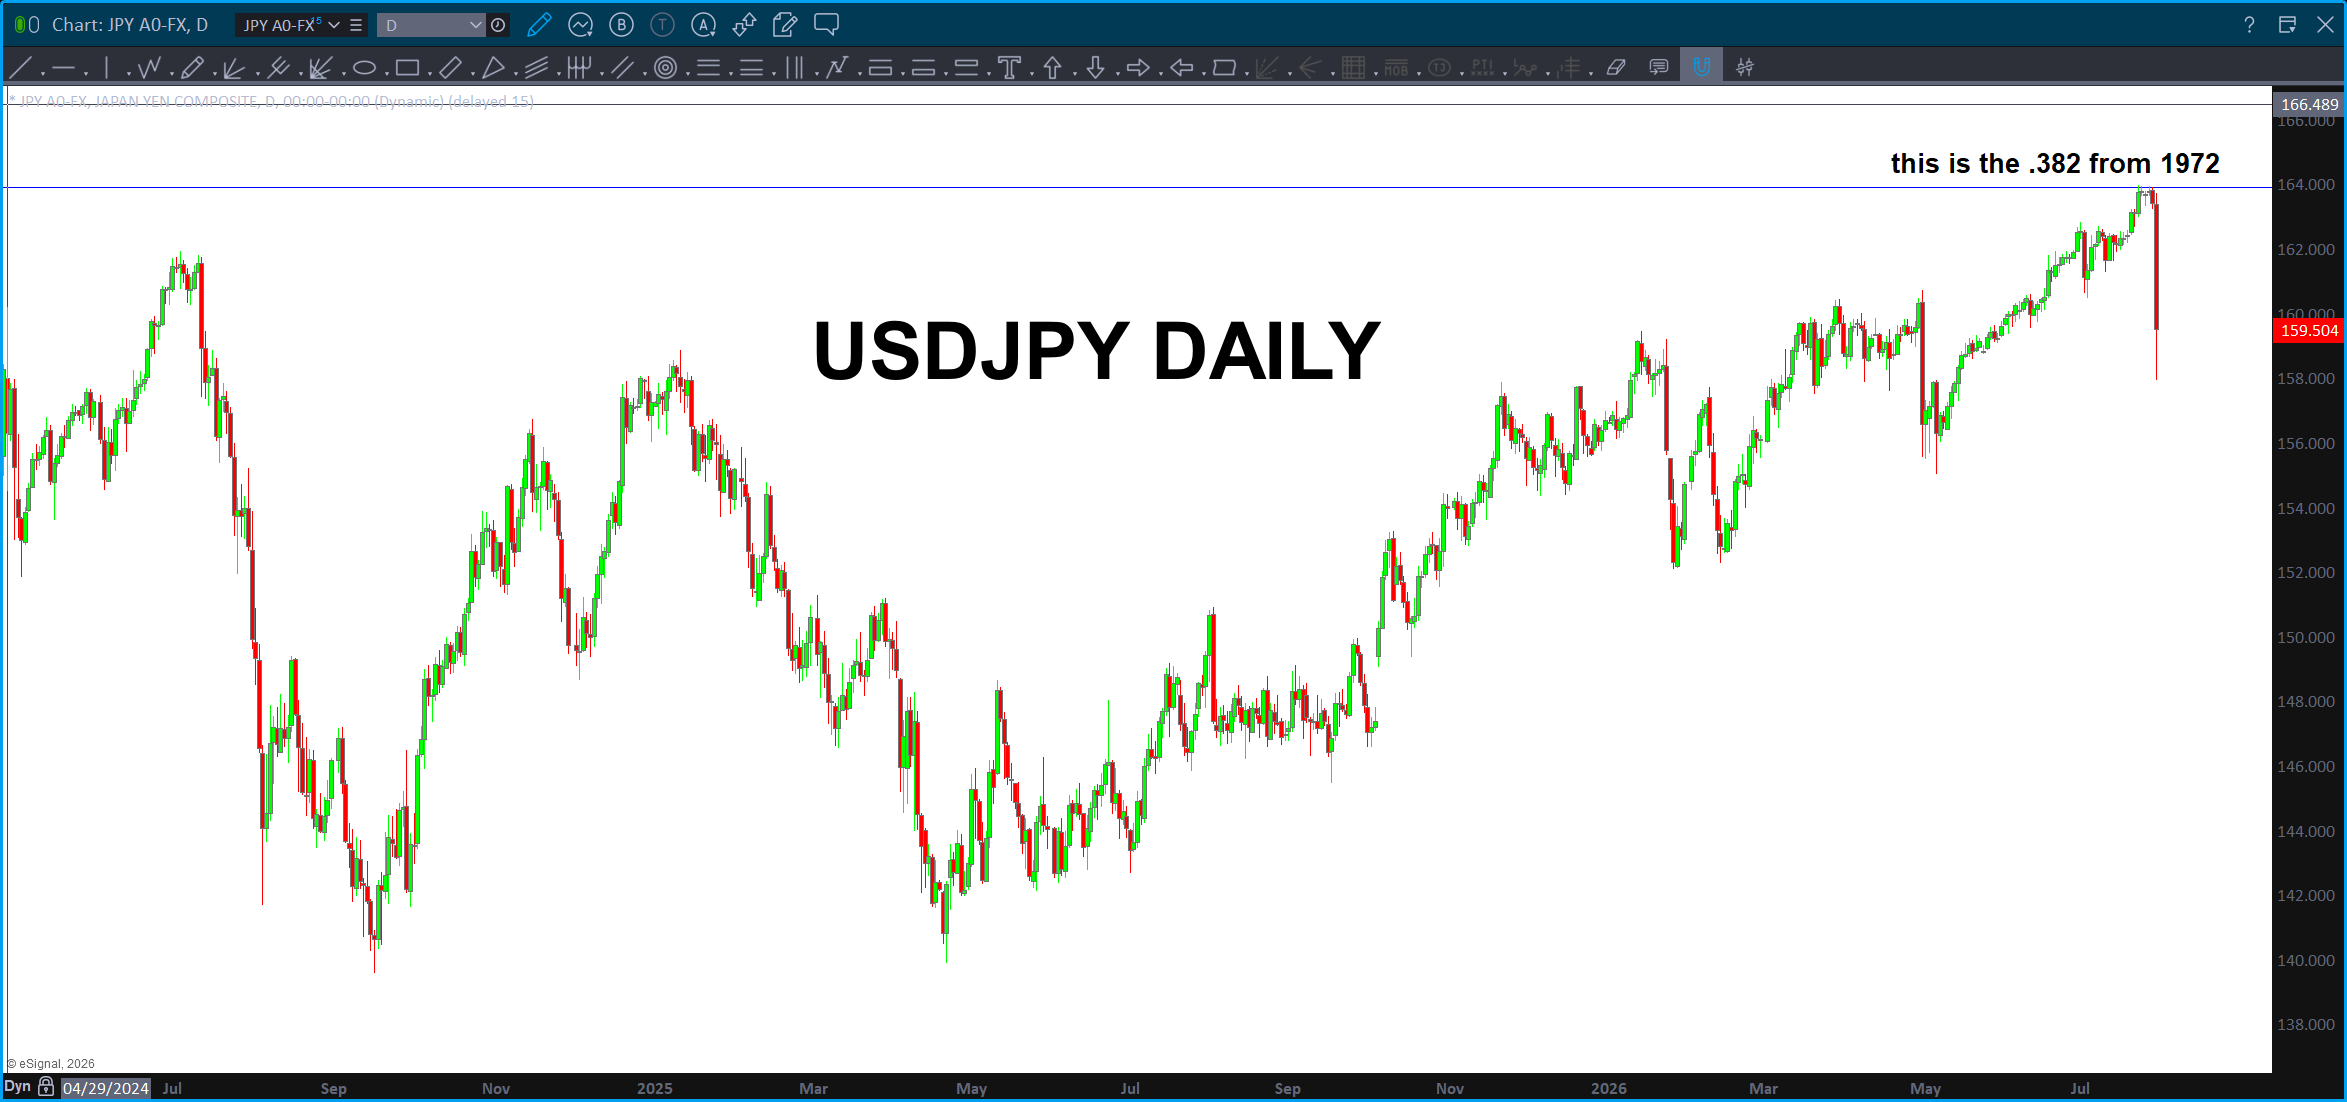
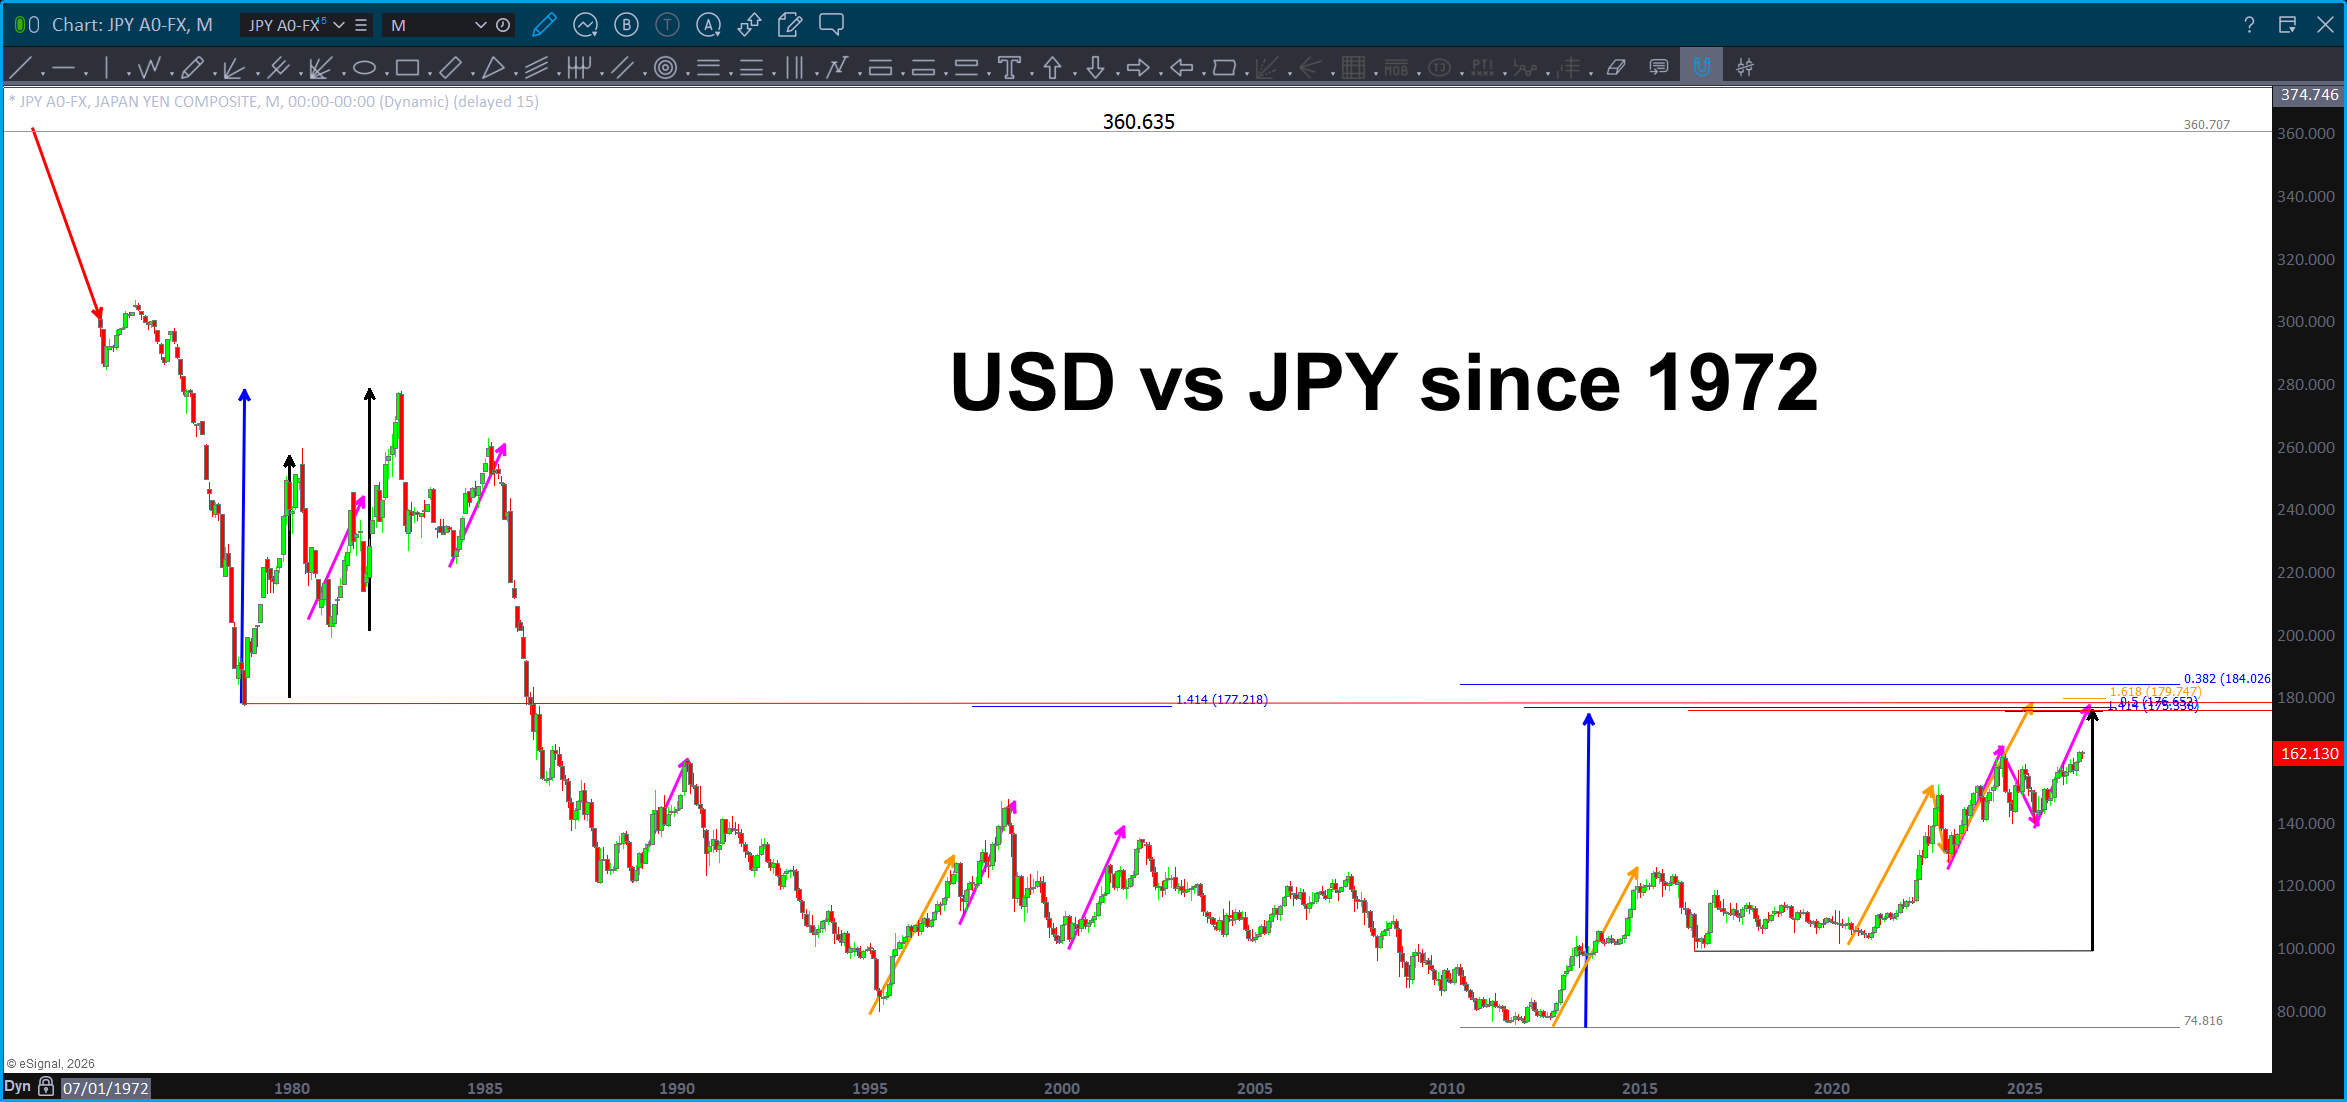
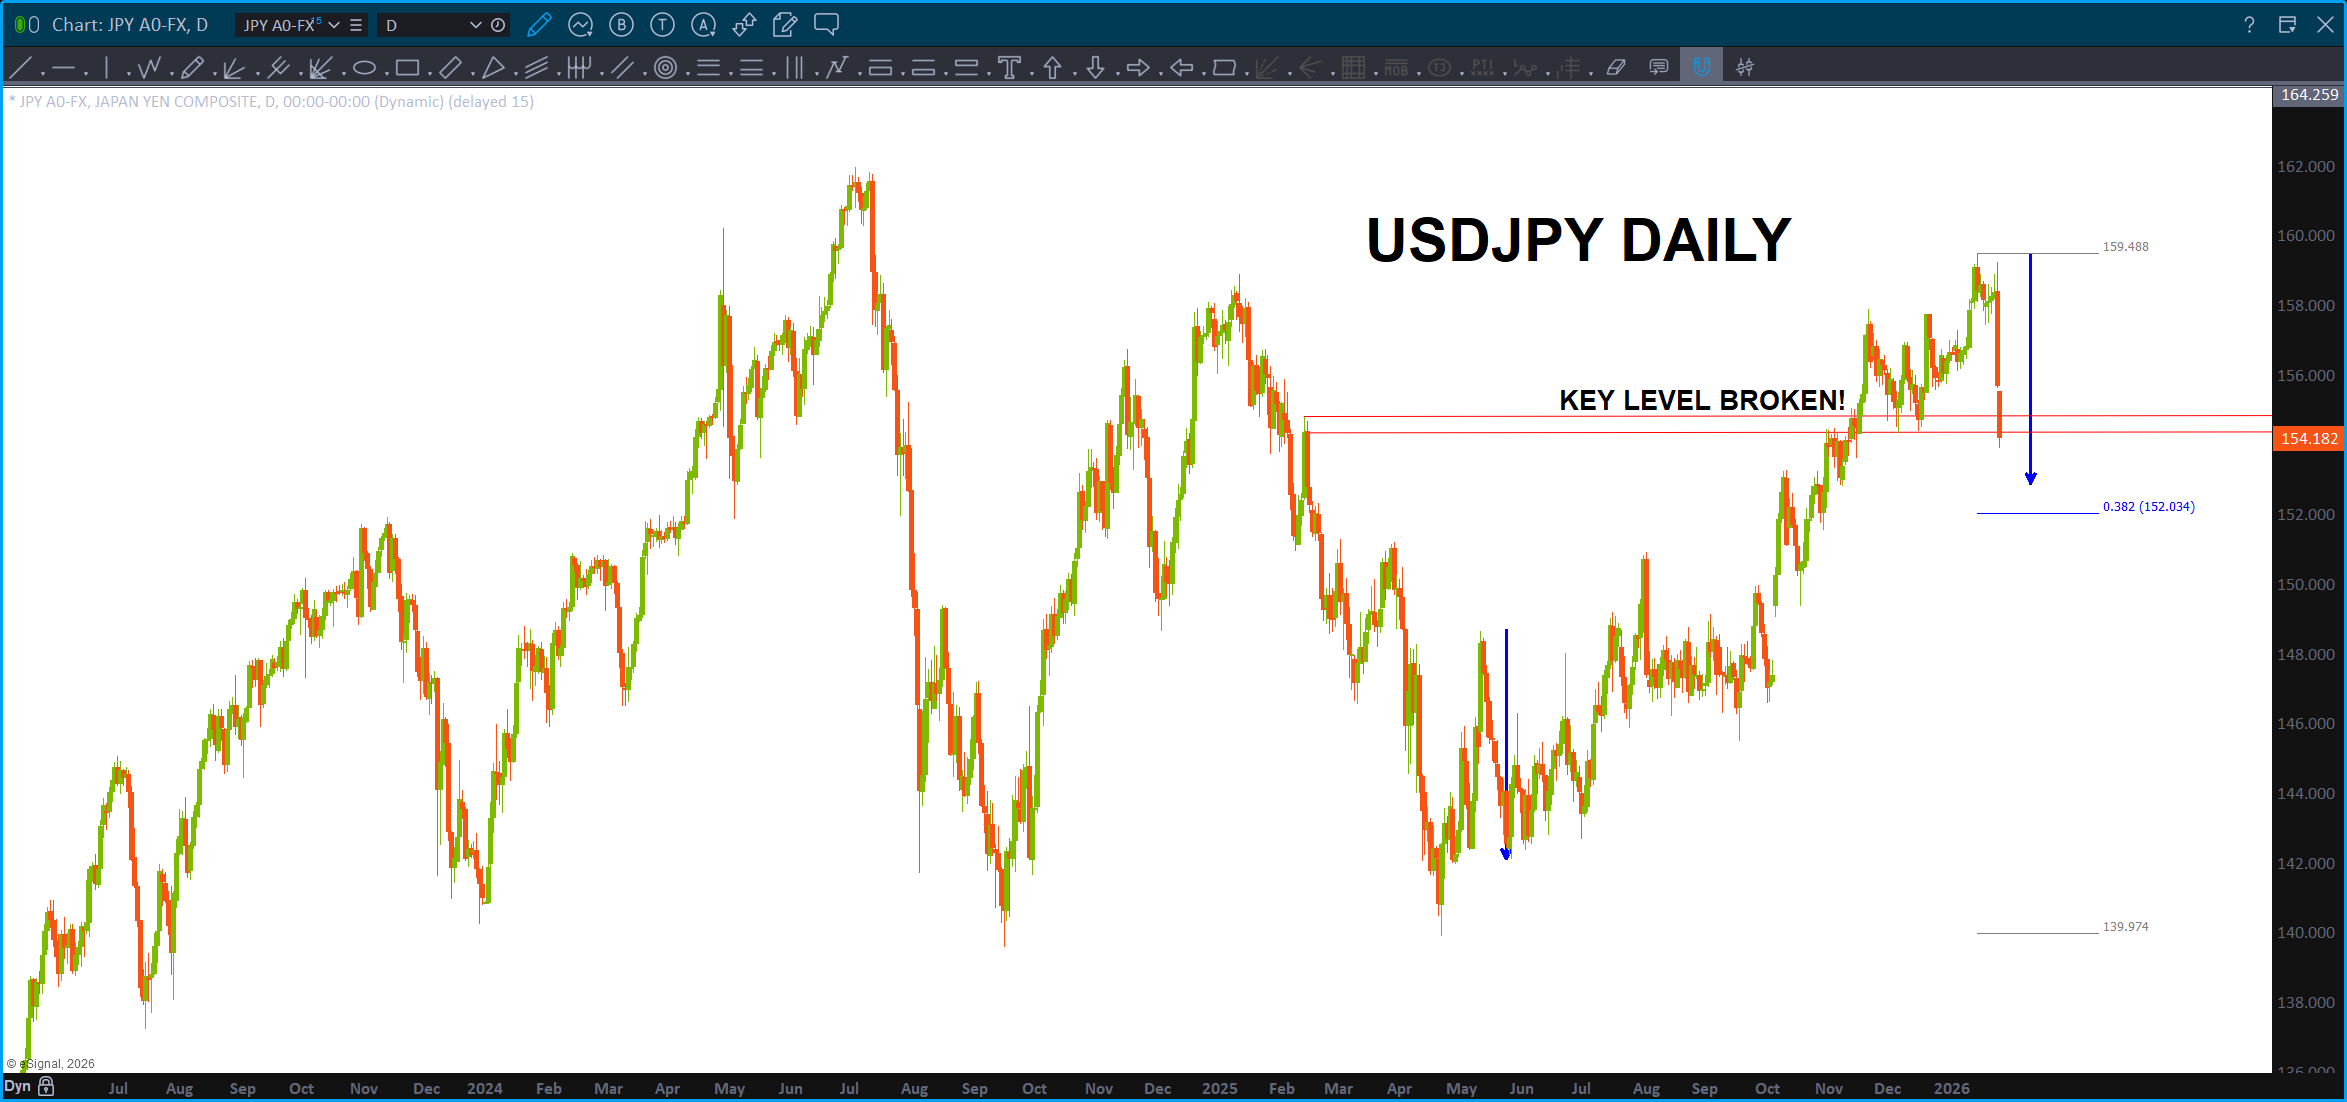
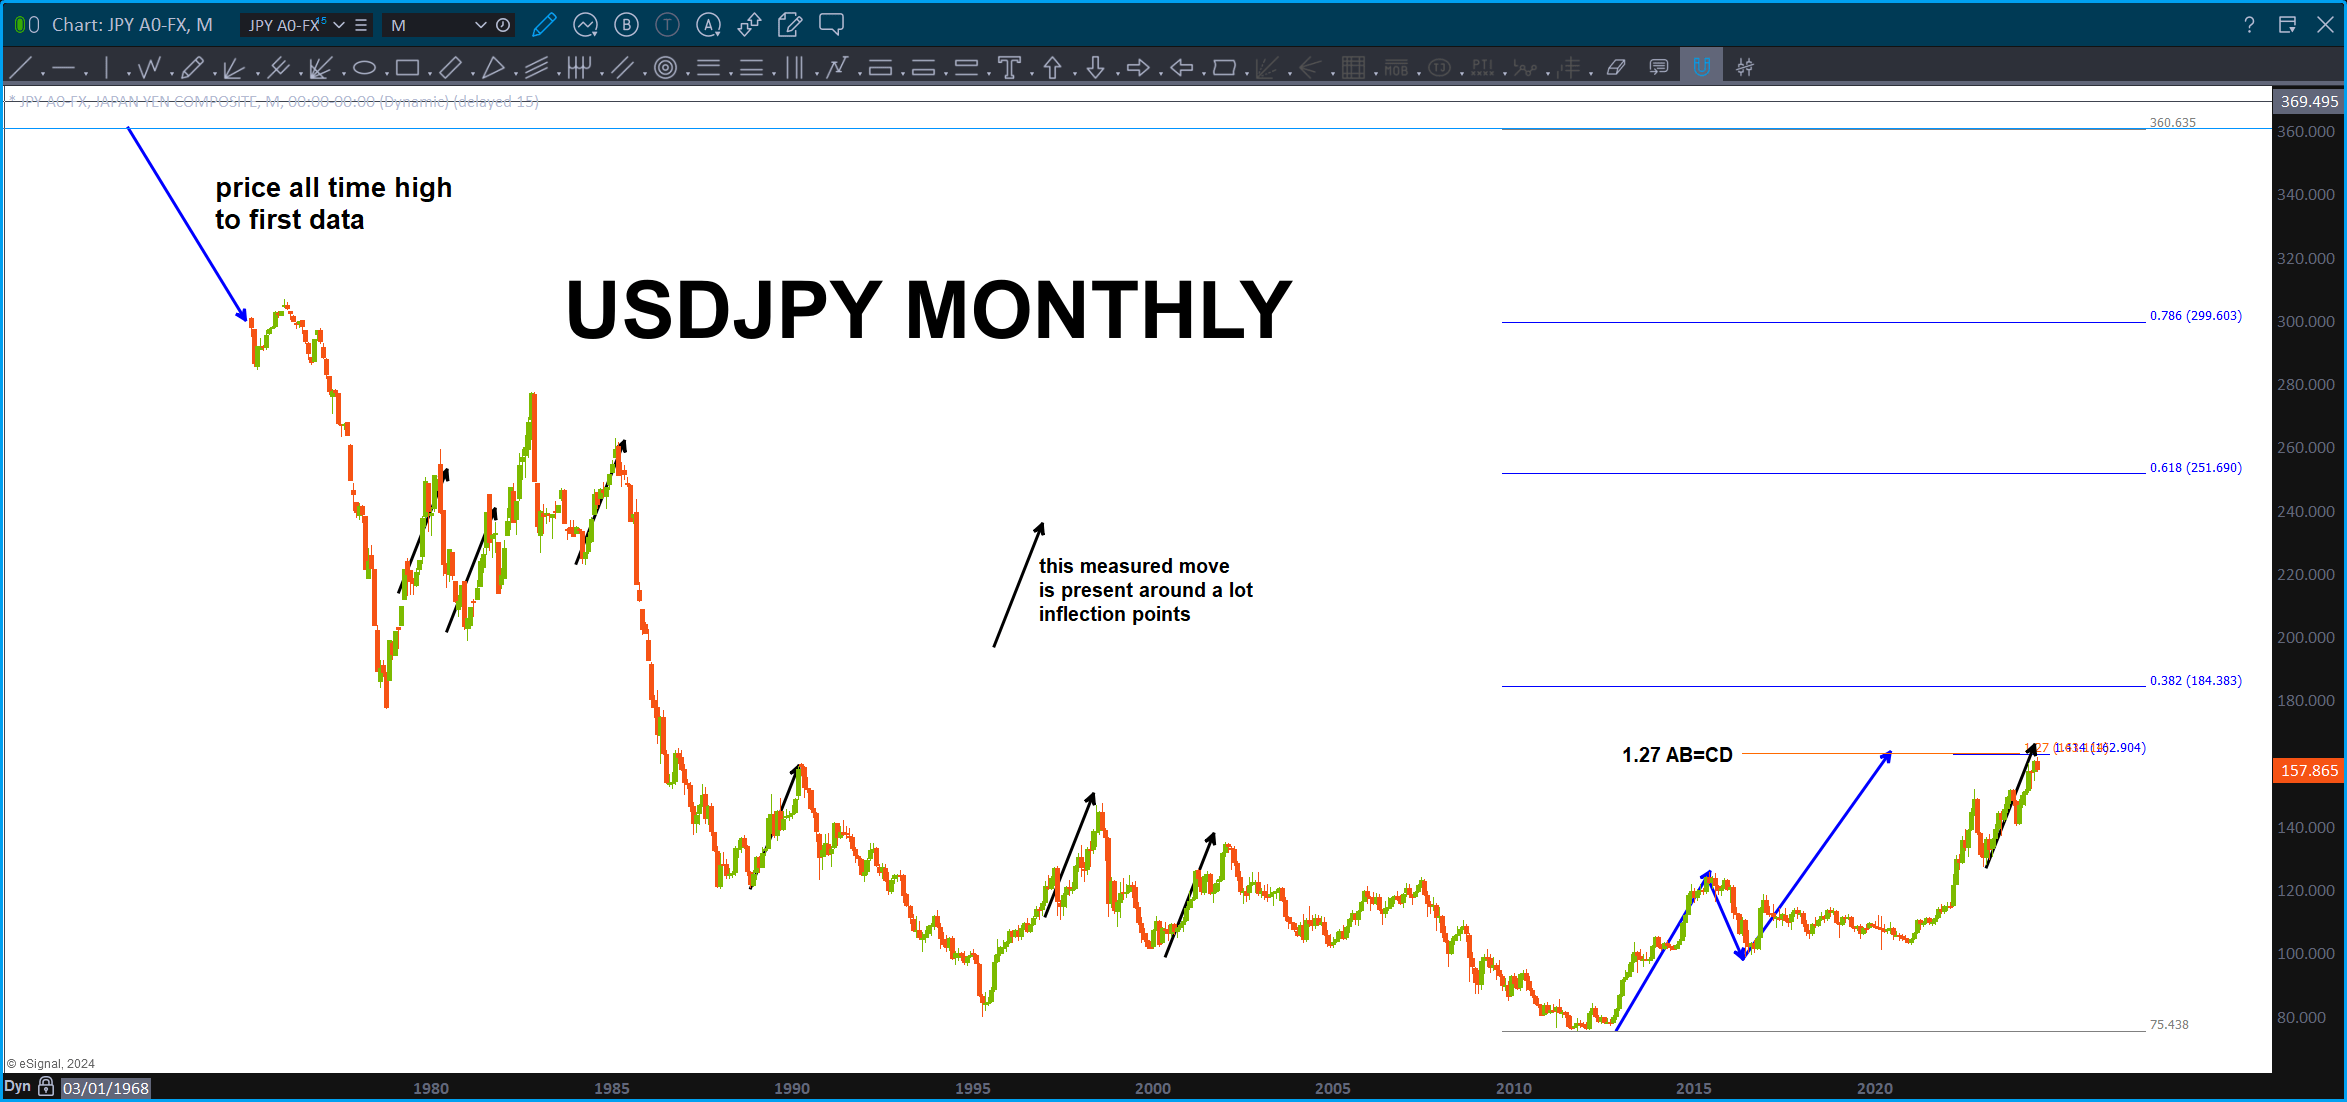
And here is the USD vs JPY. Check that out – right at the .382 of the entire bear market run from 1972. Hmmmmm resistance anyone? If that doesn’t hold it, we have another set of strong targets a little higher also. Keep an eye on the Yen!
Attractors … July 23, 2026

I think I’ve mentioned that for the past few years I’ve talked to my buddy Ponch probably 3-5 days/week. Sometimes every day …
I think, I really don’t know, that we met each other at intersection points of time/space where he needed to kick into the platonic space and I needed to understand the creation of reality. Seriously, how does the brain PROJECT this reality? Why? Well, if your reading this blog, you know that w/ pretty good probability – I’m the first to admit the patterns do not always work – go thru this blog you will see where the geometry was pretty darn good.
So, the question is – why? Geometry … ?
Just watched the Zach Bush and Joe Rogan Podcast and, first, watch it … but second, he talks about Geometry … that, literally, the hieroglyphics on the walls of the pyramids had the ability to HEAL. TILT …
For me, the answer was OF COURSE, as frequency is truly the finest medicine.
In this case … frequency and the hieroglyphics? TILT.
Even the very hairs on your head are numbered .. it’s all vibration.
So, based on a certain shape that enters the ocular field and stimulates some/one of the 12 cranial nerves that PATTERN (just the shape) creates a signal (vibration) w/in the neo-cortex that sends the signal to HEAL. Different body parts have different frequencies on a stand alone basis and as part of the entire orchestra of the body. When we are able to provide harmonious frequencies which, in a sense, tune the organ that is under stress, then we can create harmony and equality and ‘neutrality’ w/in the universes of ecosystems w/in the human body. Why, my friends, do you think the things that bang out music are called ORGANS? Why the amazing mandala stained glass windows and geometric shapes w/in those windows .. while in CHURCH you get the stimulation of the music (frequencies), the geometry of the windows (frequencies), the smell of the incest (frequencies) and, of course, the “lean to the right, lean to the left, stand up sit down fight fight” monotone movements w/in, was for me, the Catholic church. Still … think about it.
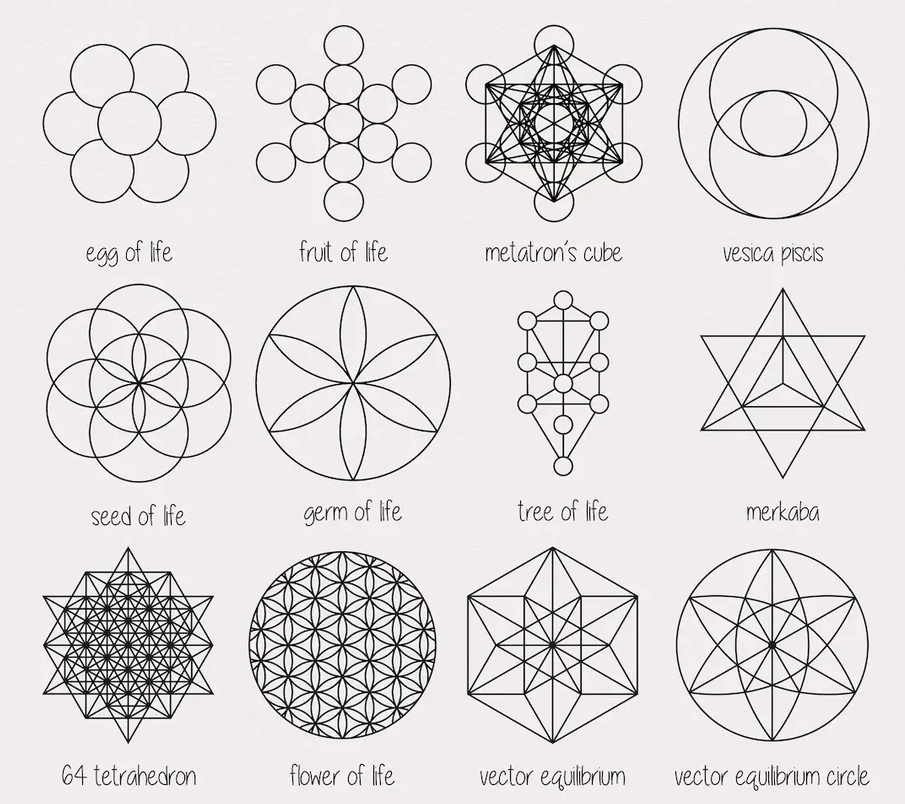
So, I’ve always wondered ‘what’ to call this type of technical analysis. It is pattern recognition. Yet, when I hear that I think of the classic patterns. Not patterns derived from sacred geometry, music theory, euclidean geometry or Metatron’s Cube. Perhaps it’s simply Attractor Hunting?
Ponch and I have gone DEEP. At a quantum level, we believe that anything that is thinking of – Amazon – will meet at that vibration. Anything to do w/ Amazon … out of the meeting of vibrations, a geometric shape emerges. The same geometric shapes that emerge from nature and life that allow our brain to comprehend, at quantum speed, the multiple mouse clicks of information that are coming thru our 12 cranial nerves (instantaneously). How does it do it …
FRACTALS. The reason the free energy principle WORKS is because of the perfect fractal nature of the universe. If you were the architect of these avatars (perhaps you/we are, perhaps not? ;)) how would you do it …? You would make every piece and part that makes up the fabric of reality grow/expand and form based on one universal constant. 1.618
Think about ANYTHING that GROWS from nature … it’s the Fibonacci sequence. It’s also the merger of male/female or the dark and the light. You getting it …? So, if everything is going to grow based on the SAME principle. What about the geometry? How would you do that …?
Close your eyes (I know you can’t because your reading this) but after you read, then close your eyes …picture the darkness. With our eyes close we experience/feel the darkness. Yet, GOD said “LET THERE BE LIGHT” … so picture that darkness as the single point of singularity. From that point God SPOKE (that’s why we need to continue to refine our speech as they are cocreators of this reality) the first AUM or vibration. At the end of the first AUM was the end of the first line. From the point, to the line … so how do we tie this frequency, this beat together? We create the circle .. the representation of time and the orbits of the planets, which, OBTW God CREATED the Heavens and the Earth and used planets to tell time and give memories of seasons. Look it up, it’s in the Bible.
So, now we have the first circle. You CAN NOT divide perfection … but, you can replicate it. So, the 2nd circle is created. Boom, see my last blog on the Vesica Piscis.
Go back and read .. it’s the USO Vesica Piscis.
BOOM .. there it is. Remember how I showed how EVERYTHING is created from the radius of that first line or measured move on a chart? Now you getting it … from that Vesica Piscis the square roots of 2,3,4,5 are derived. Well, why square roots? Boom .. musical theory. Frequency of a string being equal the square root of its tension or 1/square root of it’s length. Square roots and inverses = big deal.
To continue our thread … the first 6 days of creation are the seed of life. Boom …the 7th being the point of singularity – or the SUN.
From the Seed of Life we go the Flower of Life. That amazing geometrical shape … and then the flower of life BLOOMS into Metatron’s Cube. The mack daddy of em’ all.
From there … let’s bring that into the 3rd dimension. That creates the 5 PLATONIC SOLIDS and that’s where the “5” comes from w/ regards to the 12-13-5 triangle. 12 being the sun cycles and 13 being the moon cycles (moonstral cycle for the DIVINE feminine) and 5 .. the platonic solids. So, this triangle is the ONLY triangle in the world that has the area and perimeter equal to 30. Yup … and so that is the triangle that we use to … divide the circle into 12 parts of 30 degrees each. And, that’s the angle that is made when you connect the two mistakes on the Declaration of Independence.
Why the diatribe?
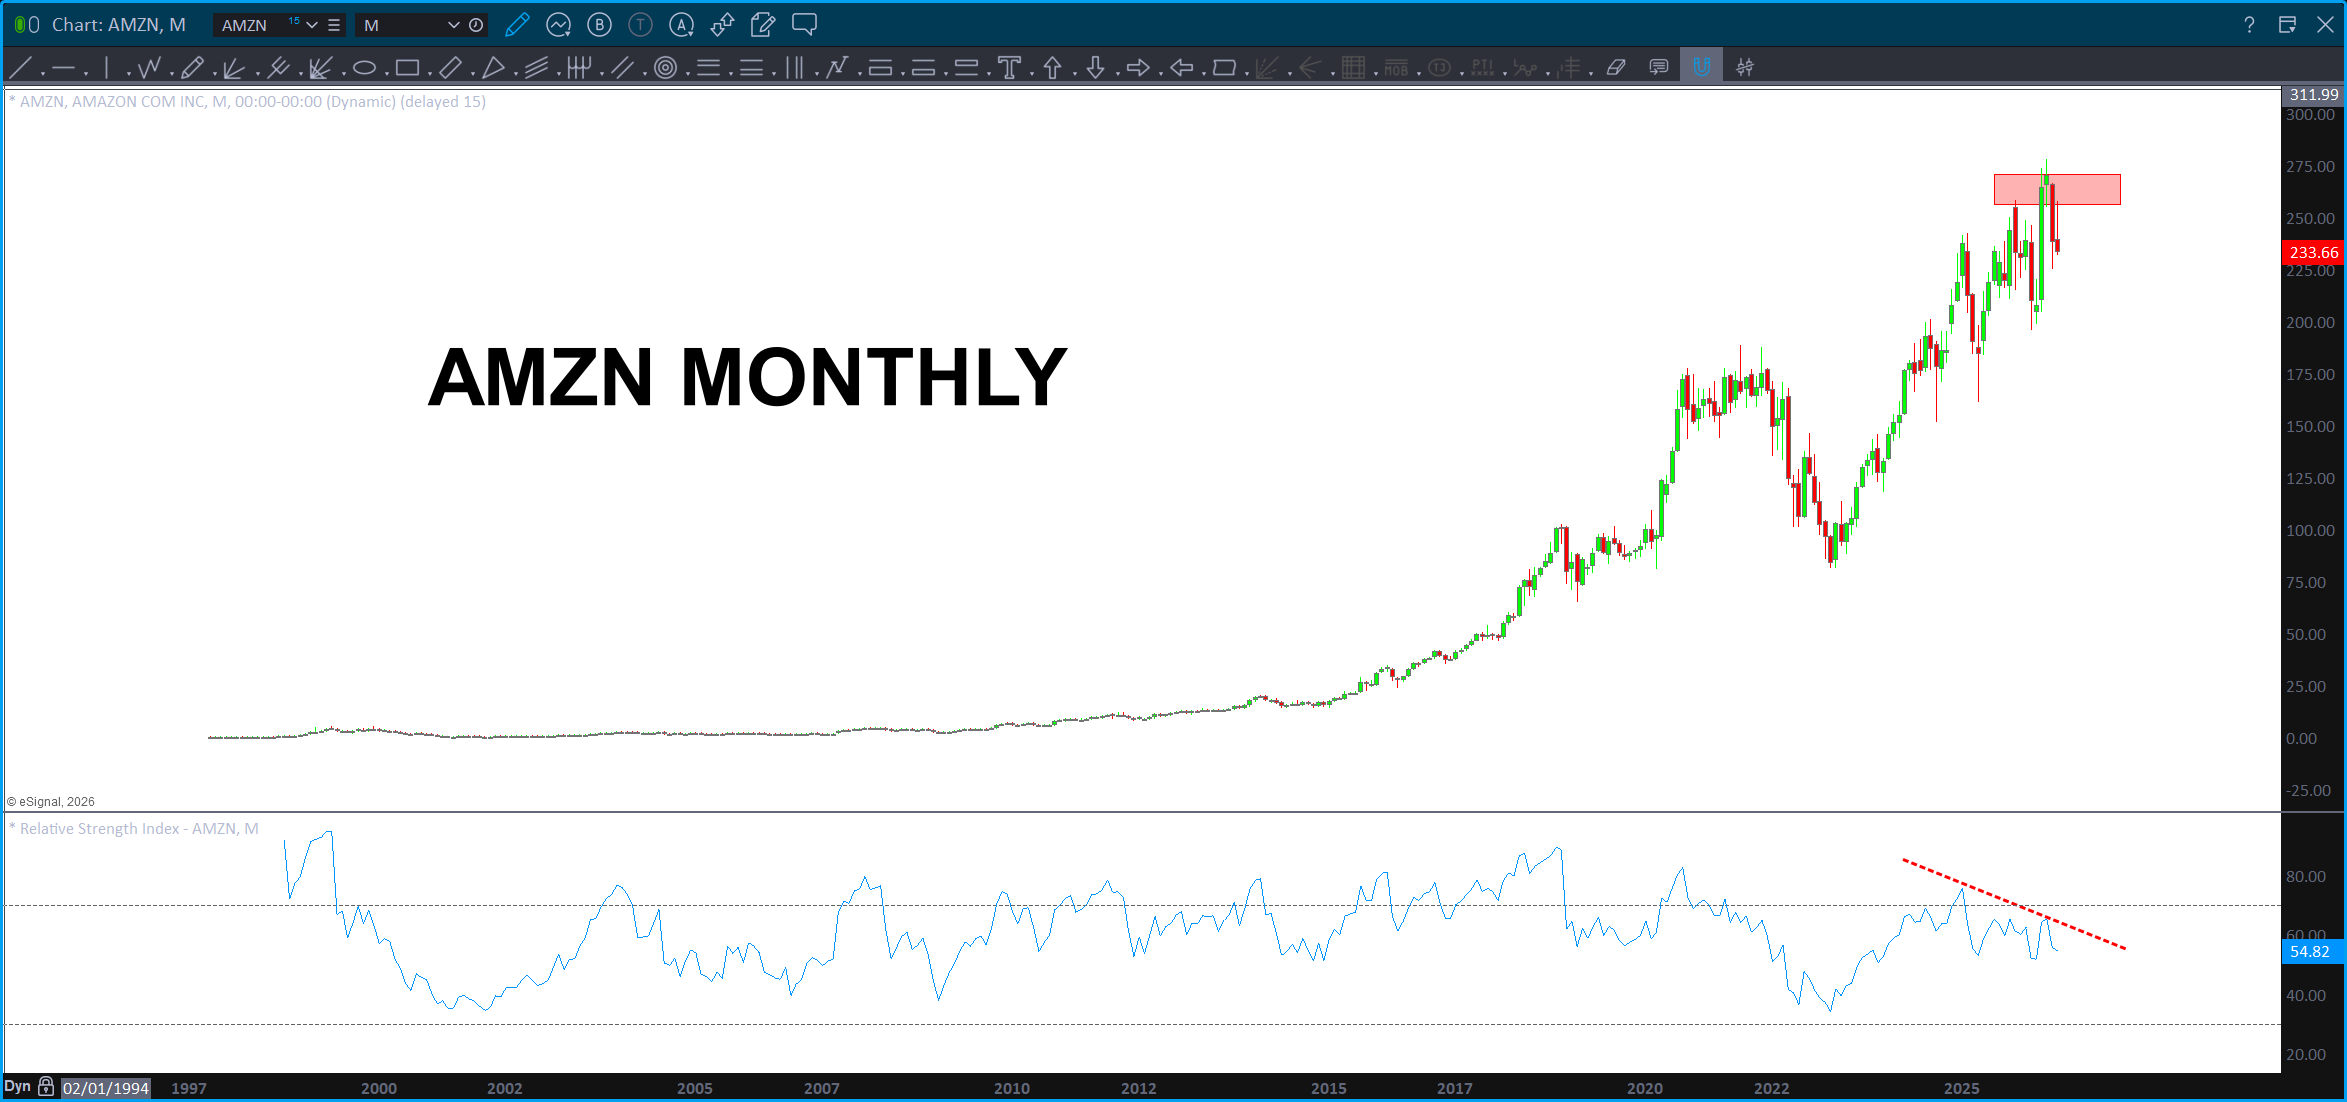
Well, I honestly forget a lot about the things I do on the charts. To be honest, it’s my relaxing time. I come and sit down and blog to just relax and chill out after dinner. Maybe pop and edible, maybe not. Always w/ very trippy music and I just go and draw stuff. Anyway, w/ today’s sell off I asked myself about AMZN. I had forgotten this video:
Don’t judge, I forget all the time.
Anyway, w/ today’s action we smacked right into the target zone and it was a three drives PATTERN to a top.
Again, work with me, what the heck is really going on? This video is back from January. I had no idea (still don’t as it could reverse tomorrow) it could or would hit the zone back in January. But, it did …
I’ve seen it too many times. There are attractor states in the market based on the platonic space. The platonic solids are specifically mentioned w/in the American Codes prominently when you take the distance of the center of the sun to the center of the earth and divide by – get this – 1776*6771- you get the angular ratio for the 3 platonic solids that govern this 3D matrix of consciousness. No kidding …
The tricky part? How long does it take – TIME – for these patterns to form. I’ve got an idea … I talked about it above. It’s that simple.
Let there be light …
Ding Ding … Ding Ding – July 22, 2026

For those that might not know, today is Mary Magdalene Day … 7/22 or 22/7 = Pi. Come on man … and, there are now, 162 (hello 161.8) days remaining in the year. Mary Magdalene … in honor of her day, may I recommend “The Magdalen Manuscript – The Alchemies of Horus and the Sex Magic of Isis.” Yeah, no kidding, if you want to understand, cough cough, some of the stuff that’s about to happen, this might help you. Just a tad …
Anyway, I spent a significant amount of time working w/ Alan and the America Codes the past couple months and I’ve had the unique opportunity to literally see the dedication and effort has POURED his life into getting THE message correct.
Guess what … Mrs or Ms (ask a Knights Templar ;)) Magdalene comes out to777 in Hebrew Gematria. And that plays a huge role in the entire information being passed down. I’ll stop …but there is so much happening right now. One of them, the below …
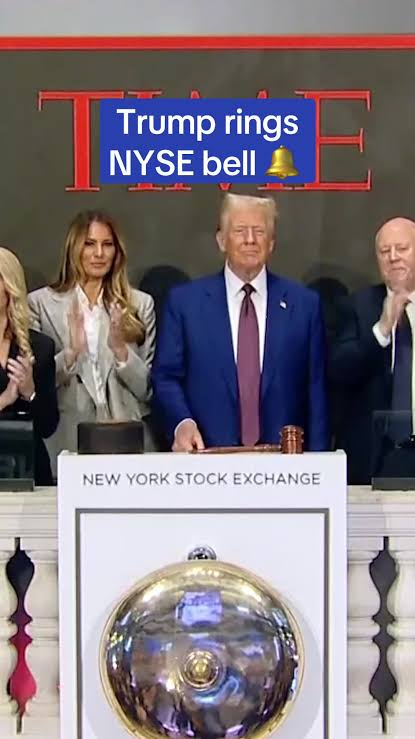
I was just thinking, “you know, wouldn’t it be funny, IF the President is literally ringing the bell at the top?” Seriously … we are at a pivotal point of “should I stay or should I go?” And, trust me, go it could … I for one want a nice correction to buy into but who knows.
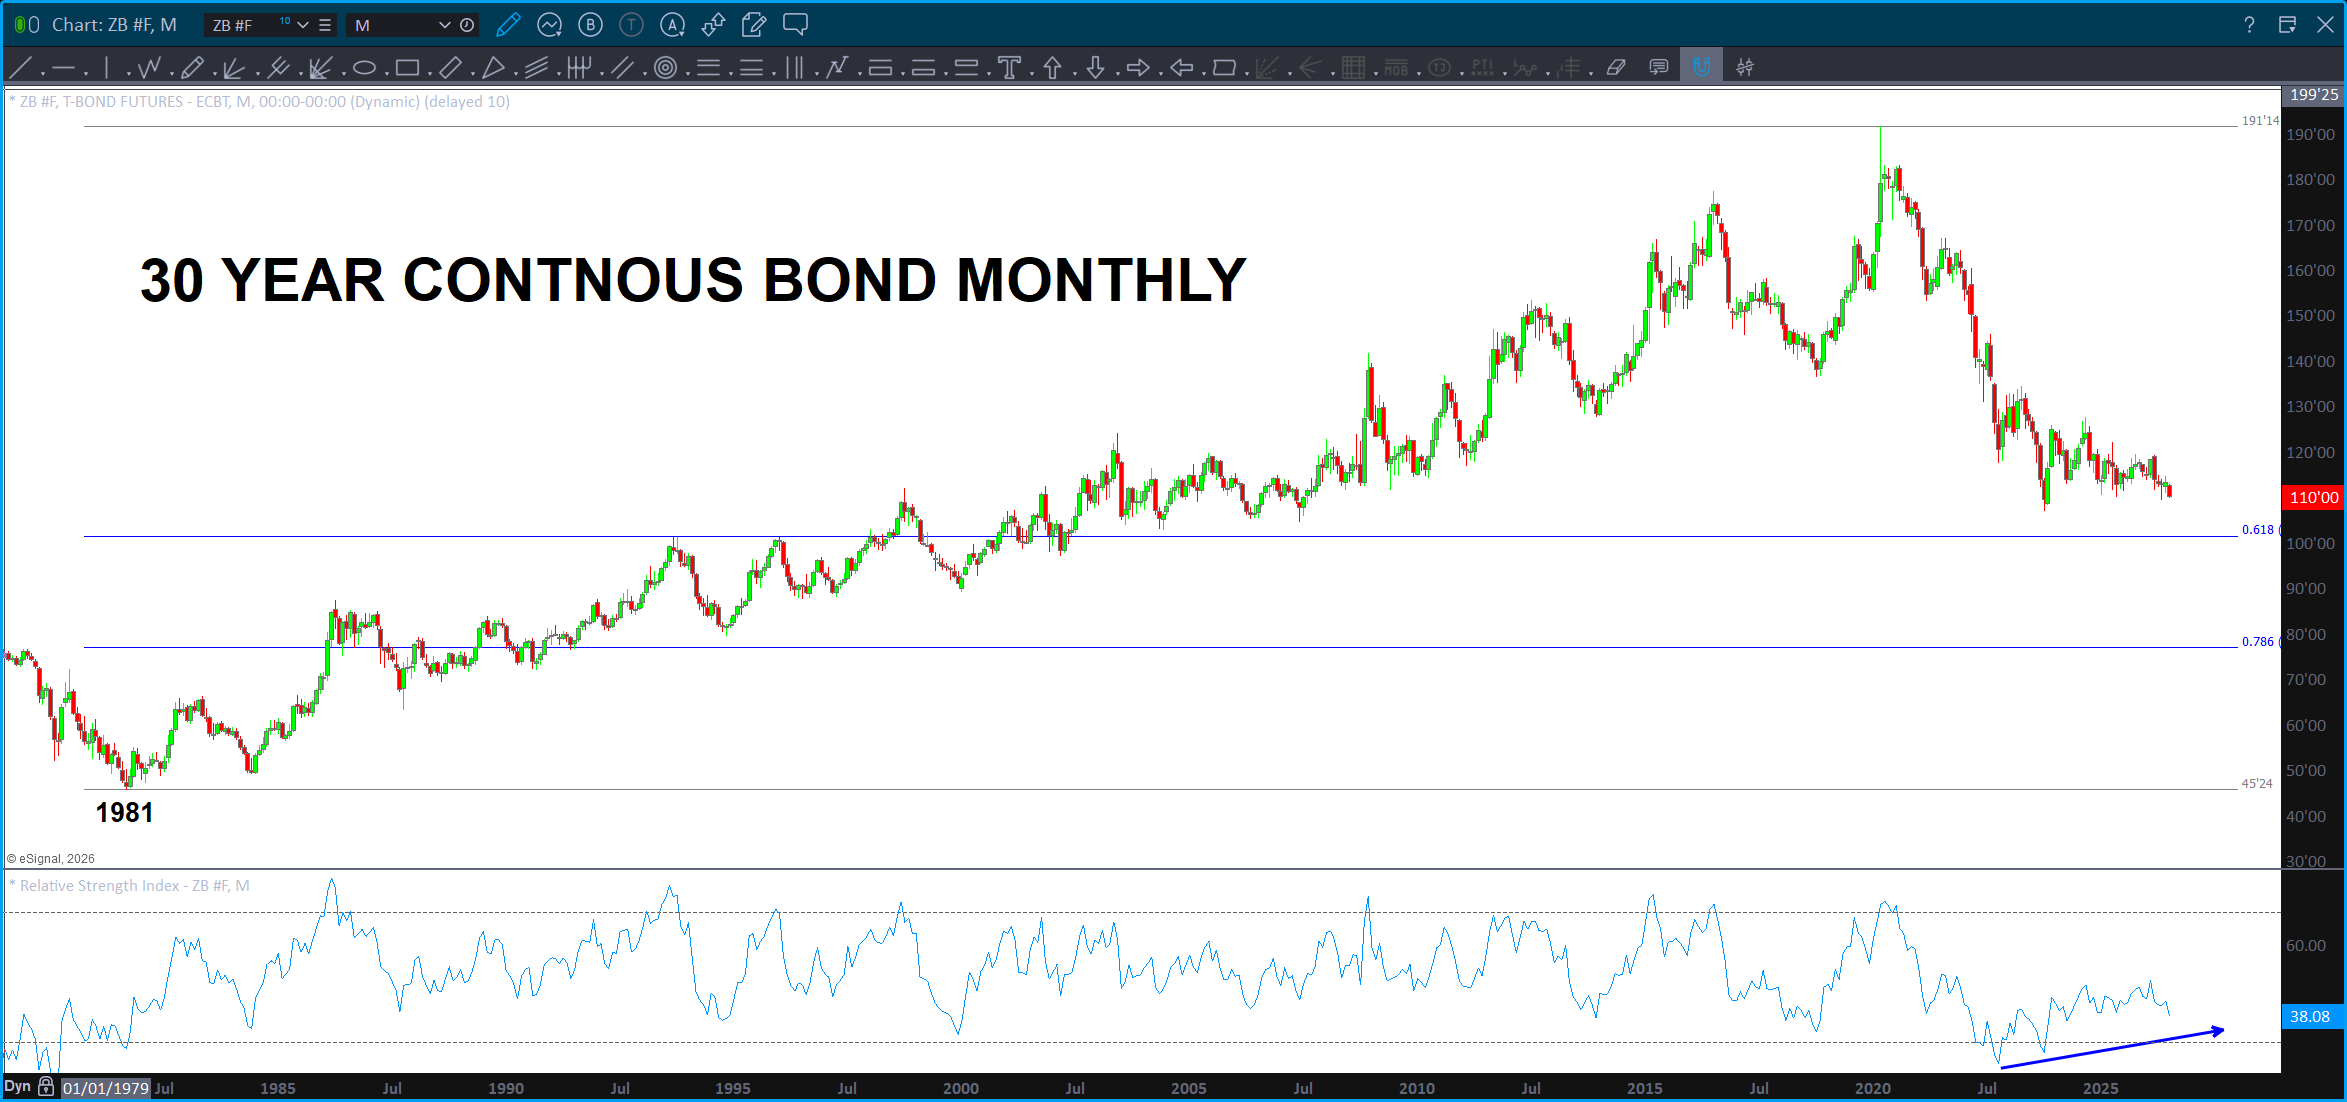
But, here come the bonds. If you go back and look at some of the work on the bonds I’ve been waiting for this to happen and here it comes. I don’t have all the other ‘math’ going into the .618 of the entire 40+ year swing is the next support target. For those who have followed me for a while, you know I’ll jump in but I’m not much for the ‘jump in front of the train’ mentality and this wave down in the bonds certainly looks like it could accelerate which, frankly, ain’t good so – for now – I’m going to give it a wait and see. I am long TBT from a while ago so I’m actually thinking more from the perspective of the US. Who is dumping our bonds?
Either way, just stand by as the media and the MSM is going to scream about rates and it’s out of control (it is – frankly) but we are getting to a point of a multi-month or multi-year BOUNCE in bonds. I’m feeling pretty good that we just finished the multi year 4th wave triangle that I’ve been watching and price is doing what it’s supposed to – sprint out of the triangle like a snake as it’s been coiling the energy of the continuation pattern for a couple years …
I’m fairly certain that this triangle occurred as a 4th wave correction which gives credence that we are in a 5th wave down and I believe we have stared the 3rd of the 5 waves that make up the last wave.
Then … we BUY BONDS!
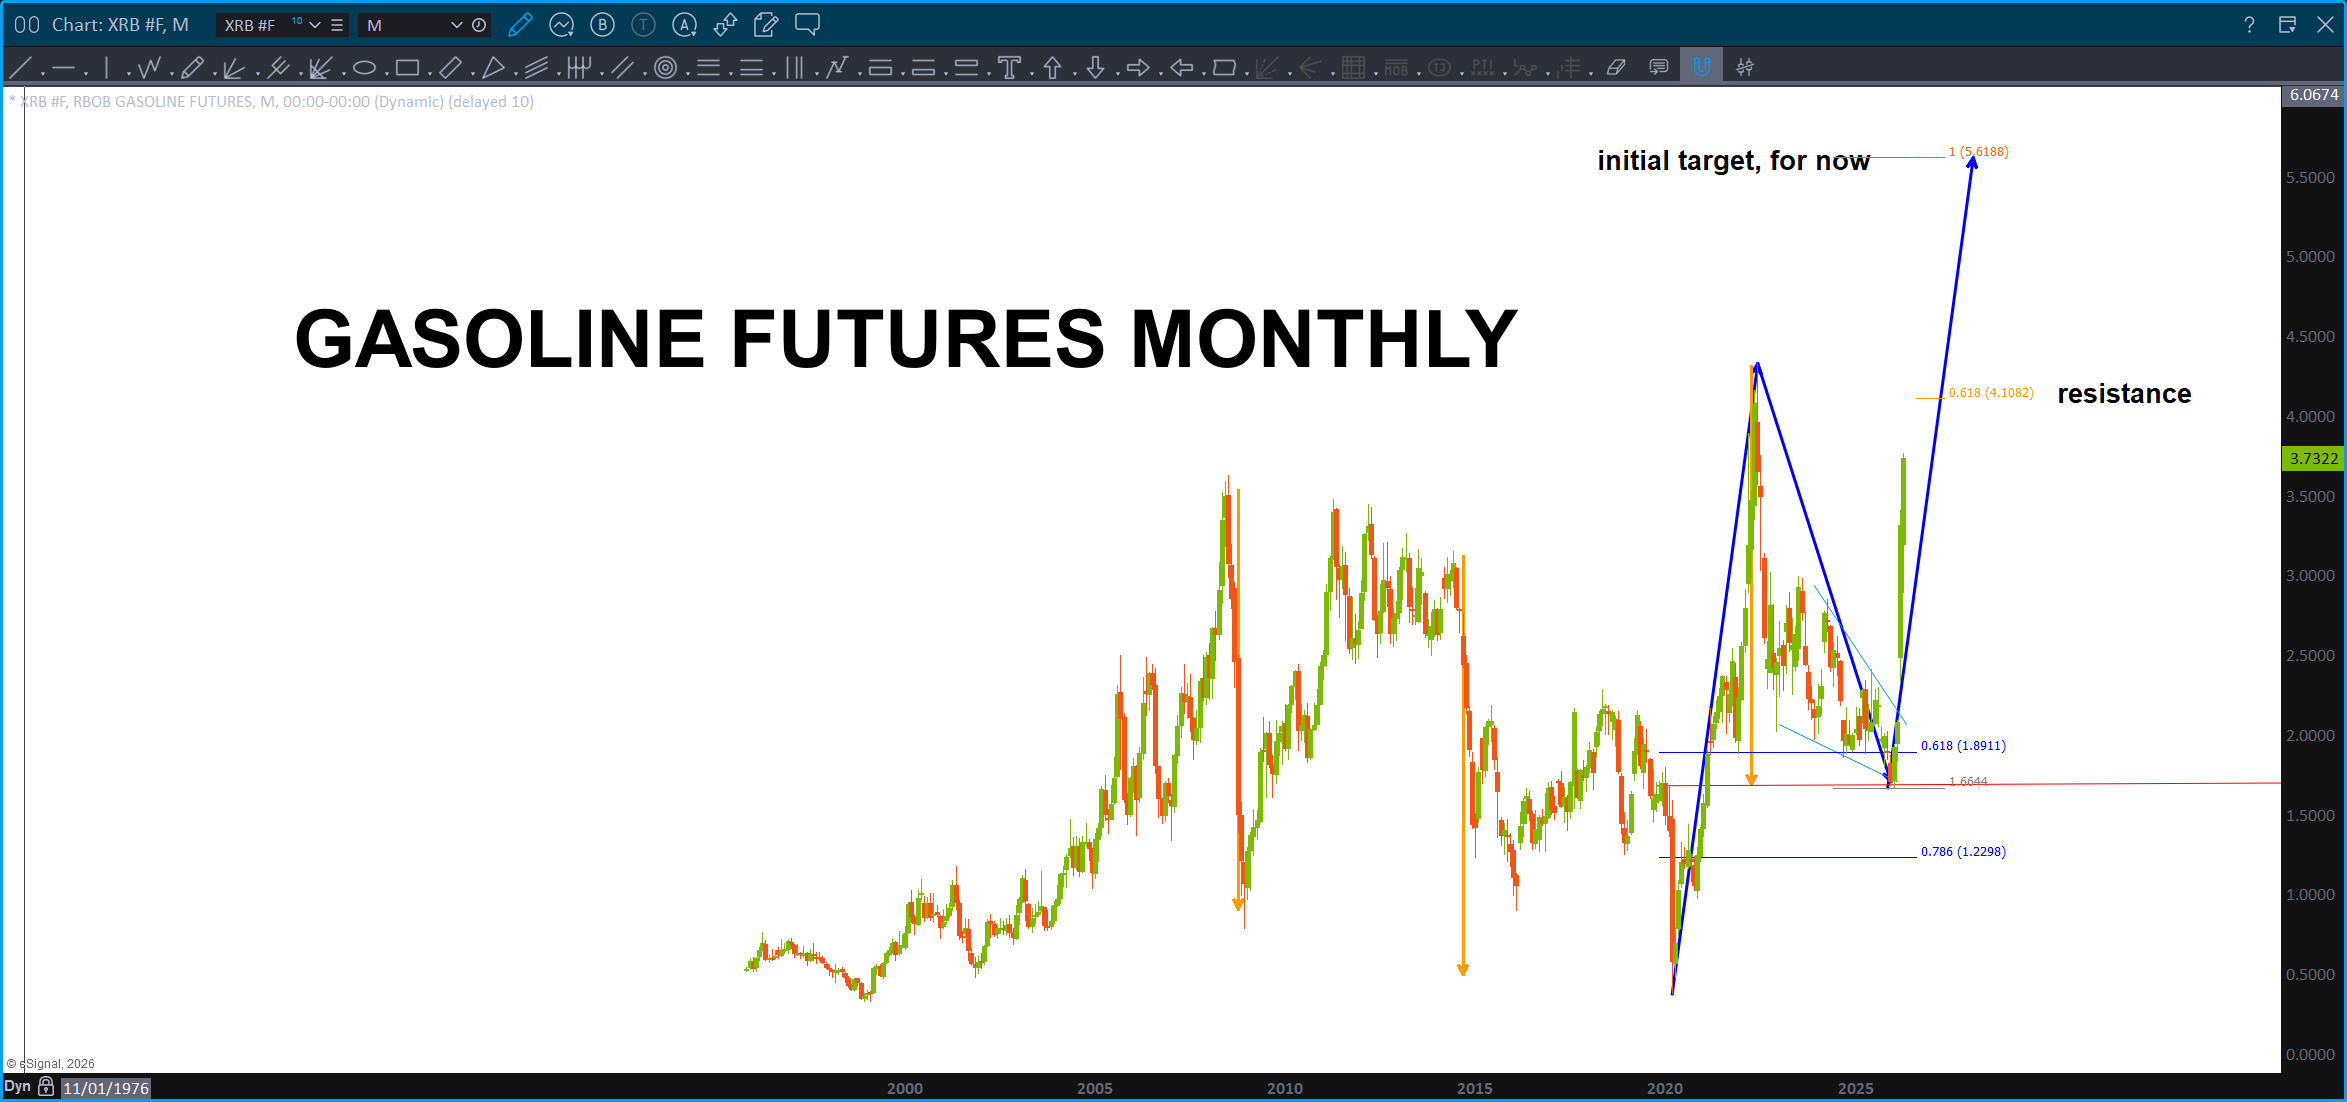
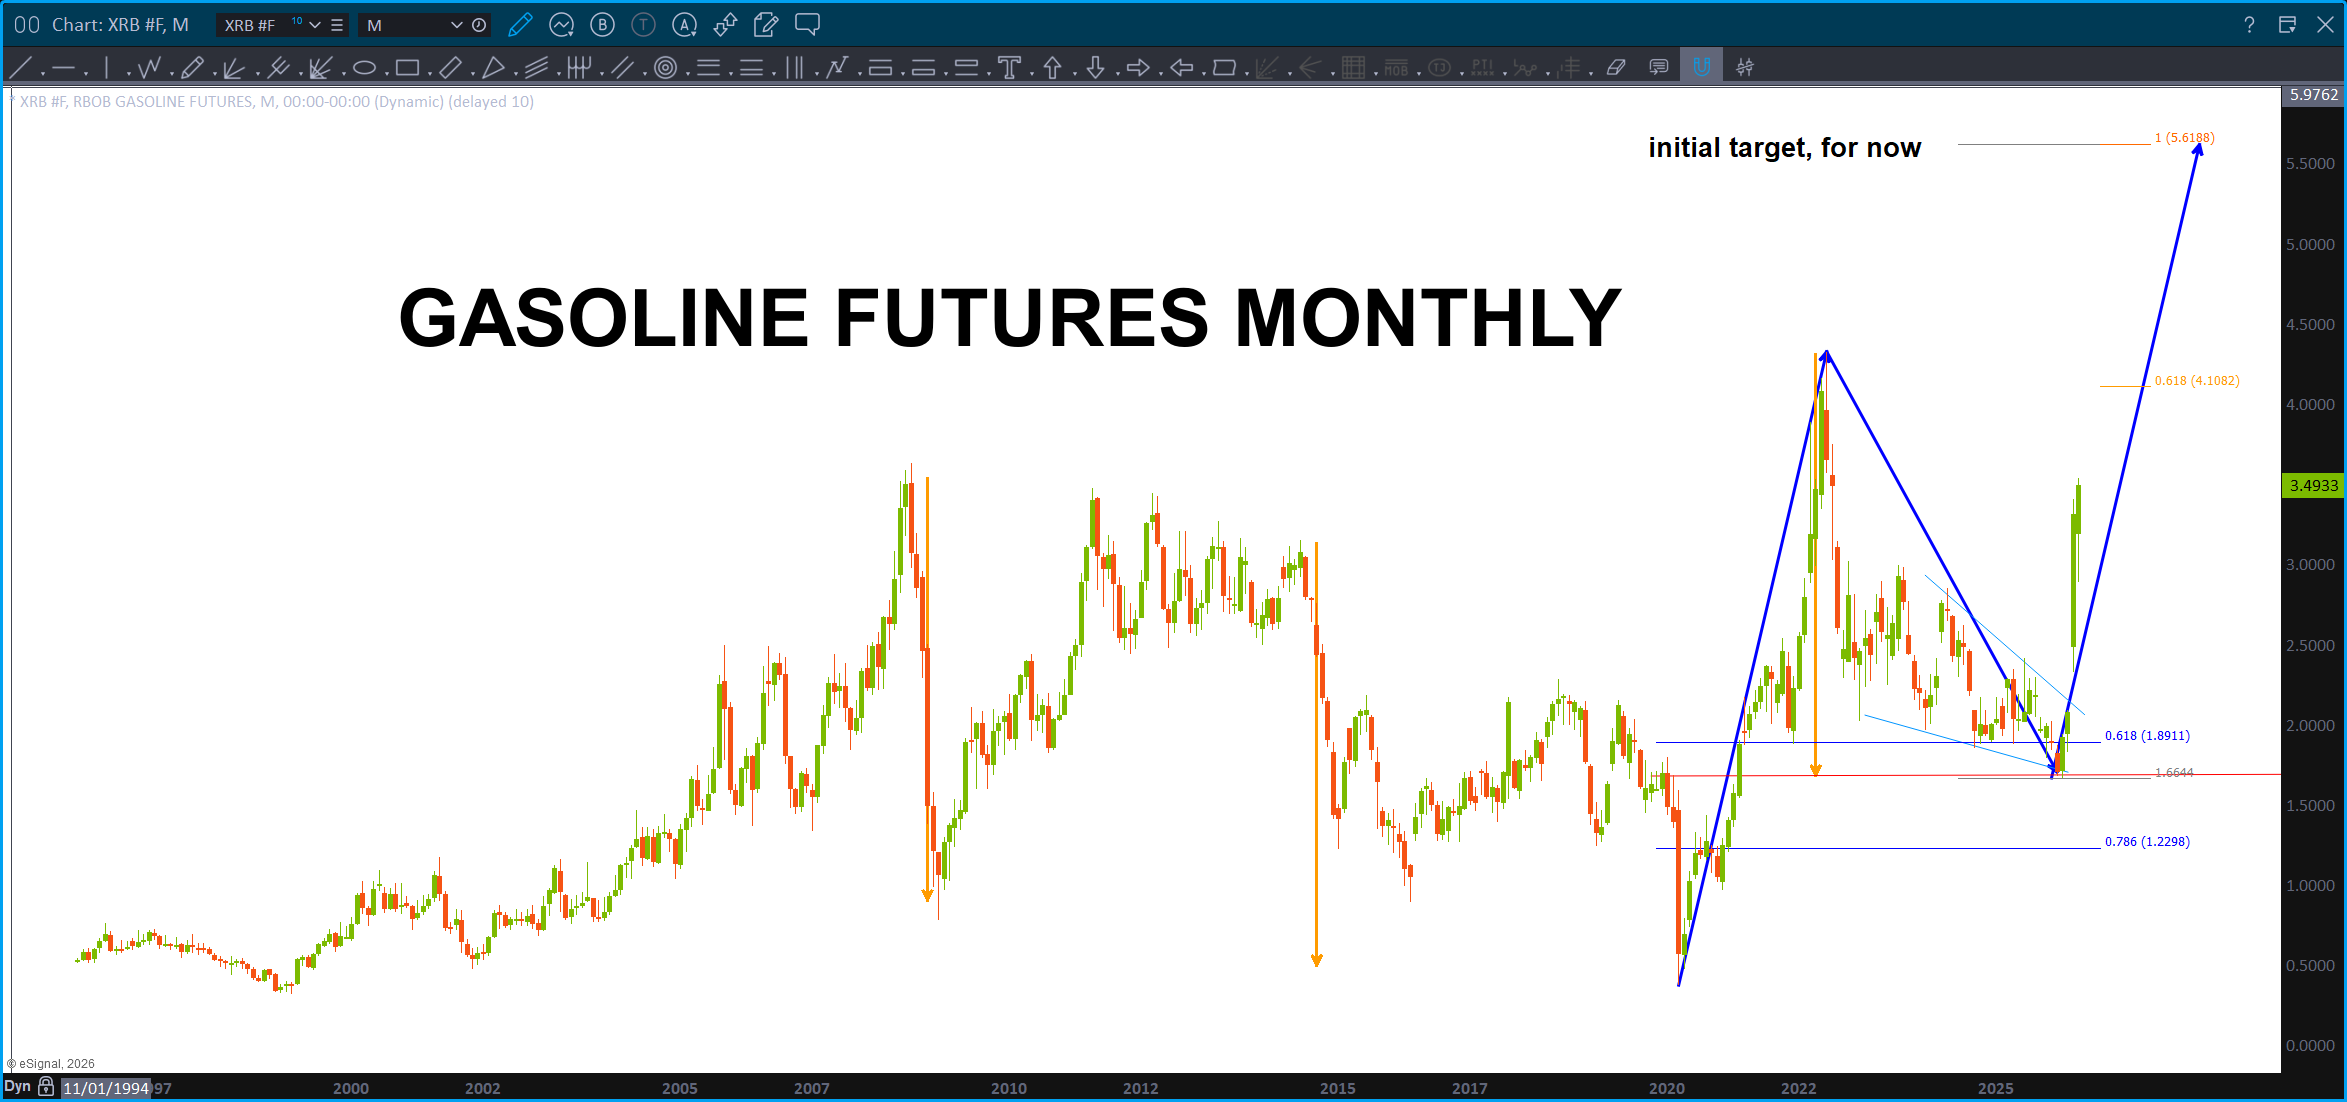
Gasoline – July 21, 2026

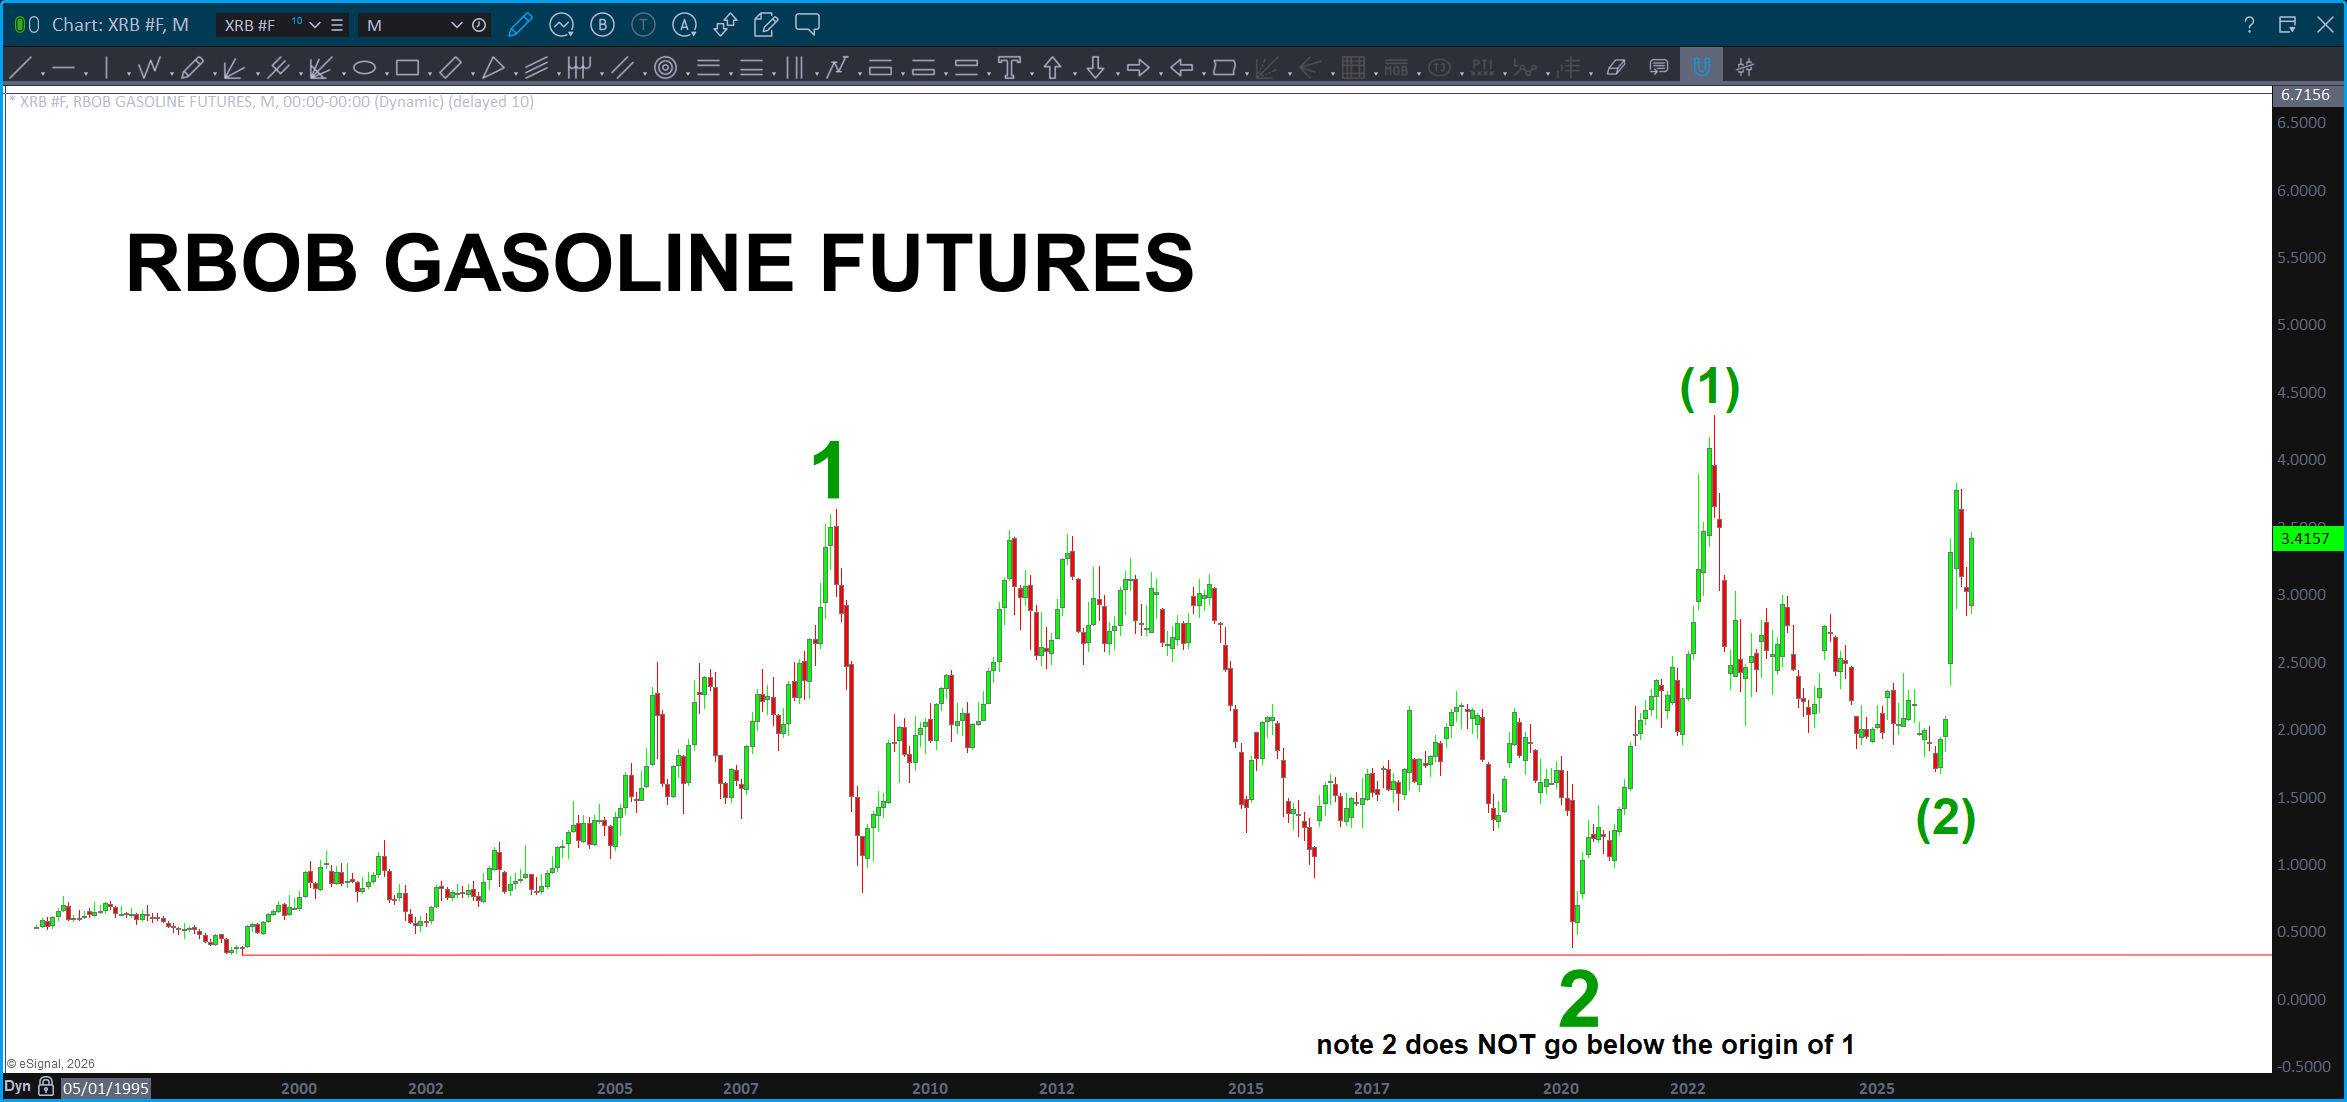
Look, I always say my counting is like my golf game … if you ask me what I got on a hole and you see me pointing at the hole and pretending to count, I’m probably confused. 🙂 “Give me a 6 on that Par 5” (yeah right) Anyhoo, that’s why I subscribe to counting (or attempting to) on longer term charts as it’s ‘easier’ to not get lost in all the subwave machinations. All this to say, I see nothing wrong w/ the count below.
That almost seems Mad Max like but the first rule we are looking for is – wave 2 cannot go below the beginning of wave 1. It doesn’t .. Valid.
Now, I look at the waves of what I am labeling the 2 wave and you can easily see a three wave CORRECTION. I don’t have a problem labeling that sequence of PATTERNS wave 2.
So, now … dare I say off we go in the 3rd of a 3rd wave that is the most powerful in the wave structure. A wonder to behold is how it’s described in the EWT Theory Books …all that saying, prices could sky rocket higher and go to levels not many of us have ever seen.
Go look at some other ‘auto-elliott’ software program or service and see what they think if you want. Please let me know because I seriously went “OK Bart, double check what your looking at dude …” I did.
My bet – gas is on the verge of going higher in the 3rd of a 3rd wave to take gasoline futures to new highs and, potentially, crippling prices in regards to the economic impact.
Just calling it like I see it … I’d say the same thing if it was the stock of a tech company or whatever. It’s “just a pattern” to me …
Do really hope I’m wrong …
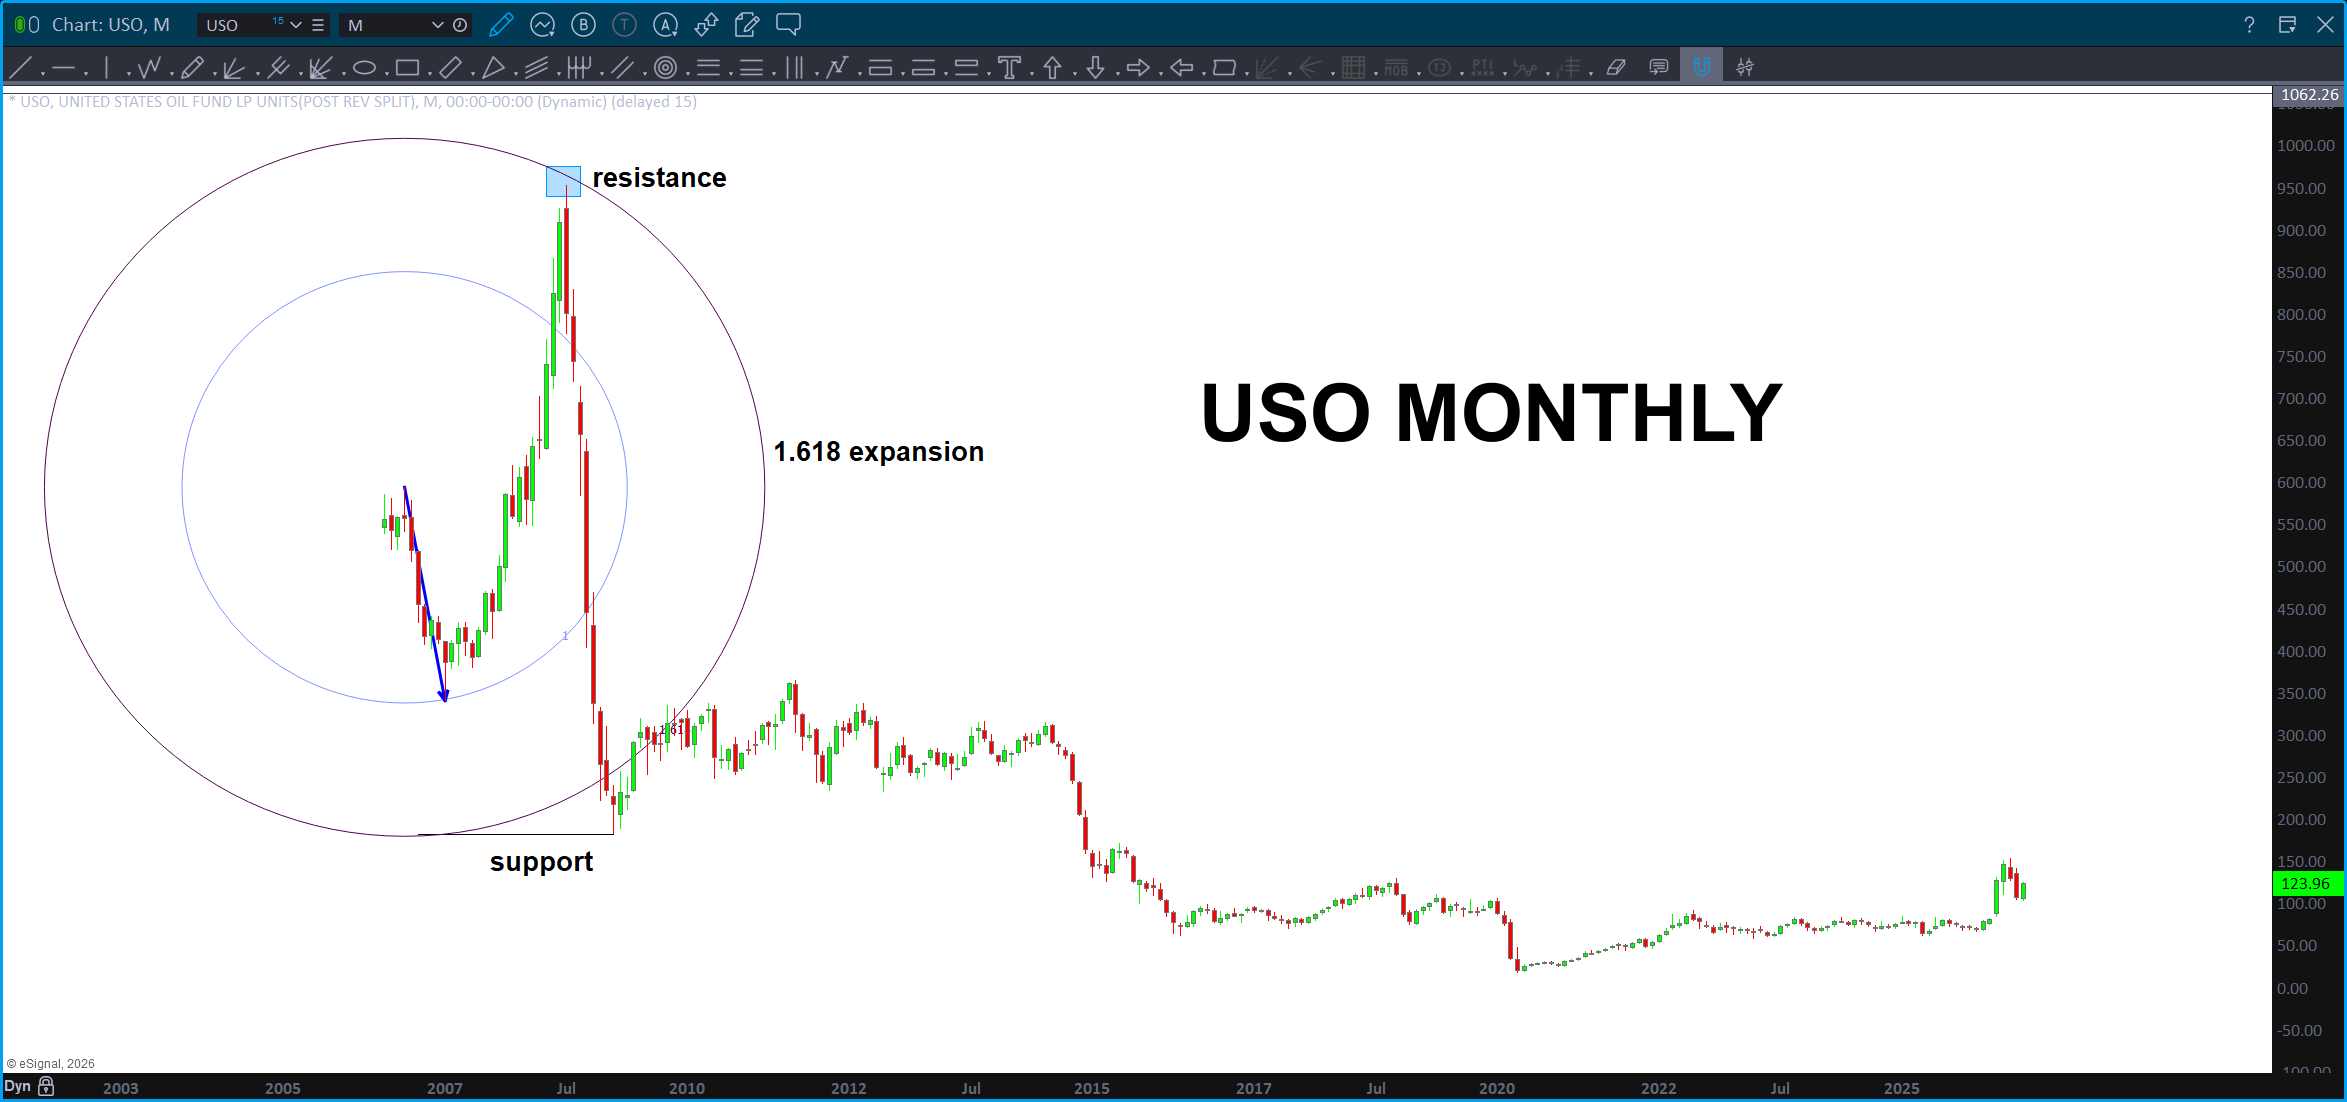
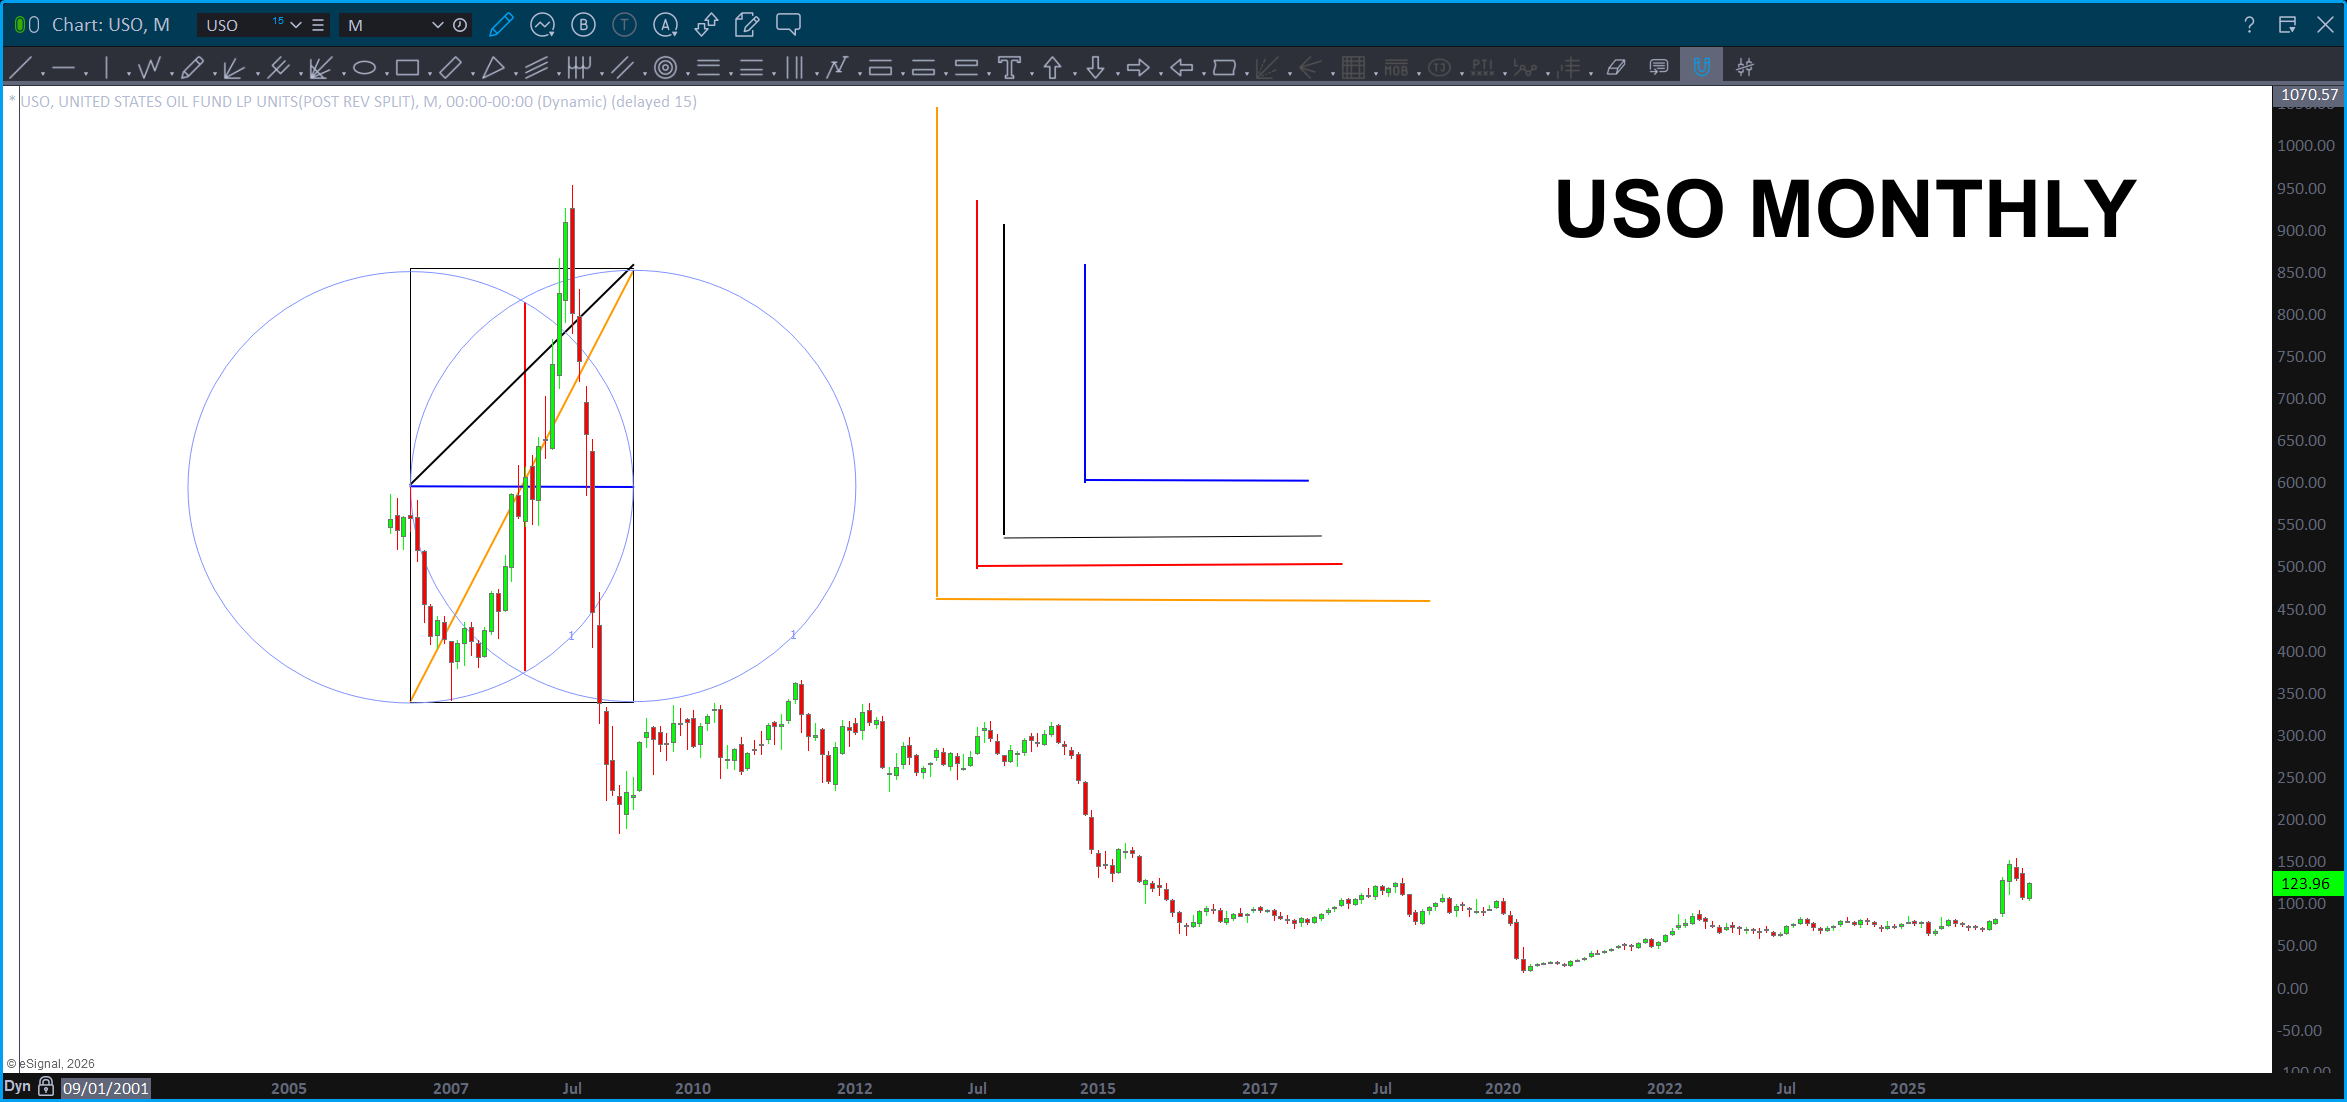
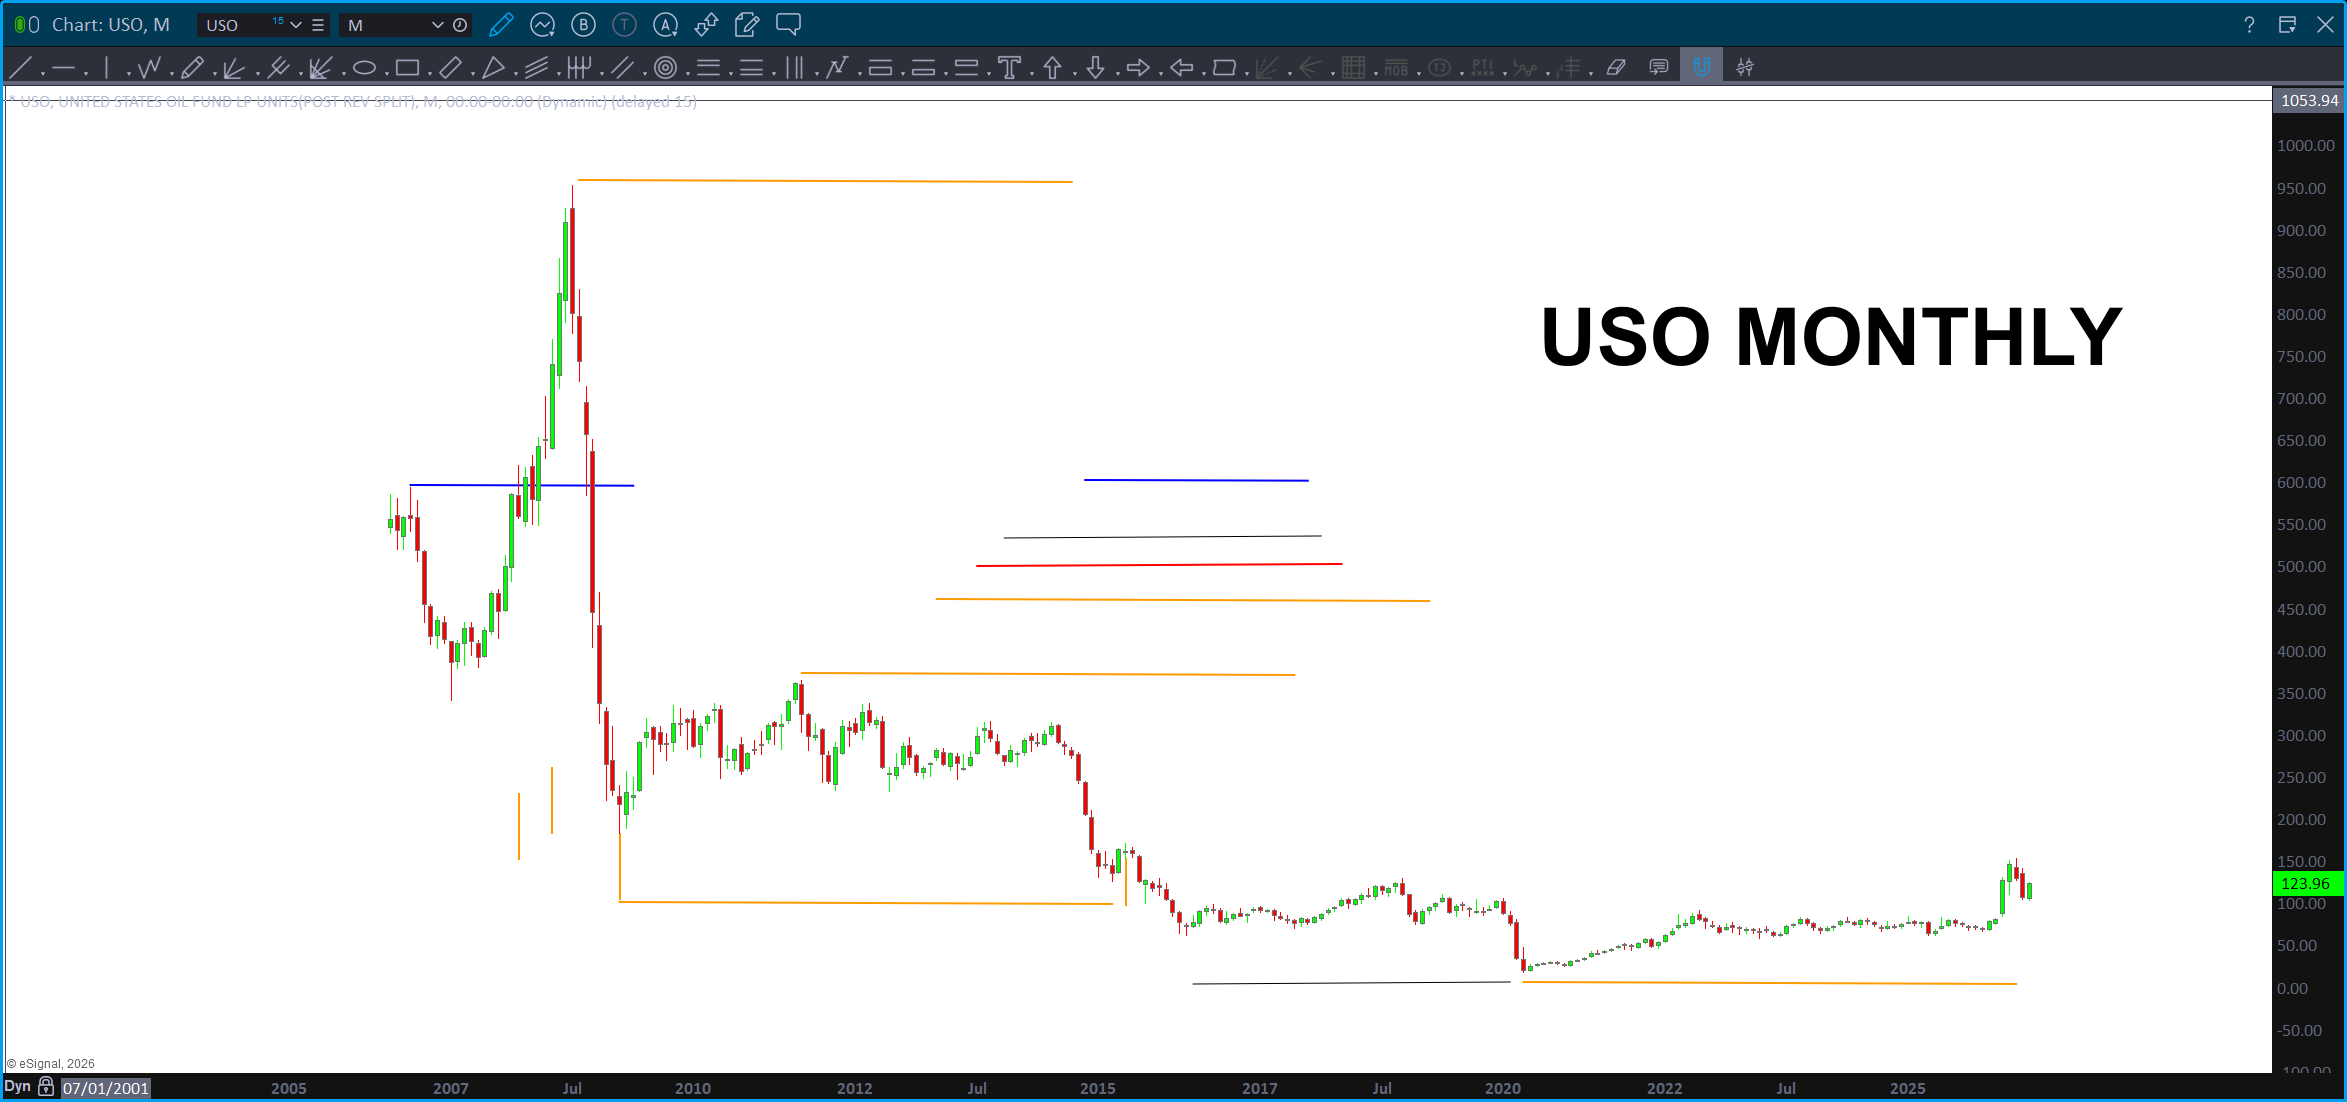
USO Vesica Piscis – July 19, 2026

Last night I got into the zone and just started typing … dove into the D’ver, Solomons Temple, the Gospel of Thomas, musical theory … I saved it as a draft.
My last post was the D’ver …
Here’s the USO and the Vesica Piscis. Folks, trust me, just go get http://www.theamericancodes.com and/or check out Truth Social in a few days. 🙂
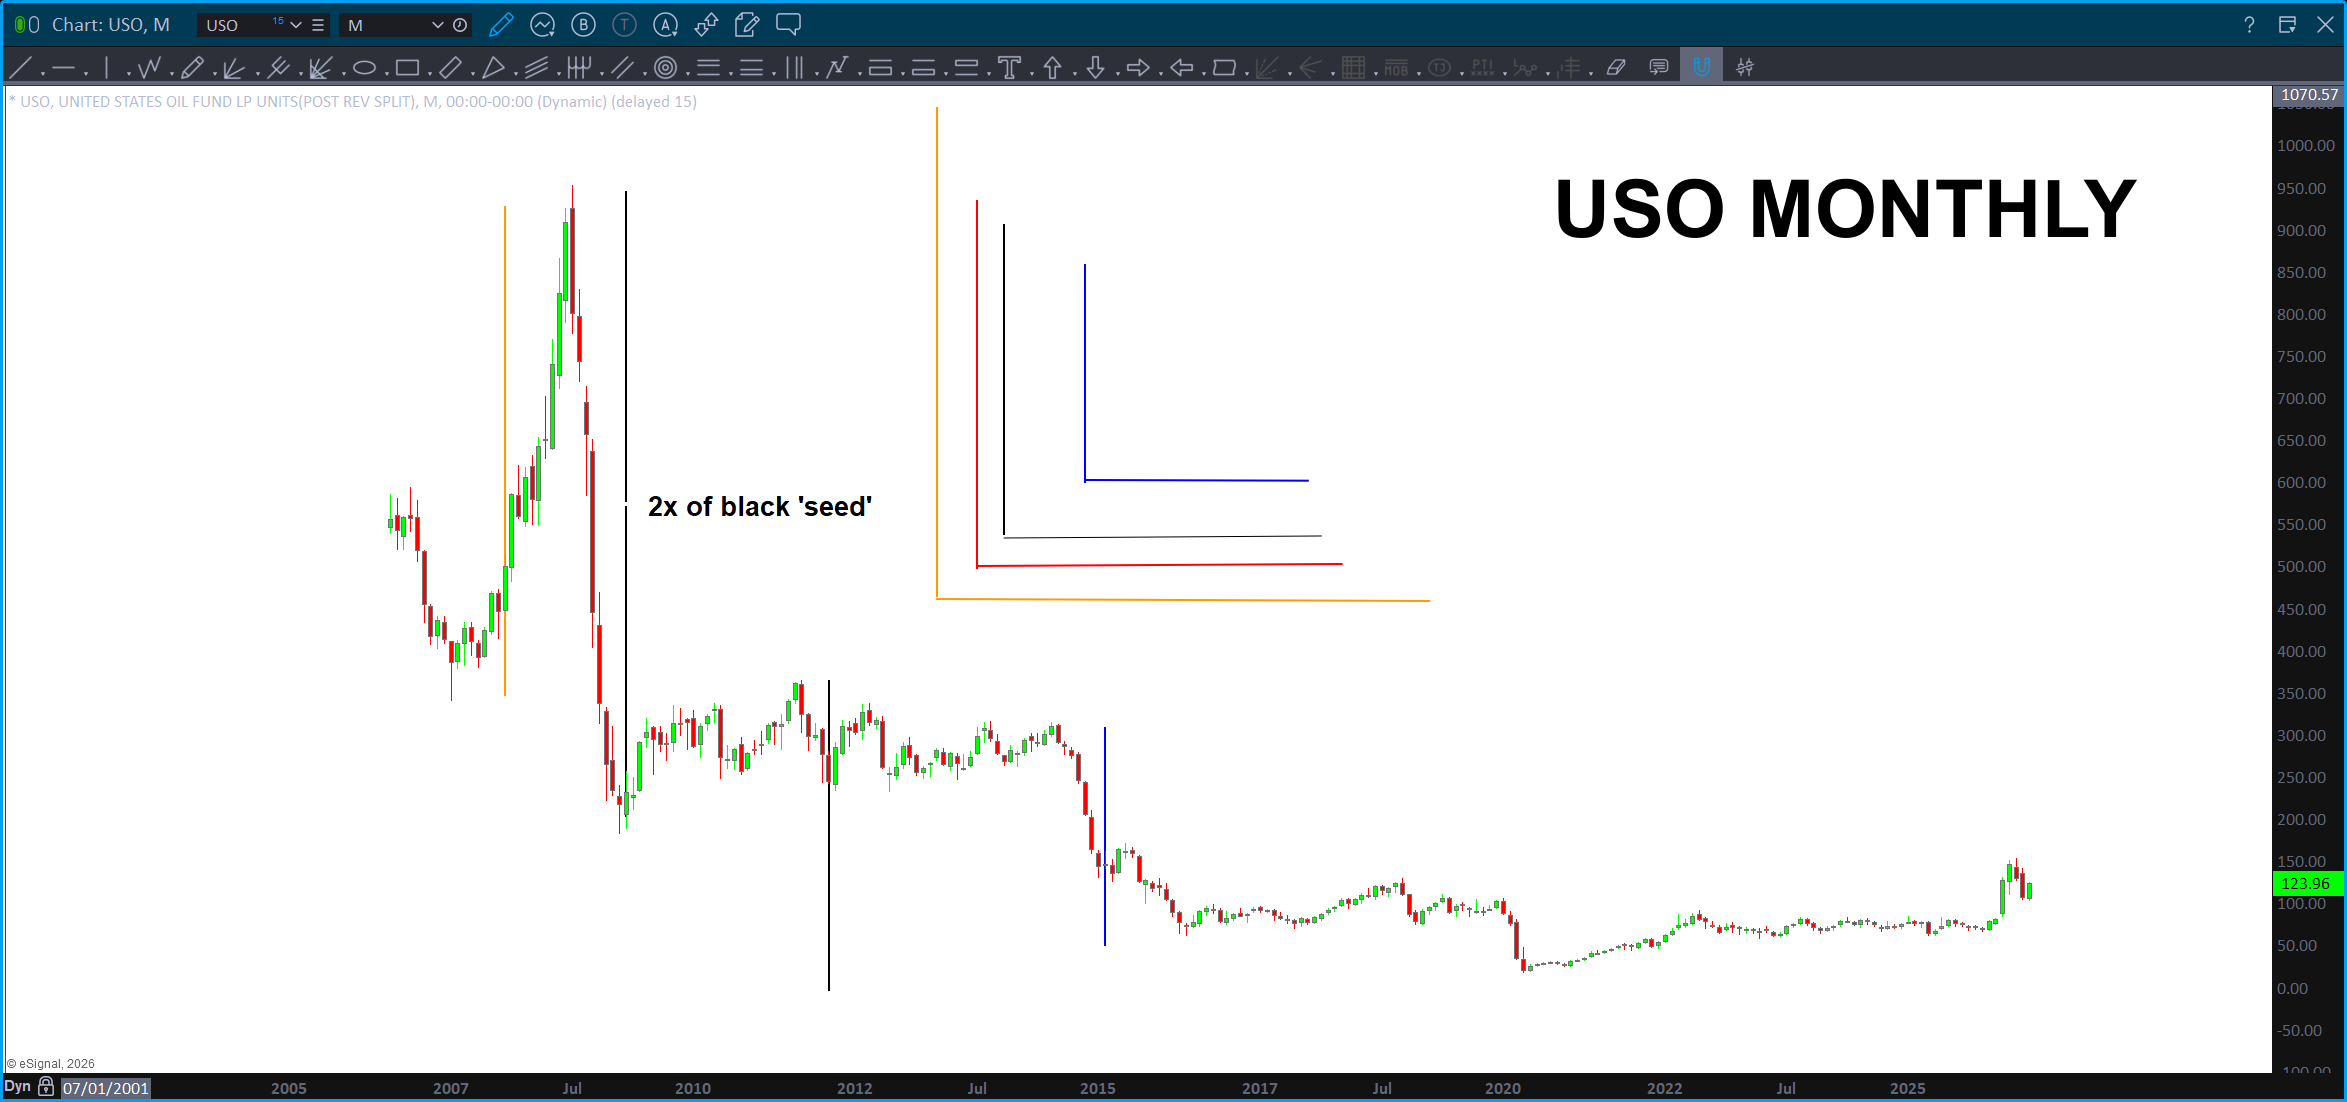
Oh, two crop circles, right next to each other …the first one being on my birthday 7-11. Come on man … 😉

Hmmmmmm … even the very hairs on your head are numbered. 😉
buckle up butter cups …
11, 888 figure it out yet … the ONLY number that Trumped mentioned in his speech on Thursday. Also, right at 33 seconds … 😉
Wakey Wakey Eggs and Bakey
Lithium Update – July 16, 2026

Here are the charts from LIT back two years ago ….

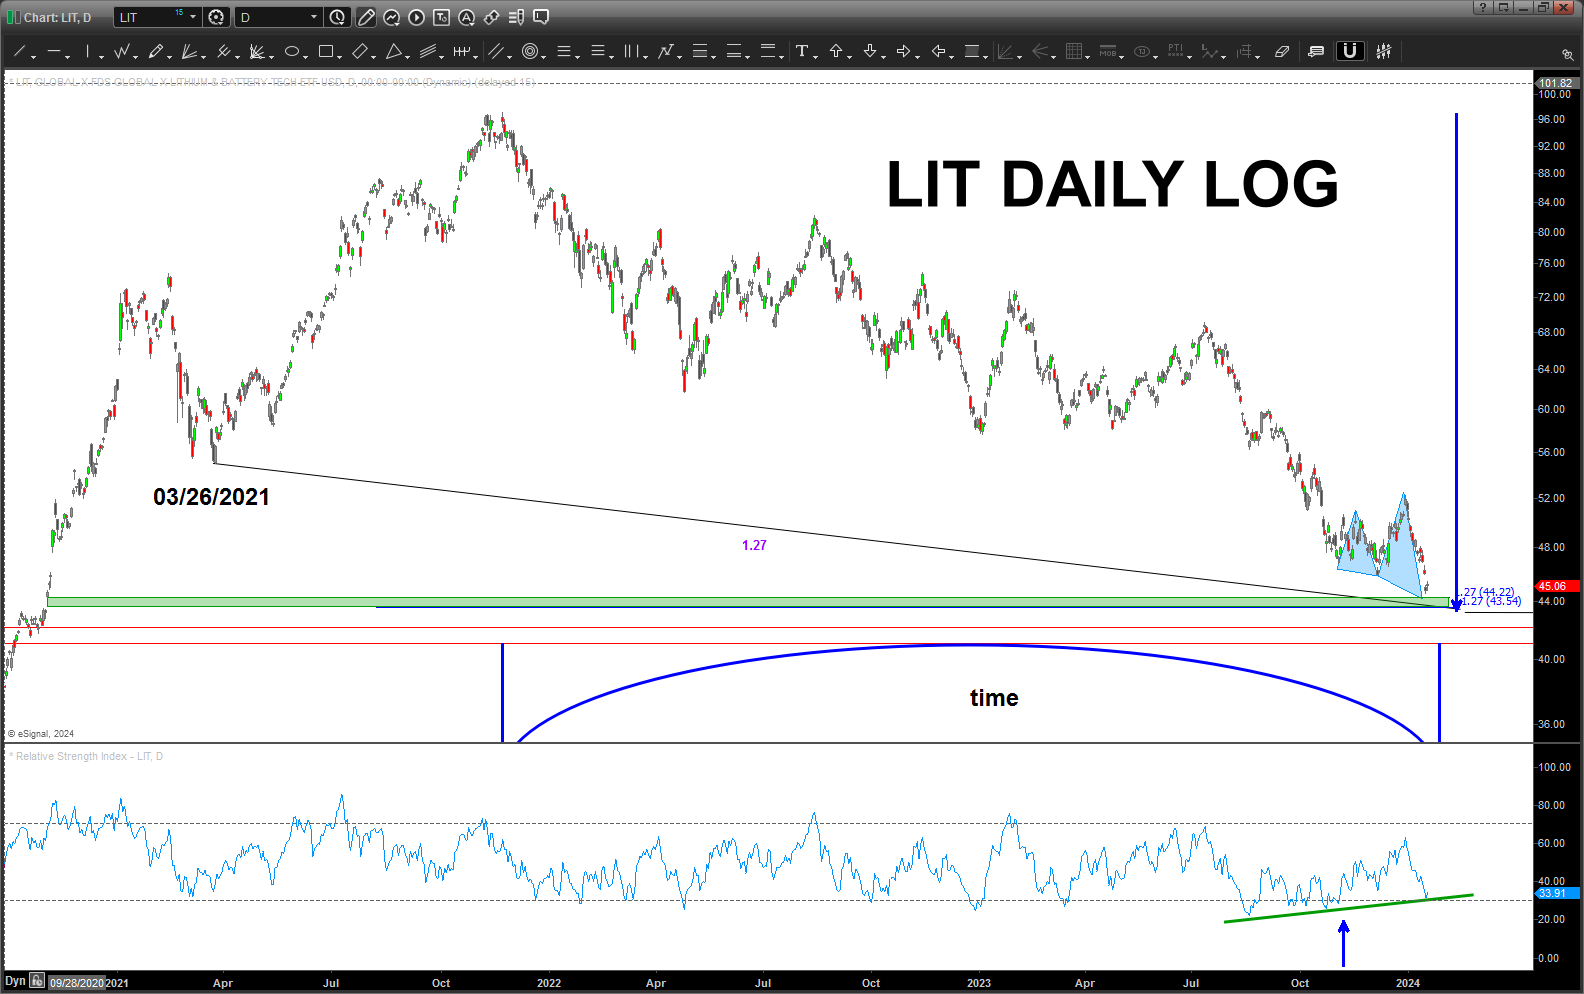
Again, must have been in a rush or just missed it but only used one area for the measured move … it got us in the zone but the exact measured move? Nailed the low …

It went a little below the suggested buy level and was, ultimately the ‘other’ measured move at 67% – exactly. Again, I must have just missed it but there it is. Pretty wild how that works, hugh?
Anyhoo, what you can see above is we have been going down pretty big for the past 3 months. We have a nice pattern of support at the .382 but that big monthly candles begs of caution. So, per below, let it prove to to us. Ultimately, on a monthly, if this is support, it will more than likely be a bounce followed by another wave down. That’s what we want …
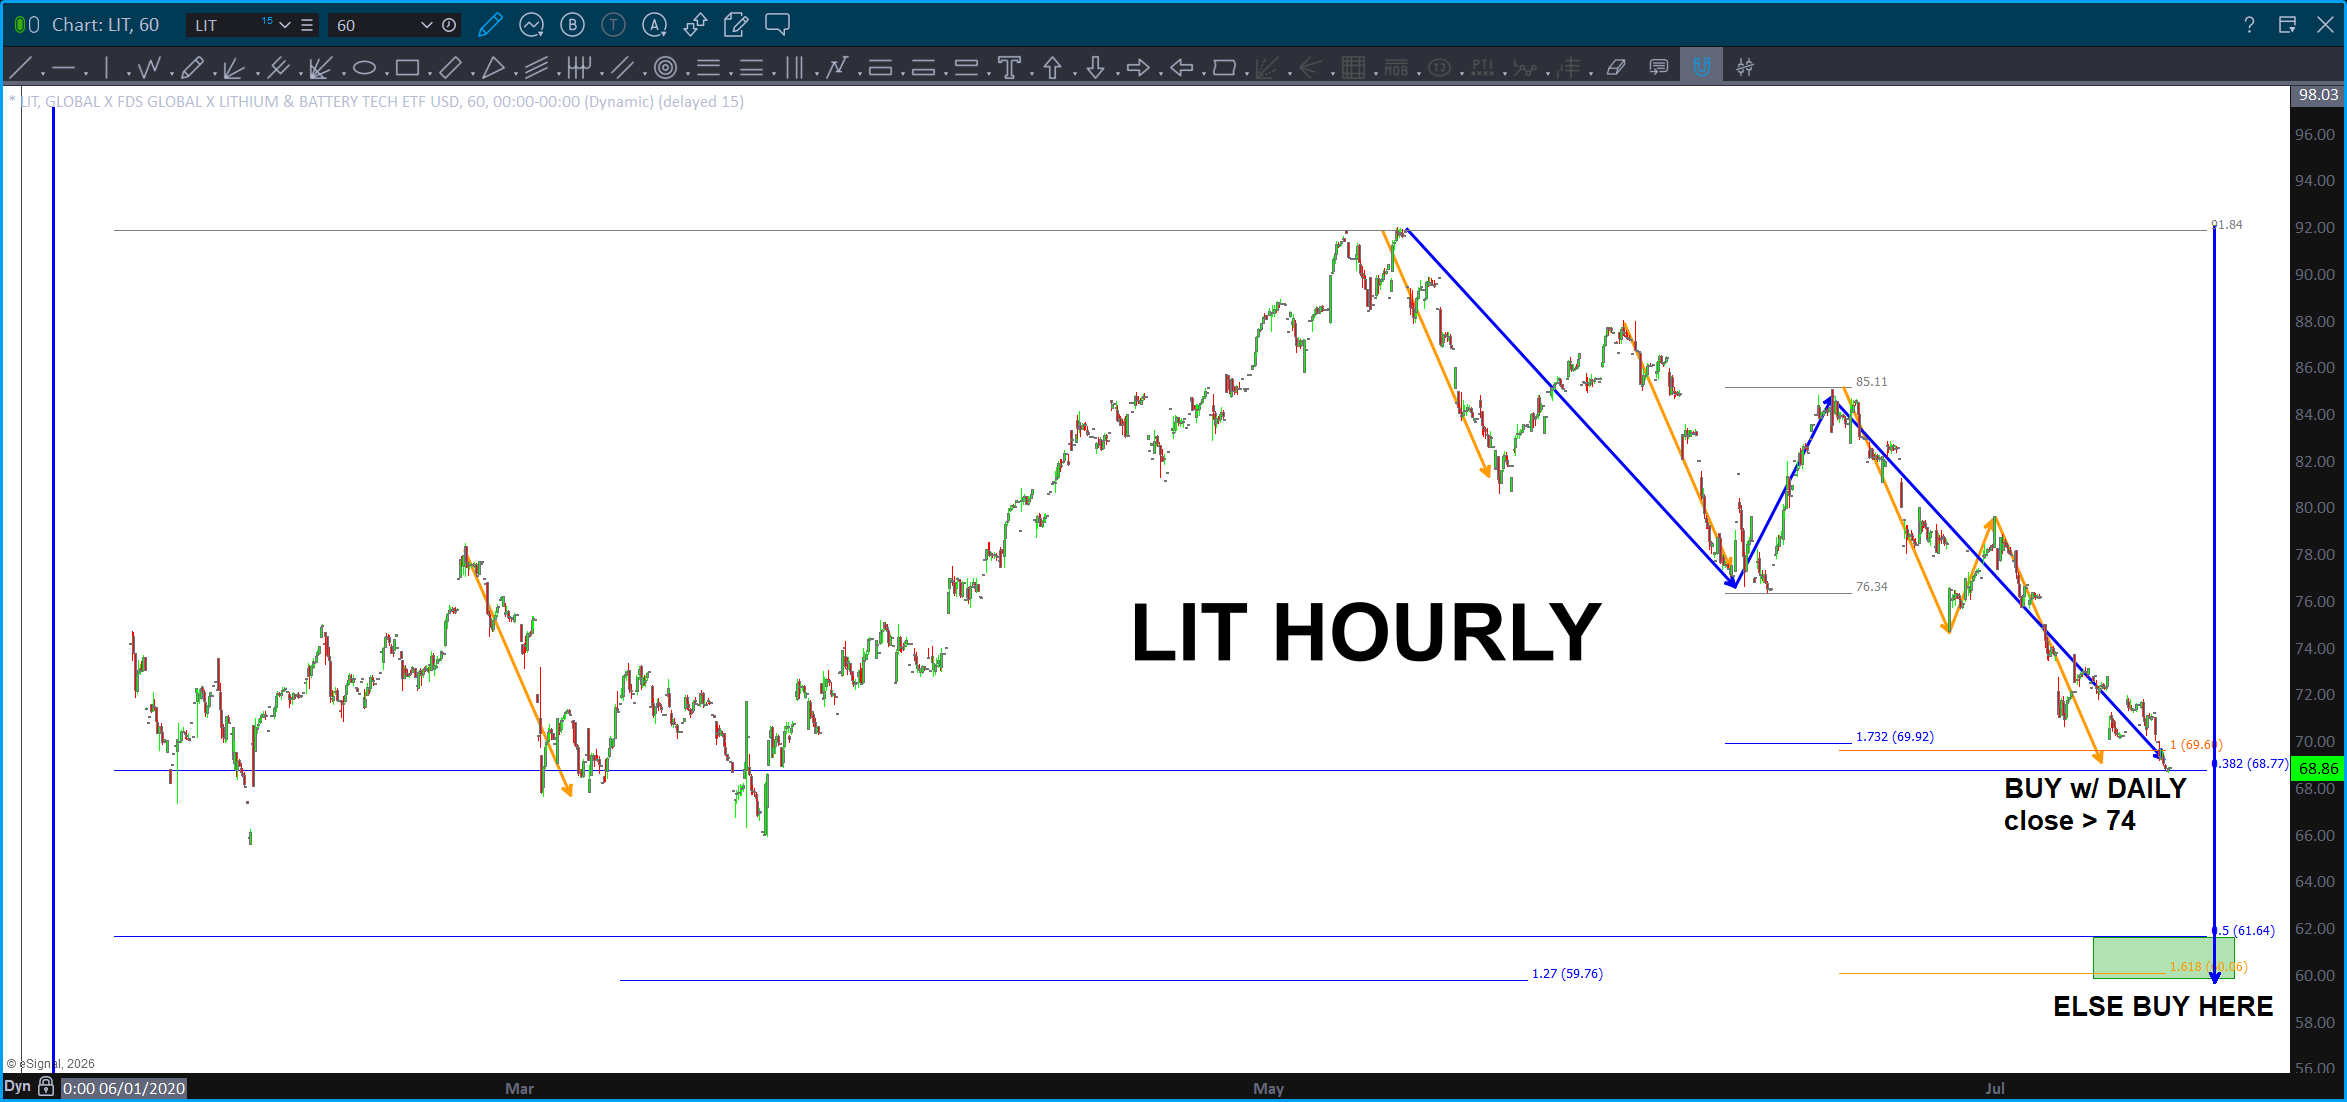

So, on the hourly, it looks like support at the .382 but let’s let it prove it to us …
On the daily you can see a 1.618 price projection that lands right at THE measured move correction w/ the 1.27 extension from the last move right at the 50 percent retracement. We like that so, I’m going to step aside and wait a couple more weeks or months for this correction to fully develop. Which means – I really am not sure what level to buy but I like the lower one because I’m conservative. Ha!
Bart
Global Dow and the Prevost Constant – July 10, 2026


I’m doing some prep work for my talk I do once a month over @stockmarkettv … I’ve been doing the Prolon 5 day fast w/ my ex-girlfriend, Kathy (my amazing wife) and we are biding time to go see Toy Story 5. To pass time and keep my brain from atrophying decided to take a peak at the Global Dow. I get a big protein shake in the morning and meet my son for a surf tomorrow. Swell looks decent so maybe we will catch some waves …
Next year, turn 60 and my goal is to be lying in the Sarcophagus of the Great Pyramid at the EXACT time that I took my first primordial breath. Why?
My birthday is 7-11. This is the relationship of the height/base of the Great Pyramid and the mirror image of 117. 117 being, of course, the resonance frequency of the Sarcophagus.
Also, take note of how close the top is to 7000. It’s basically 99.64% there … 7 being the magical number w/in the Bible, the Master John Dee’s favorite number who, as a matter of fact called himself “Double OO7.” Yeah, no shit … look it up. His partner in crime was Edward Devere the 17th Earl of Oxford. 17th letter of the alphabet being … Q. Who made all the spooky stuff on the Bond movies? Q. OBTW … Princess Dianna was a descendant of Mr. Devere. Also, the “Q-anon” movement, whatever the heck that is. 😉
Ever heard of the D’ver?
The ‘first’ mention that we might understand goes all the way to Solomon’s Temple. Yeah … the D’ver was the word used to describe the primordial vibration that exploded upon us w/ LET THERE BE LIGHT. King Solomon, of the famous Solomon’s Temple on the temple mount built an amazing structure to hold the Arc of the Covenant. The “holy of holies” was entered once/year on Yon Kippur. Interestingly enough … the colors of the cloth that the high priest walked thru to get to the holiest place on earth … red, white and blue. Also, throw a little purple in there … (think Count St. Germane and the purple flame). Go check out Hebrews 9:1-7 (9 number of completion and there’s 17 again. Coincidence, coincidence. ;0)

Actually, the D’ver predates Solomons Temple … really?
is inscribed to the entrance of the Great Pyramid.

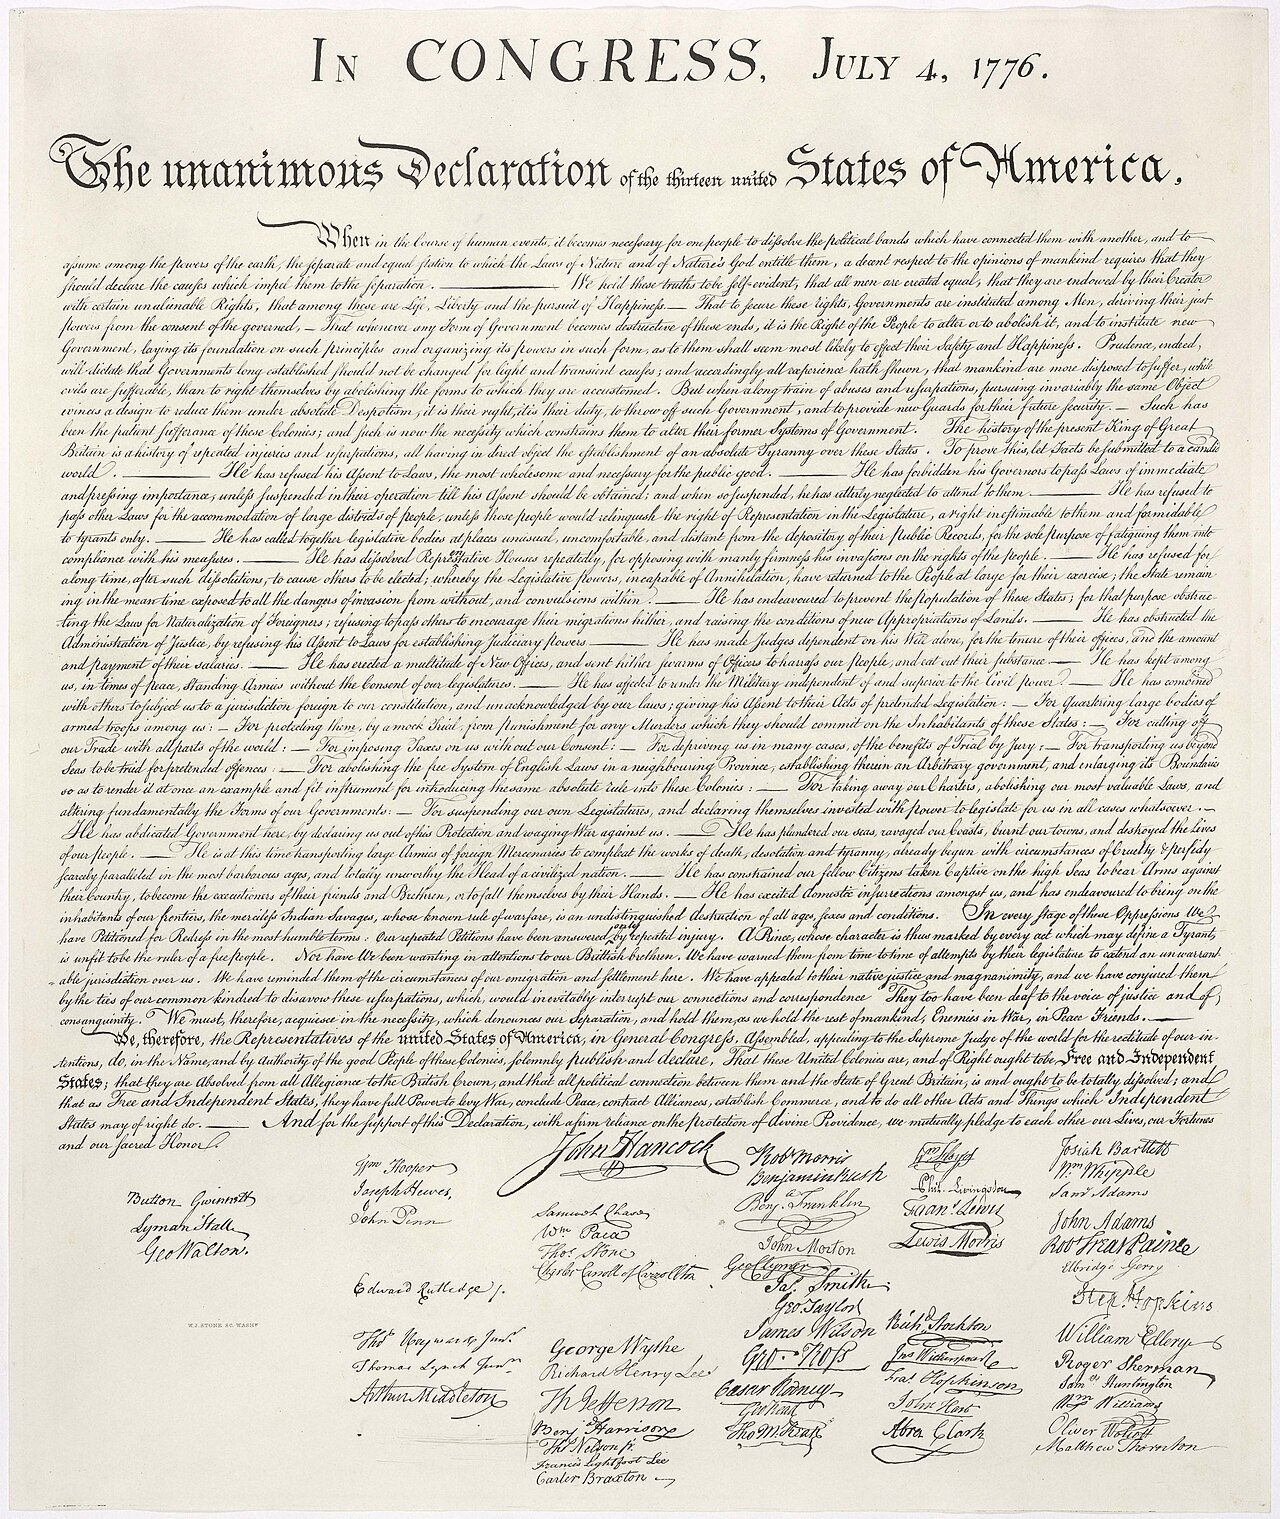
Don’t you find it interesting that one of the mistakes (there are two) on the Declaration of Independence looks like this:
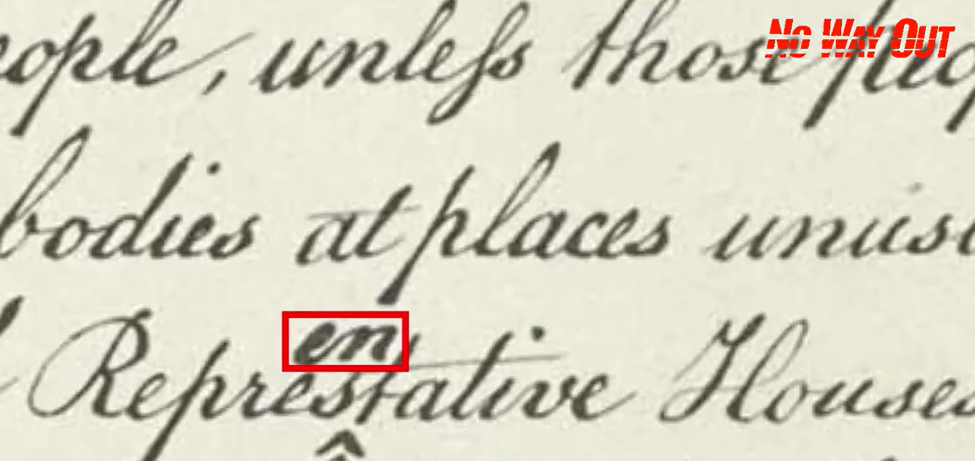
Notice the en in the boxed red but also notice the double chevron below it … same as the Great Pyramid. What do we have here? Coincidence, I know … 😉 (I didn’t do a good enough job cutting the video from our podcast w/ Alan) but you get the point.
So, anyway, we have the D’ver mentioned w/in the description of the Solomon’s Temple but what the heck is the inscription in from the Great Pyramid?

Do you see where I am leading us …?
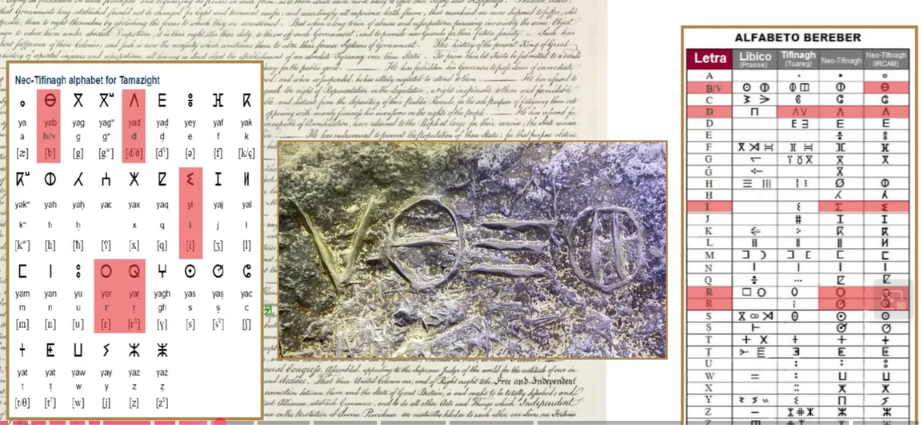
Literally, there was on archeologist that had the knowledge to decode this ANCIENT inscription that met you as one entered the Great Pyramid. Again, look it up … what possibly could this mean?

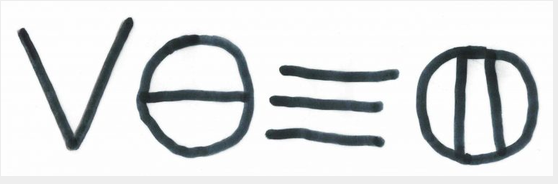
Yeah … um. Sit with that ….LONG before Solomon’s Temple housed the holies of holies, the Ark of the Covenant, inscribed in an ancient language of Amazigh that goes back 3000-5000 years had an understanding of the D’ver or the initial OHM that created this entire thing from Genesis 1:3. (note – that ‘3 in 1’ or ‘111’ will come into play, later, but for now, I’m running out of time to go see Toy Story. Kind of wild that I’m typing about ancient languages, the D’ver and the nature of reality but need to go see Toy Story? Must be the fasting?)
Anyhoooo ….
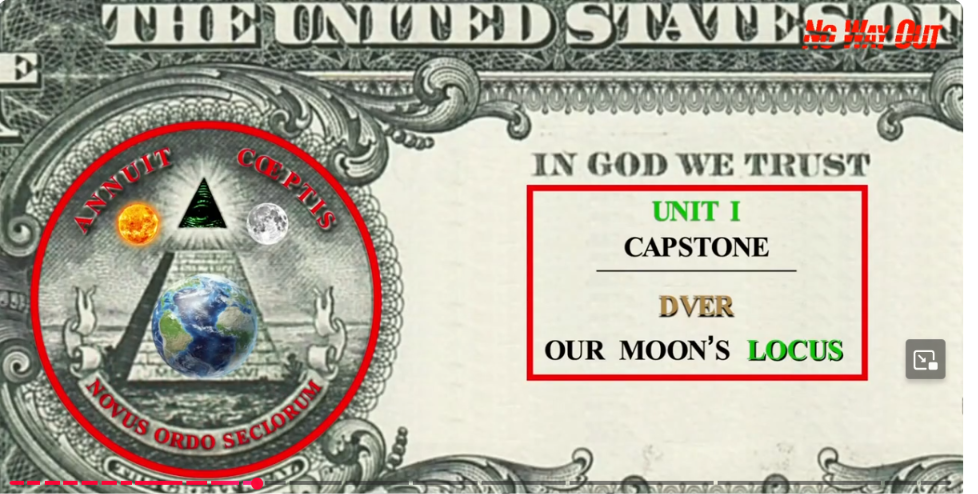
Well, would you look at that … the back of the Dollar Bill was an annagram! And, there, was encrypted the D’ver.
The above information is ALL discovered by my friend and author of the America Codes, Mr. Alan W. Green. An amazing joyful chap with an infectious laugh and the mind of THE master engineer.
Off to see Toy Story and try to remain grounded in this 3D matrix of consciousness and polarity.
59 amazing years man … I’m just getting started.

SURF LIVE. Love you all …
James Anthony Bartelloni …
Japan – July 7, 2026

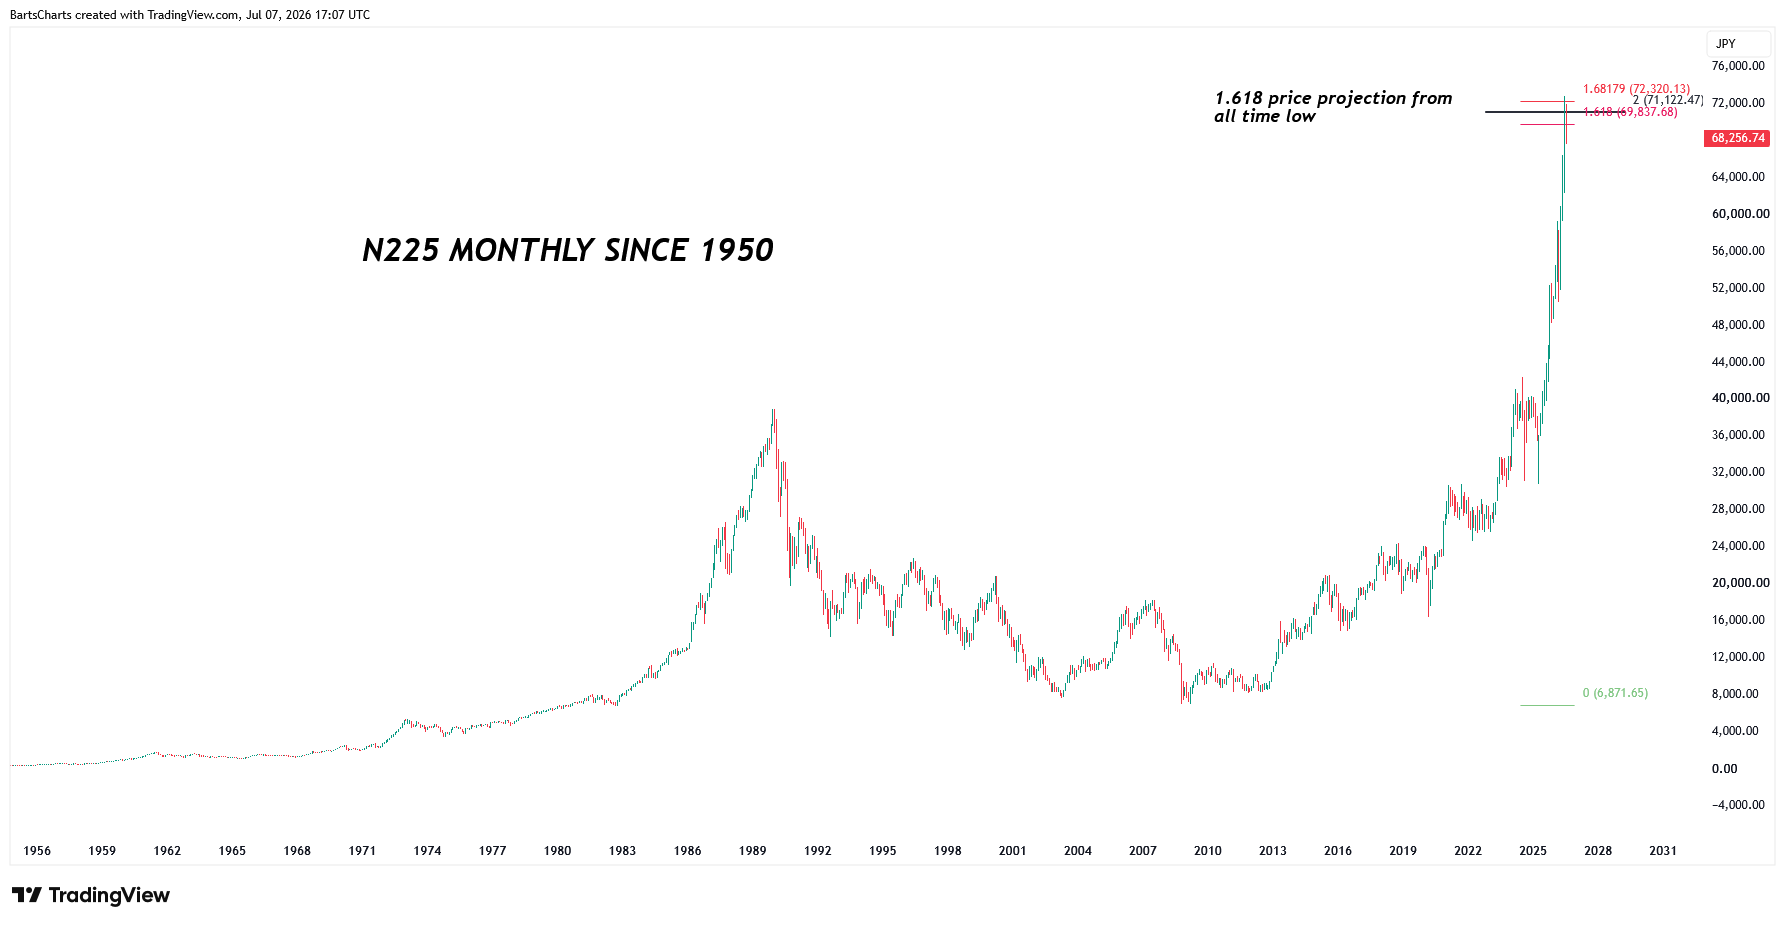
The yen is worth watching right now, and not just for FX traders. USD/JPY is sitting near 40-year lows even after the Bank of Japan hiked its policy rate to 1.00%, and Tokyo has been openly threatening intervention to stem the slide. That weakness has fueled a massive yen carry trade — investors borrowing cheap yen to fund bets on US tech stocks — with speculative short positions on the yen near multi-year highs. If the yen snaps back sharply, that trade unwinds fast, forcing a rush to sell US equities to repay yen loans, echoing the July 2024 episode when a BOJ hike triggered a global risk-asset selloff in a matter of days. There’s a slower-burning version of the same story in bonds: as JGB yields rise toward levels not seen since the 1990s, Japanese banks, insurers, and pension funds — who collectively hold about $1 trillion in Treasuries — have less reason to keep recycling savings into US debt, and even a gradual pullback could add 15-25 bps of upward pressure on 10-year Treasury yields over the next year or so. Put together, Japan’s policy normalization is a genuine cross-asset risk for US markets: a fast channel through equity-market carry-trade unwinds, and a slow channel through rising Treasury yields and tighter financial conditions.
Here is the Nikkei 225 – smacked right into the 1.618 projection from the all time low … folks, this is a projection from 75+ years ago. SHOULD be big resistance.
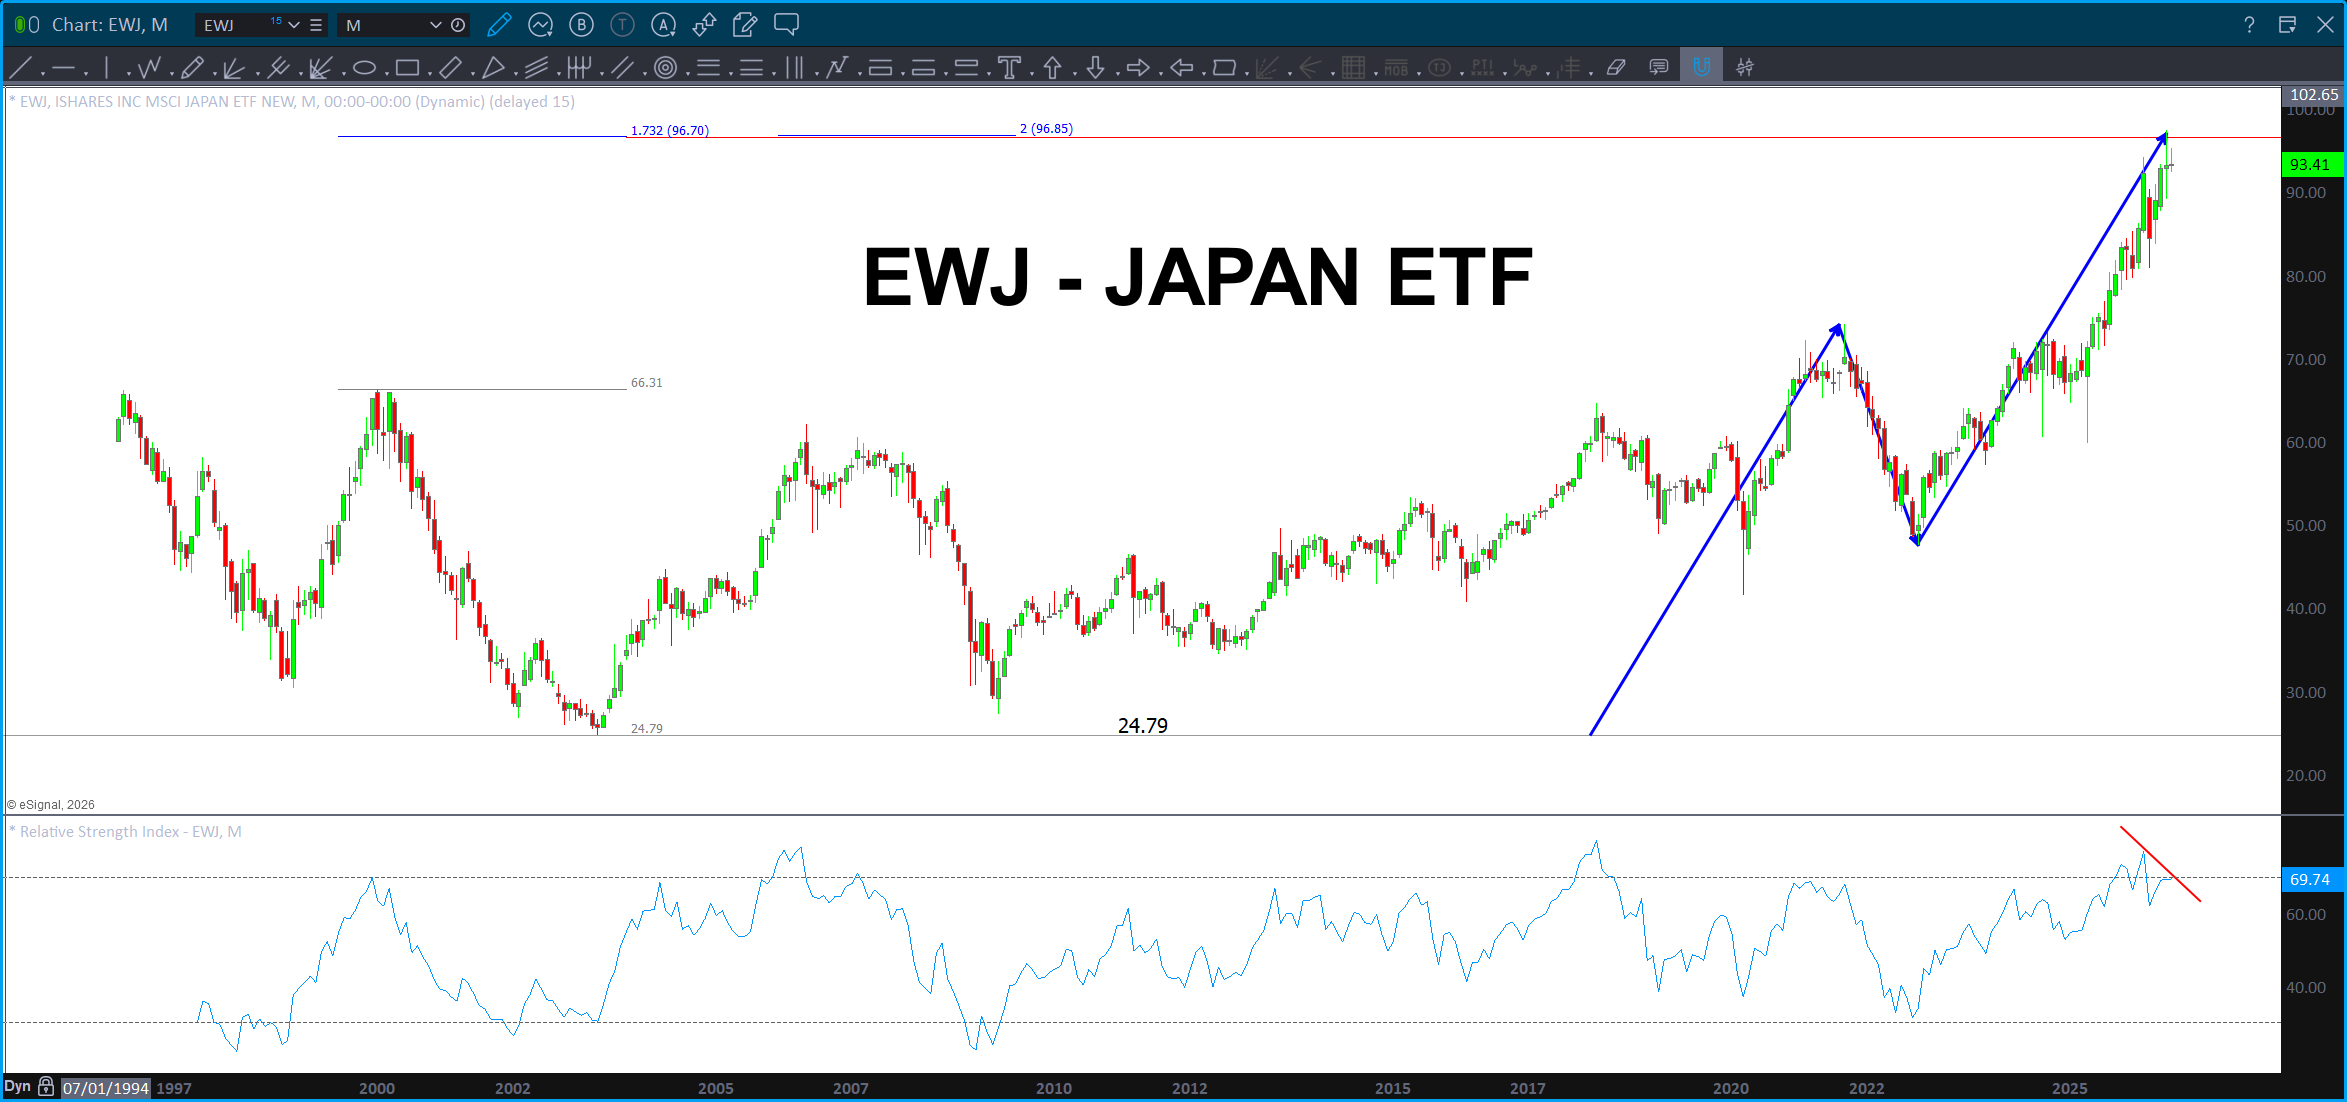
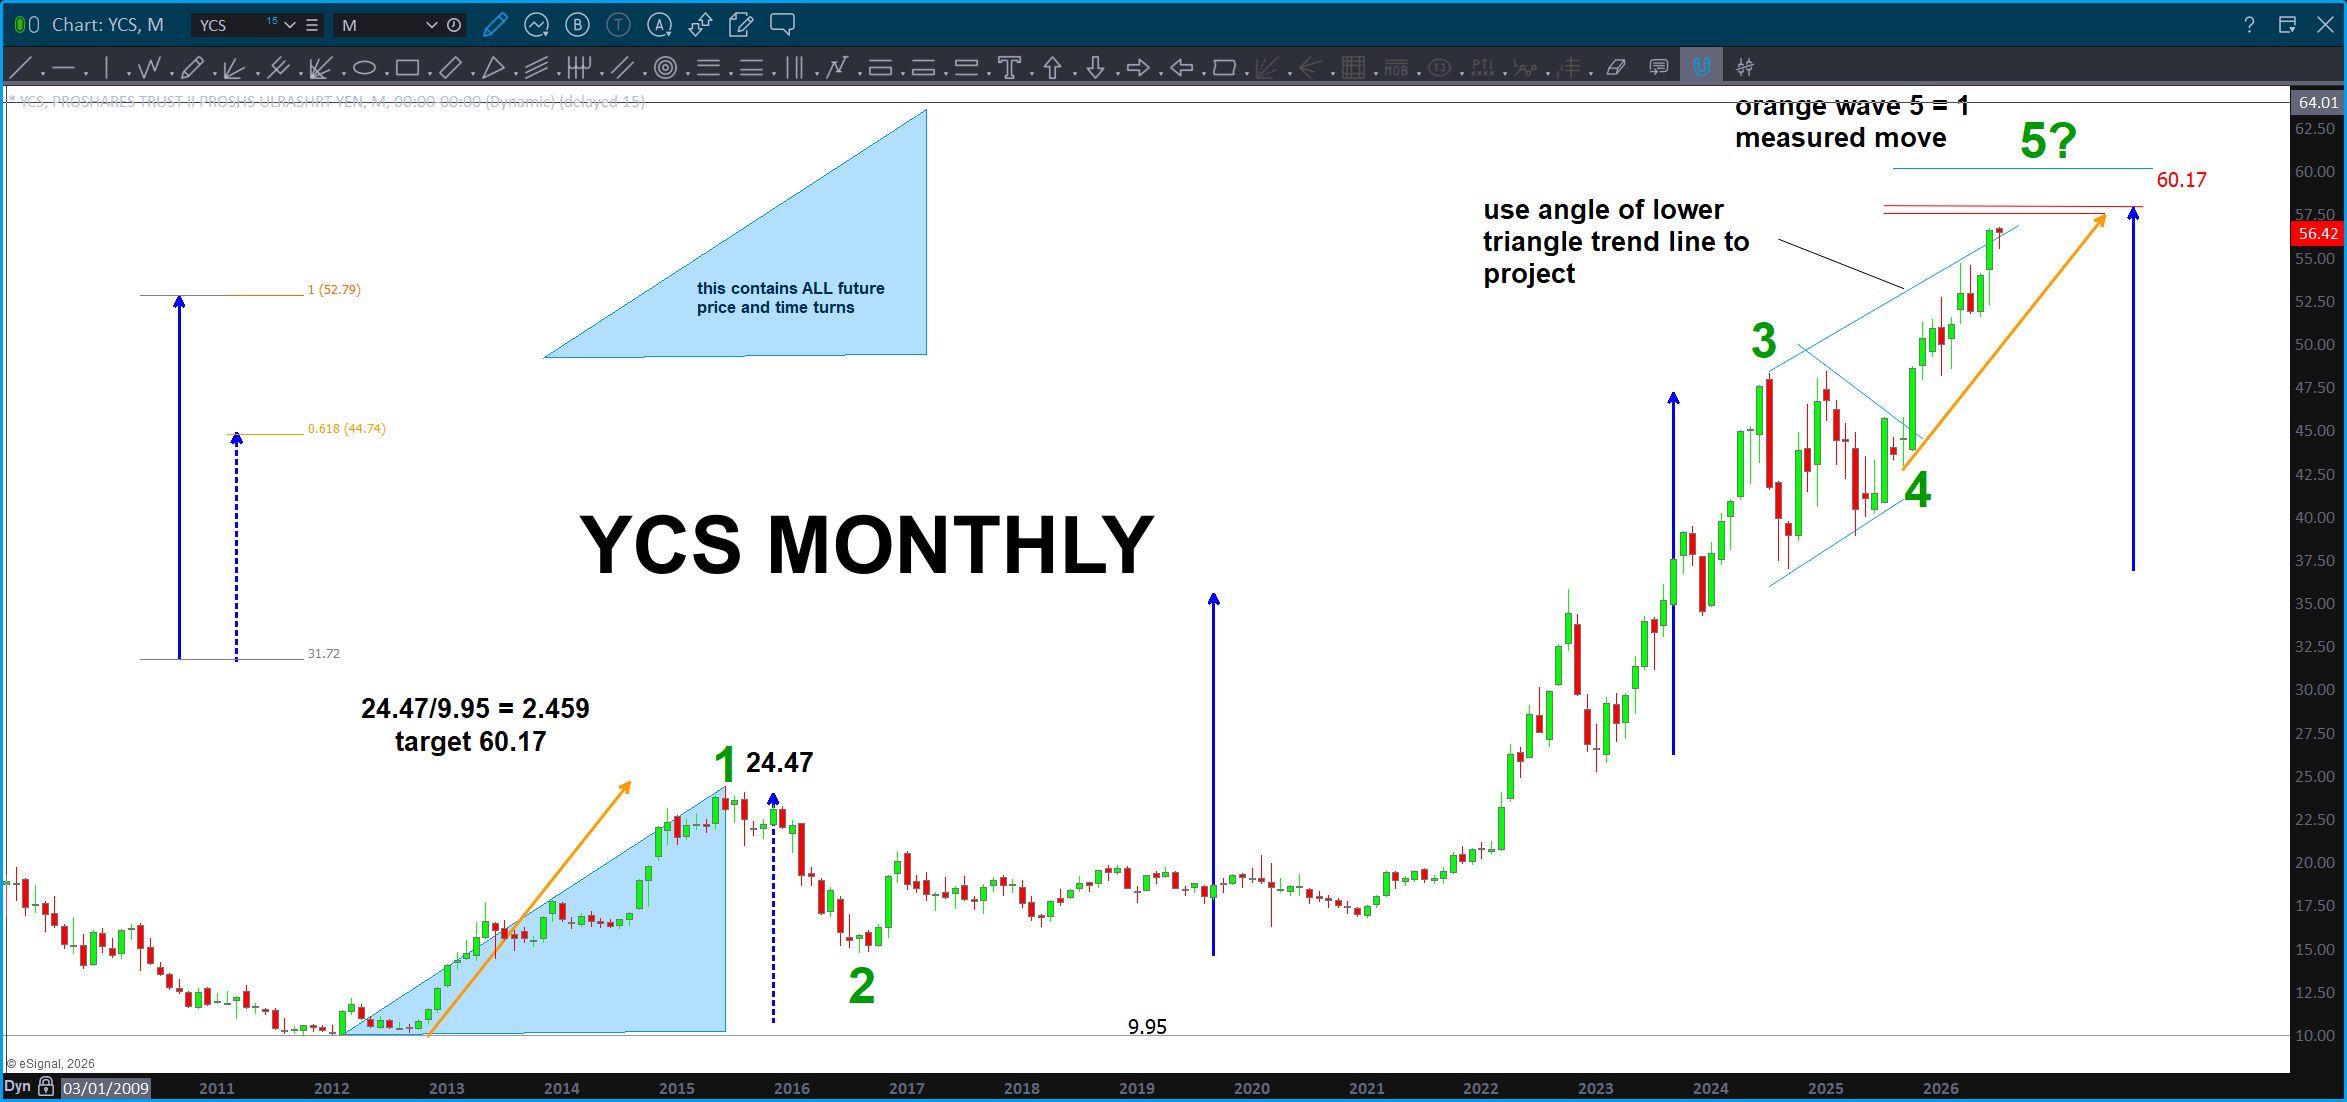
Here’s the EWJ and YCS:
Then, the big player, the YEN vs the USD. Folks, remember, the FX world is the apex predator of the financial world … just think of the FX market as the killer whale.
We ID’d a resistance level back in April and, surprisingly, it’s just been taken out to the upside by just a little bit …
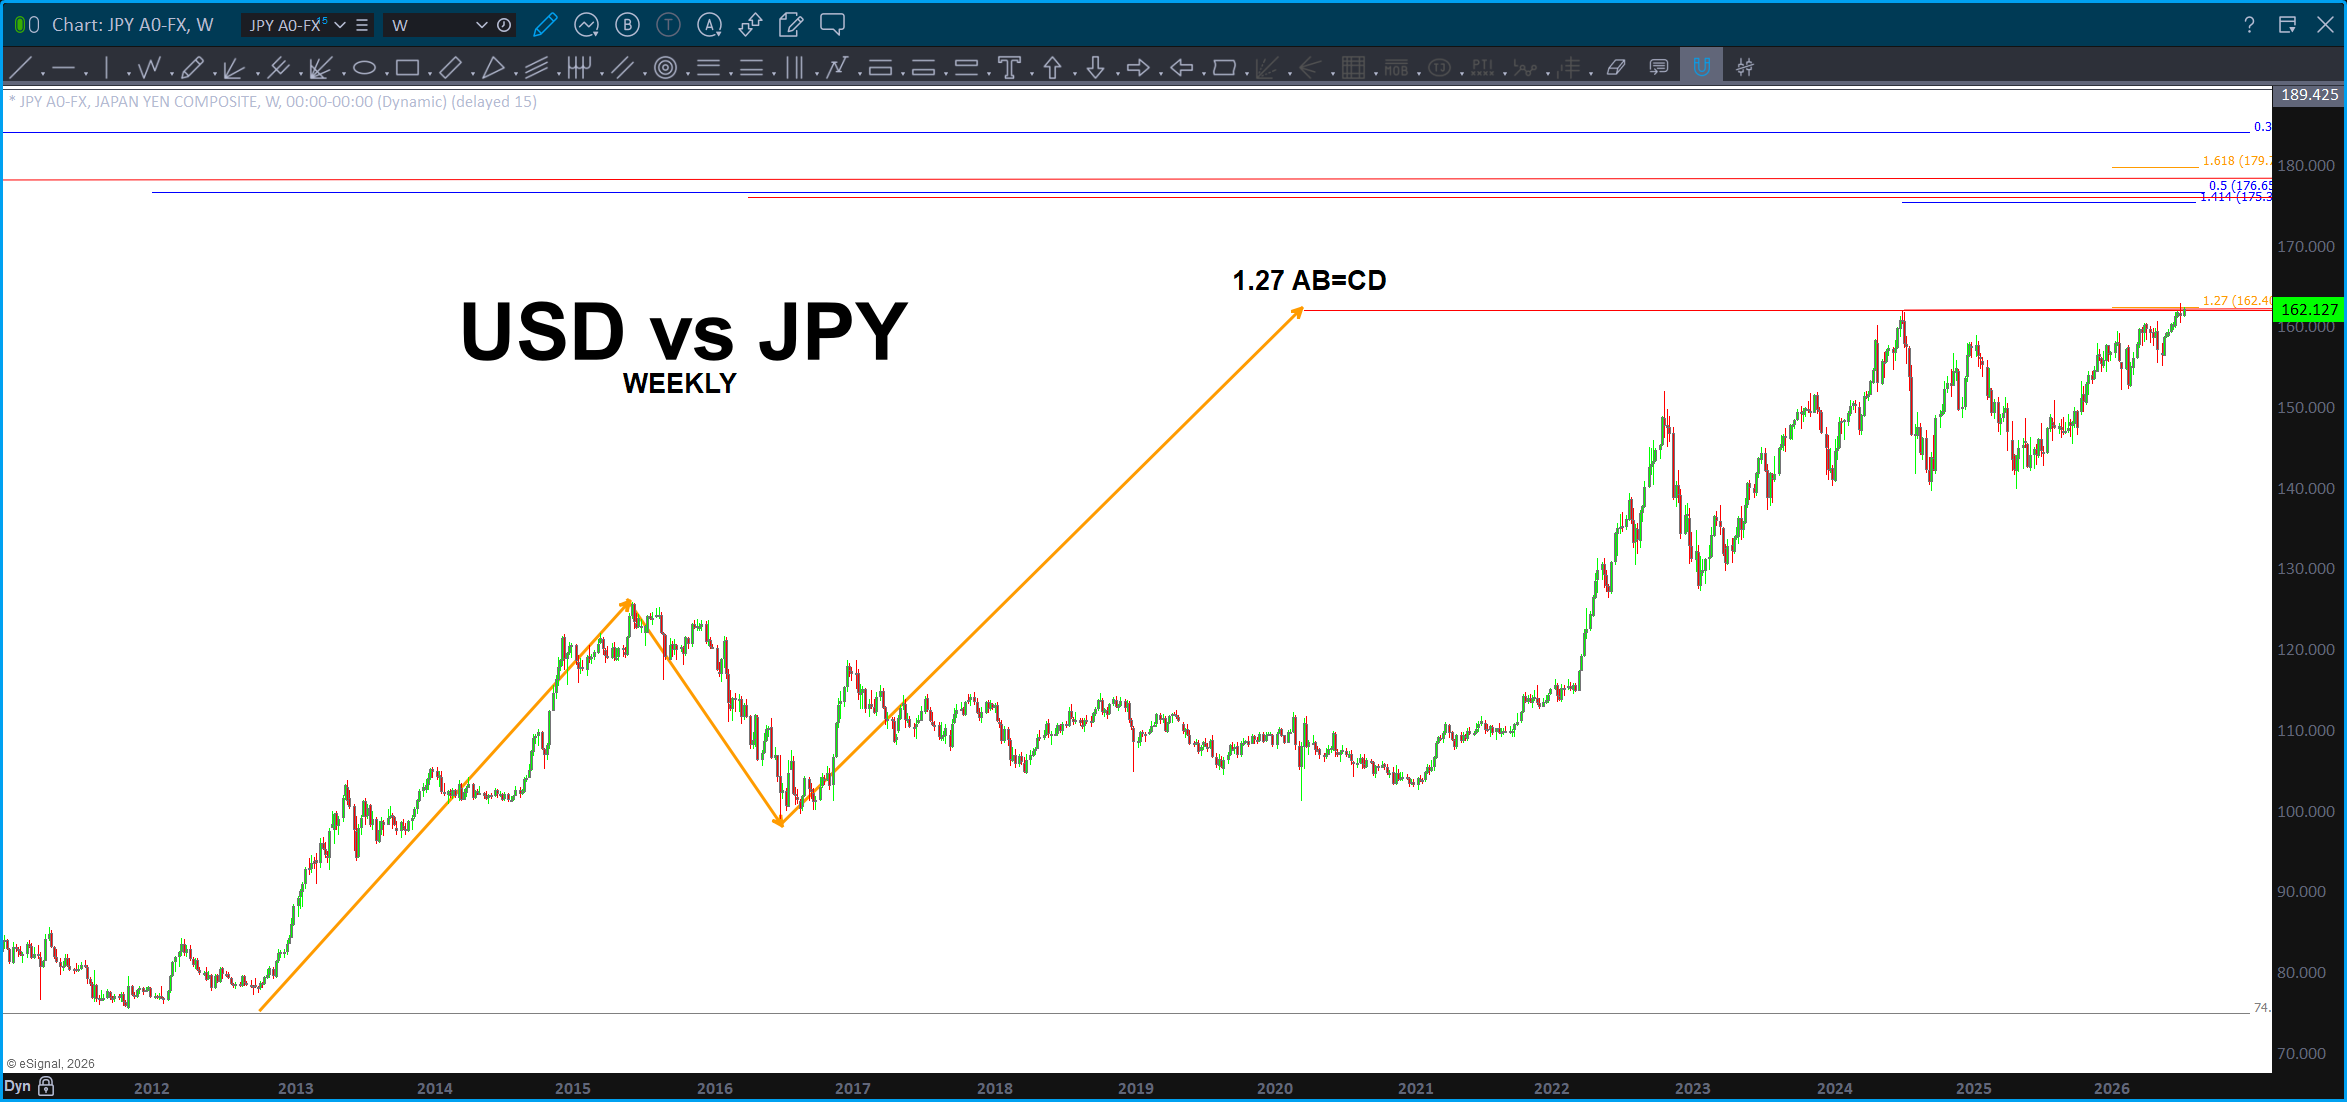
Depending on the moves (or not) w/ the BOJ there is also a VERY strong resistance zone higher, keep that in mind:
Tons of confluence a little higher BUT … are we going to make it there?
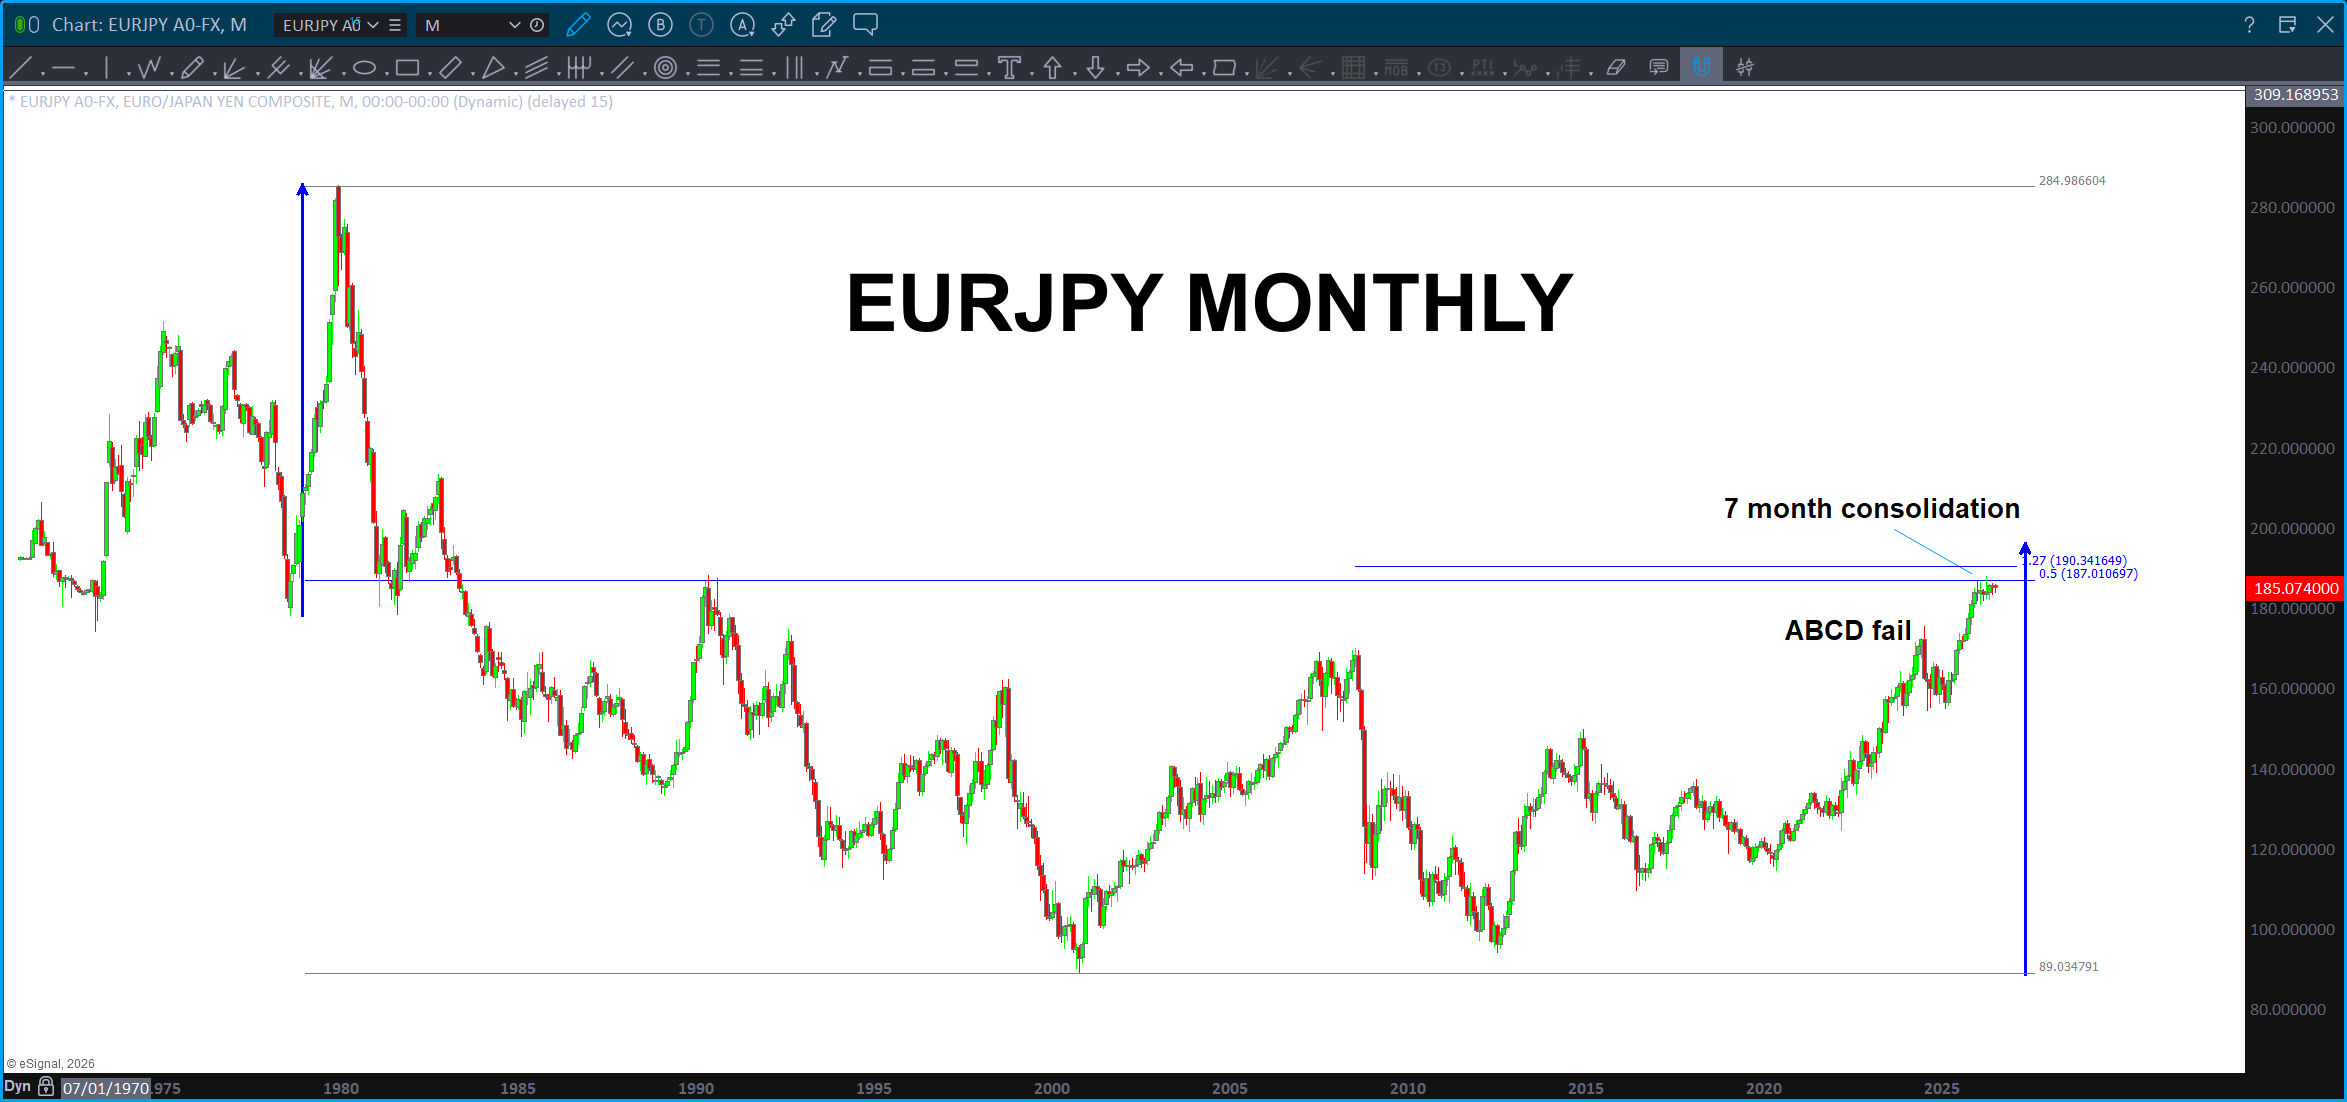
EURJPY reacted, initially, w/ the ABCD and it was literally a day or so prior to the rate announcement – however – it has run into strong resistance and has been sitting ‘waiting’ for 7 months.
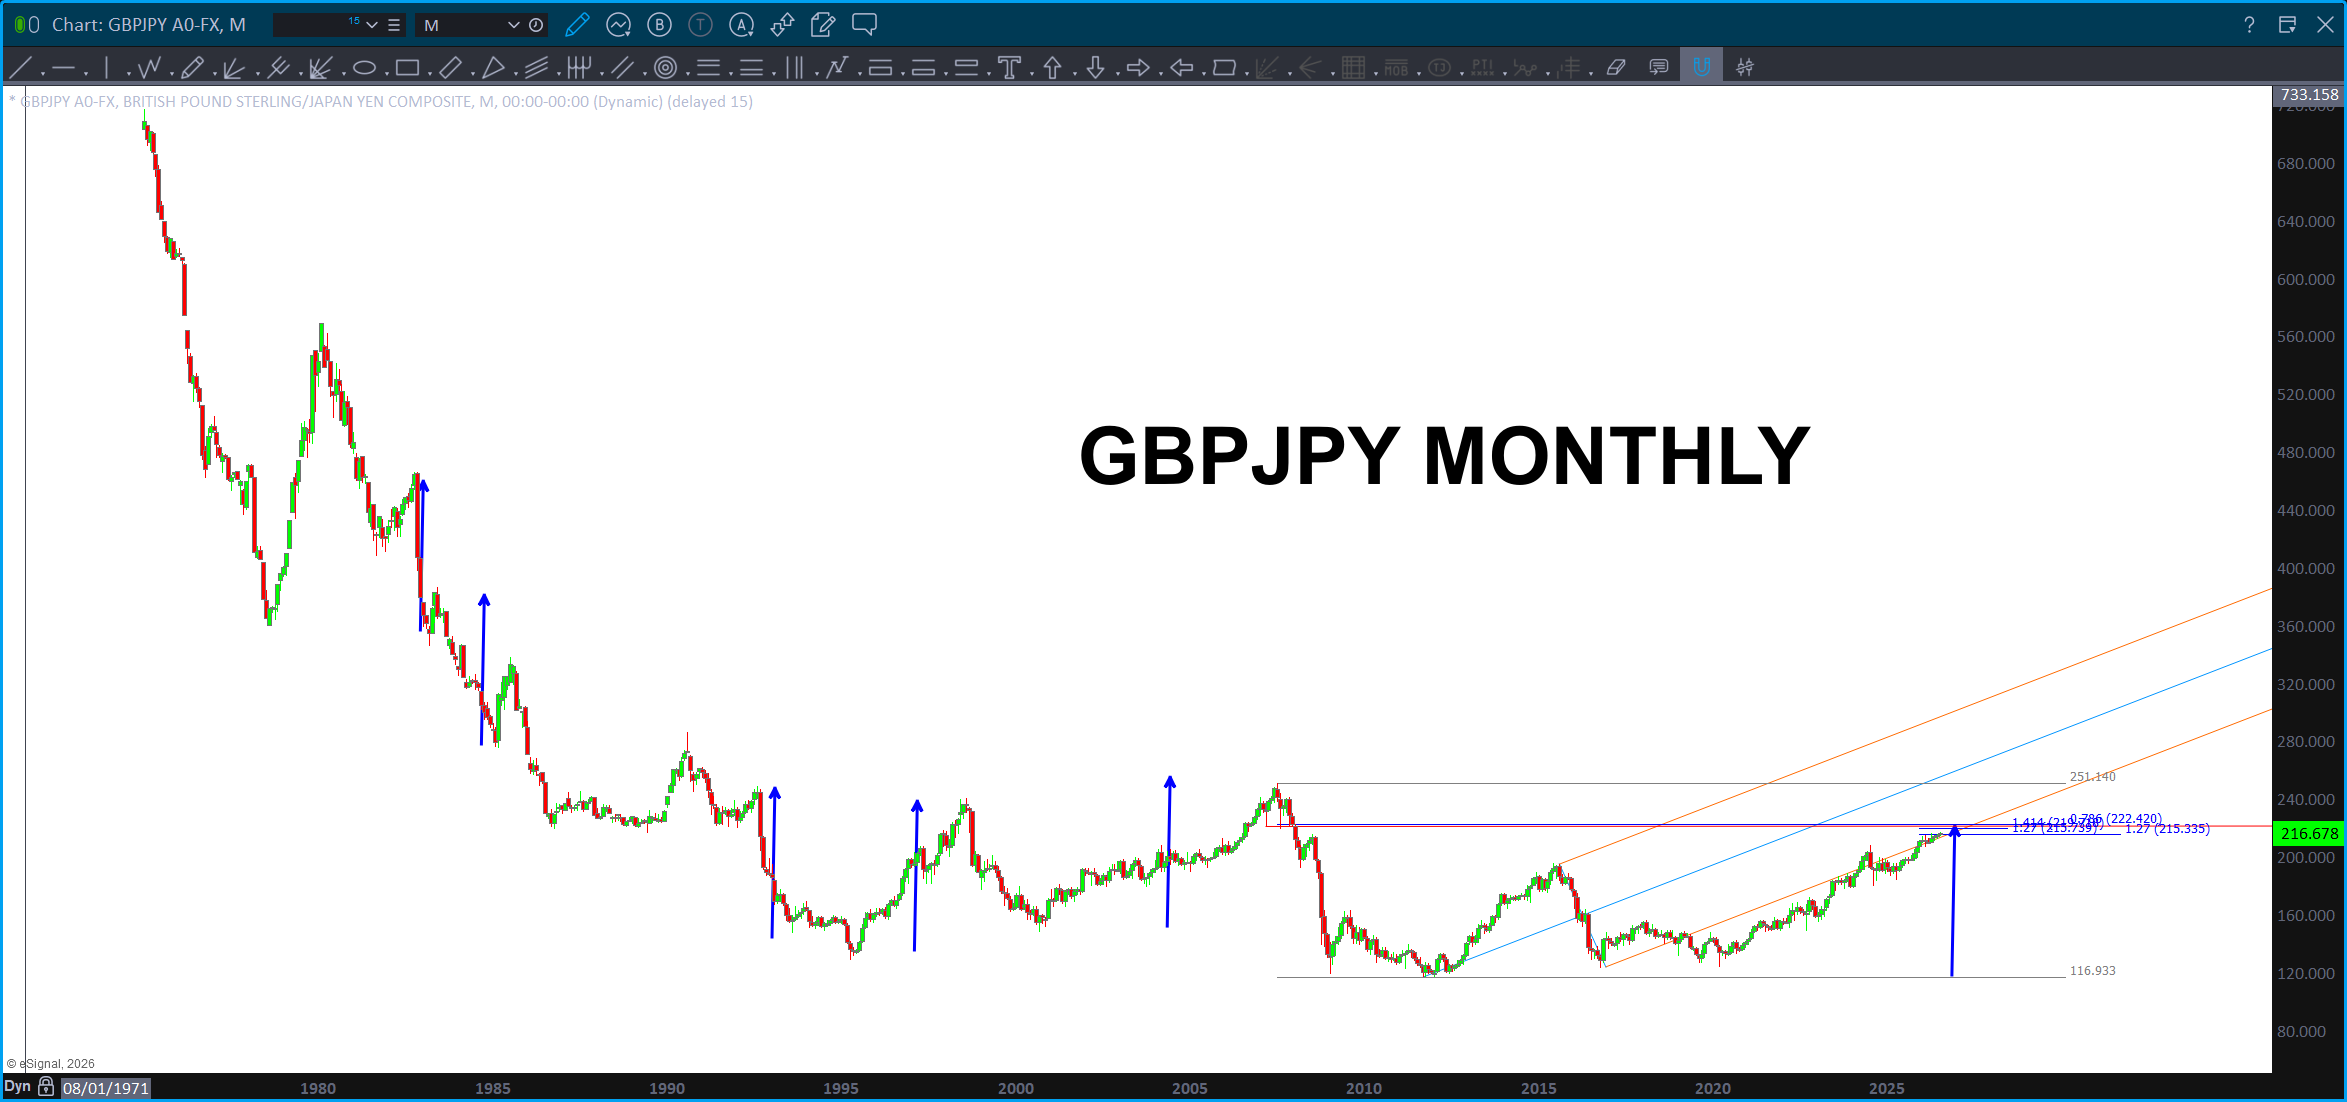
GBPJPY – reacted to the pattern but has since gone higher but, again, is smacking into resistance.
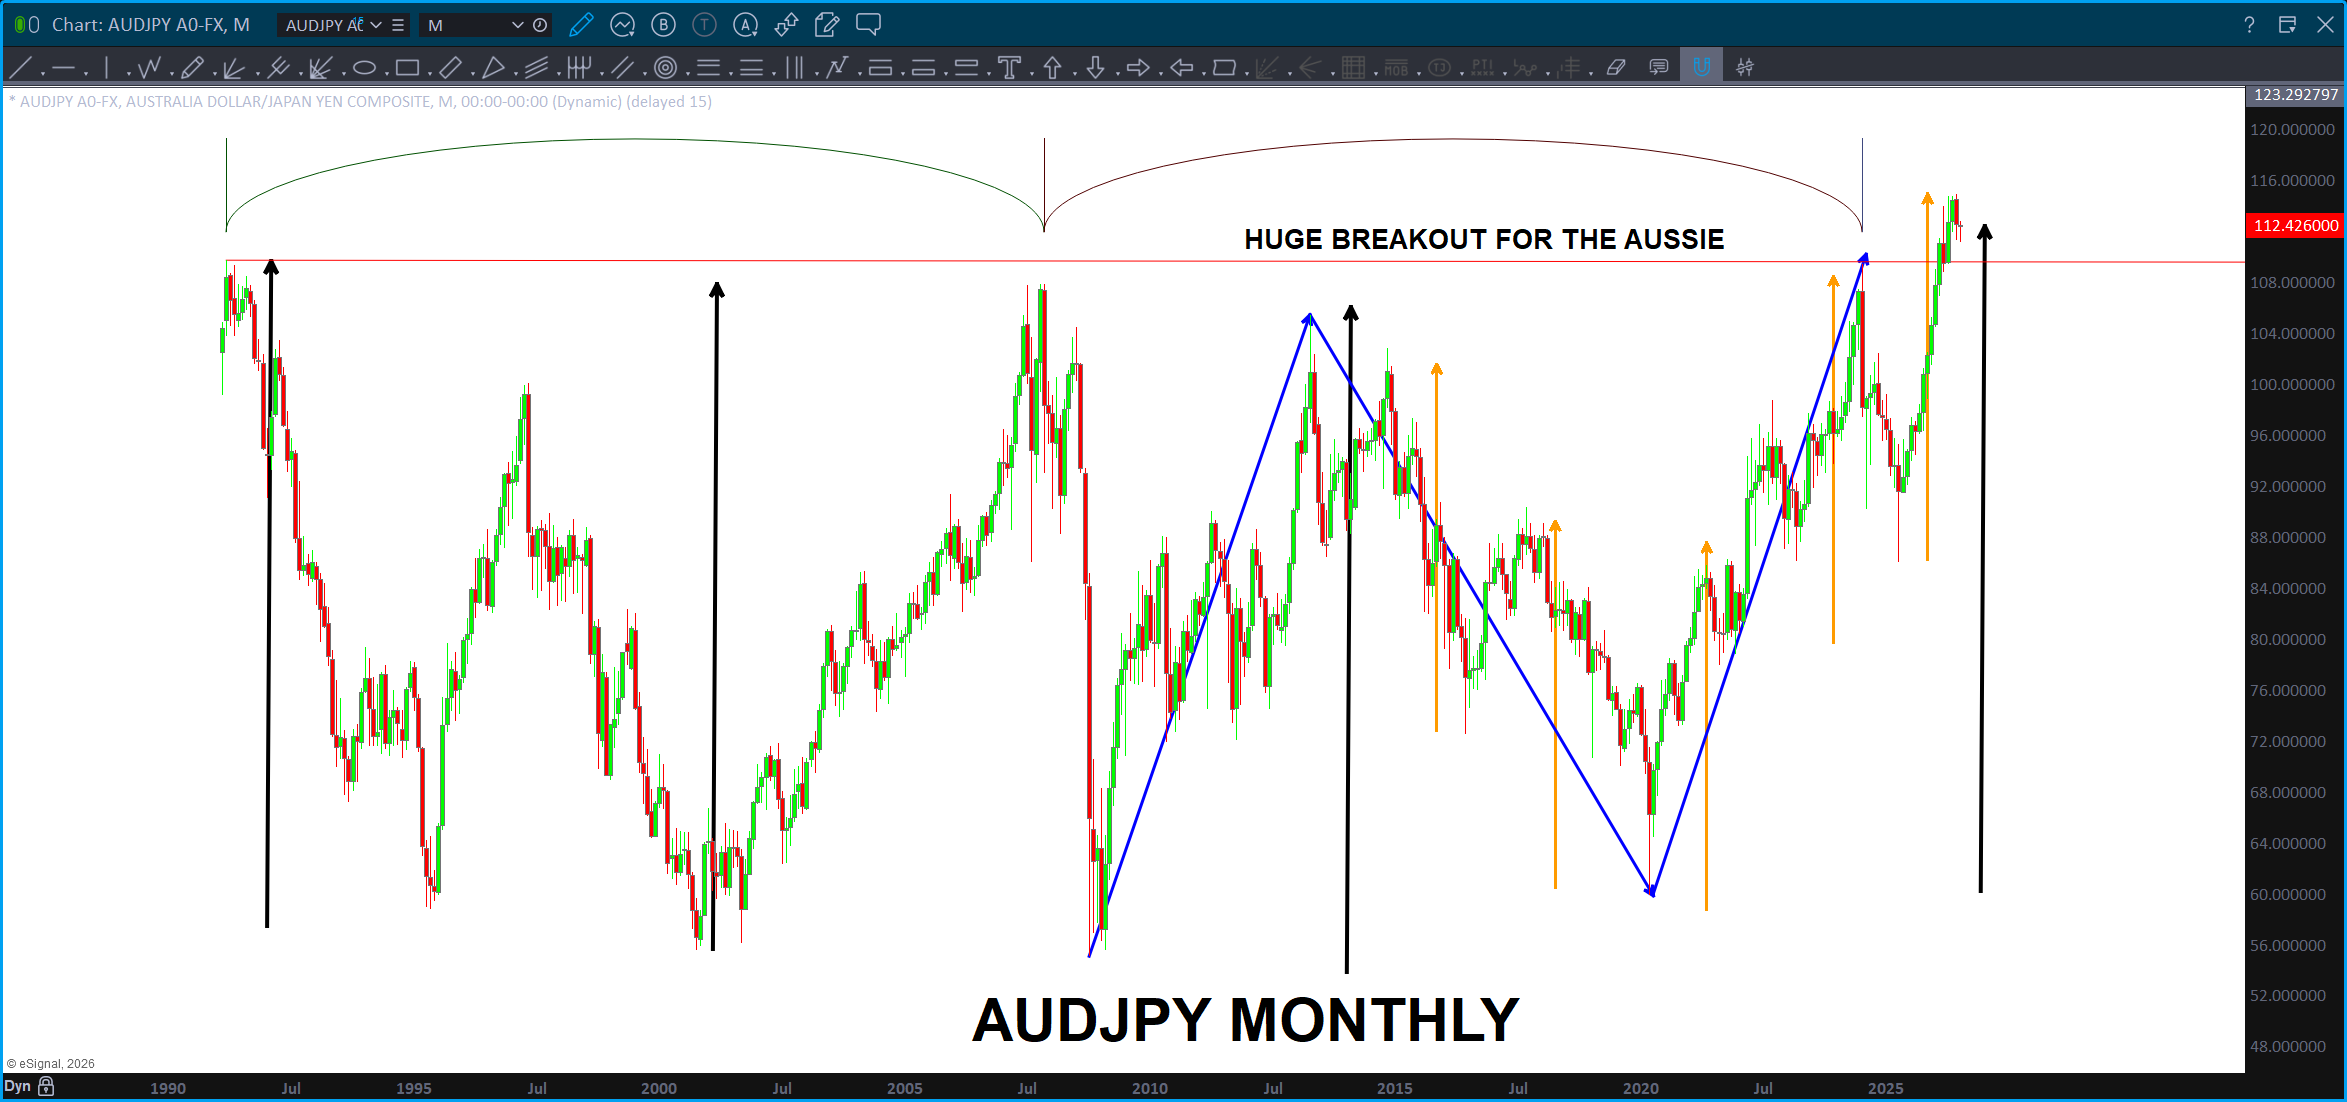
The Aussie broke out against the YEN for the first time in 35 years. I find that a ‘big deal’ as 1/ the AUDJPY did smack into the pattern BUT it has since regained that level and taken out a major resistance level. Note, we had a static time cycle along w/ the ABCD projection so the fact that it broke out after all that … showing some strength. If the AUDJPY closes below that ‘huge breakout” level then something ain’t right at the circle K. Also, note, while this was a NICE time and price confluence it was NOT the BIG turn like the past ones …that’s what we are searching the platonic space for … the geometric confluence of price and time that, literally, completes the platonic solid which encapsulates this collective conciousness investing in the AUDJPY. It went right to the attractor and sold off BUT it was not THE level … the price worked, but it wasn’t TIME. 😉 That’s what I’m working on … time/price confluence in the platonic space which provides the geometric conversion of sacred geometry into price and TIME patterns.
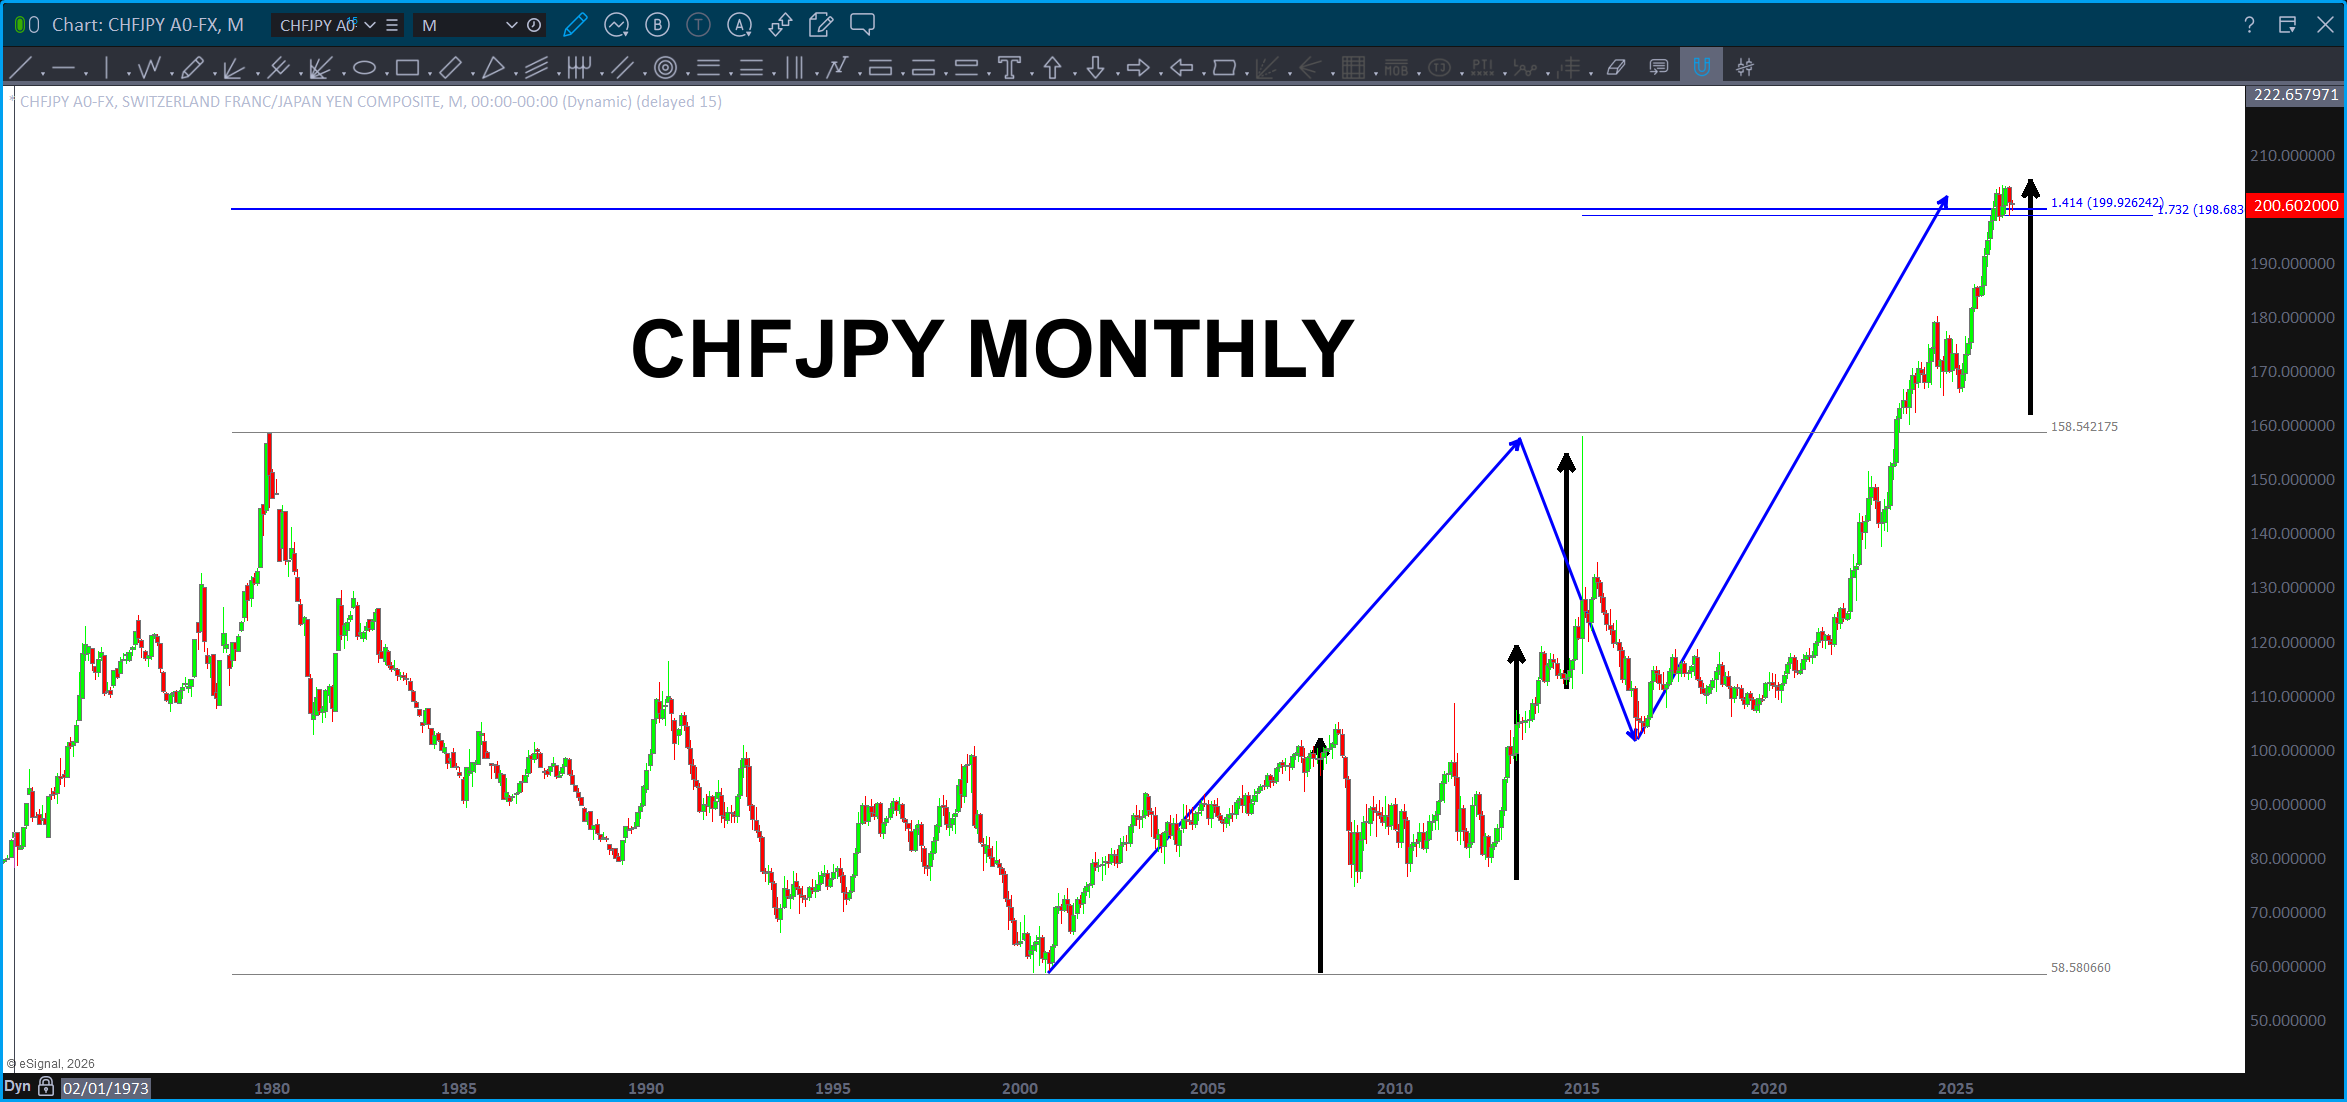
Here’s the CHFJPY … not sure why, but I totally missed the larger ABCD shown w/ the blue arrows … monthly CHFJPY ABCD and now another 7 months of consolidation.
Folks, the FX crosses w/ the YEN appears to be hitting major resistance …
One last, these were big patterns that HIT and allowed for some good financial opportunities but the patterns all eventually failed … except, the USDJPY. Yes, it’s gone just a wee bit higher BUT ultimately, the dollar has been the weakest of the currencies versus the YEN. Hmmmmm ….
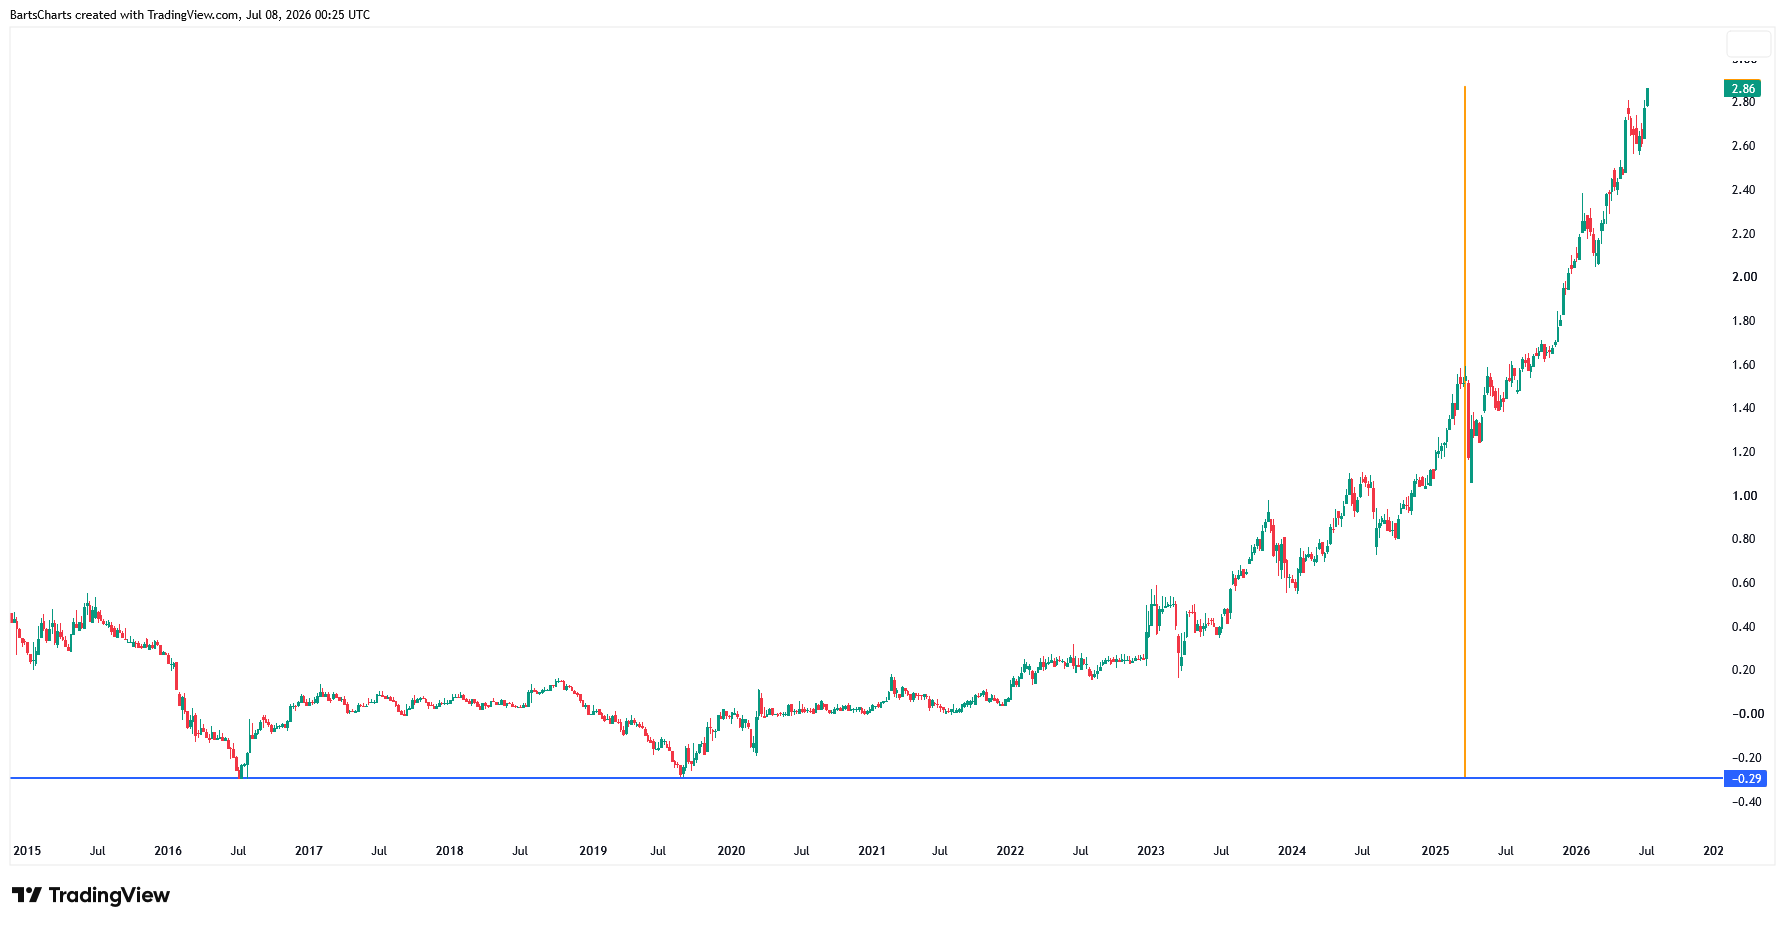
Here is a look at the culprit of all this mess … above is the 10 year rates for Japan. Folks, their interest rates are up over 1,000% !!!!
This is going to be very interesting, for sure.
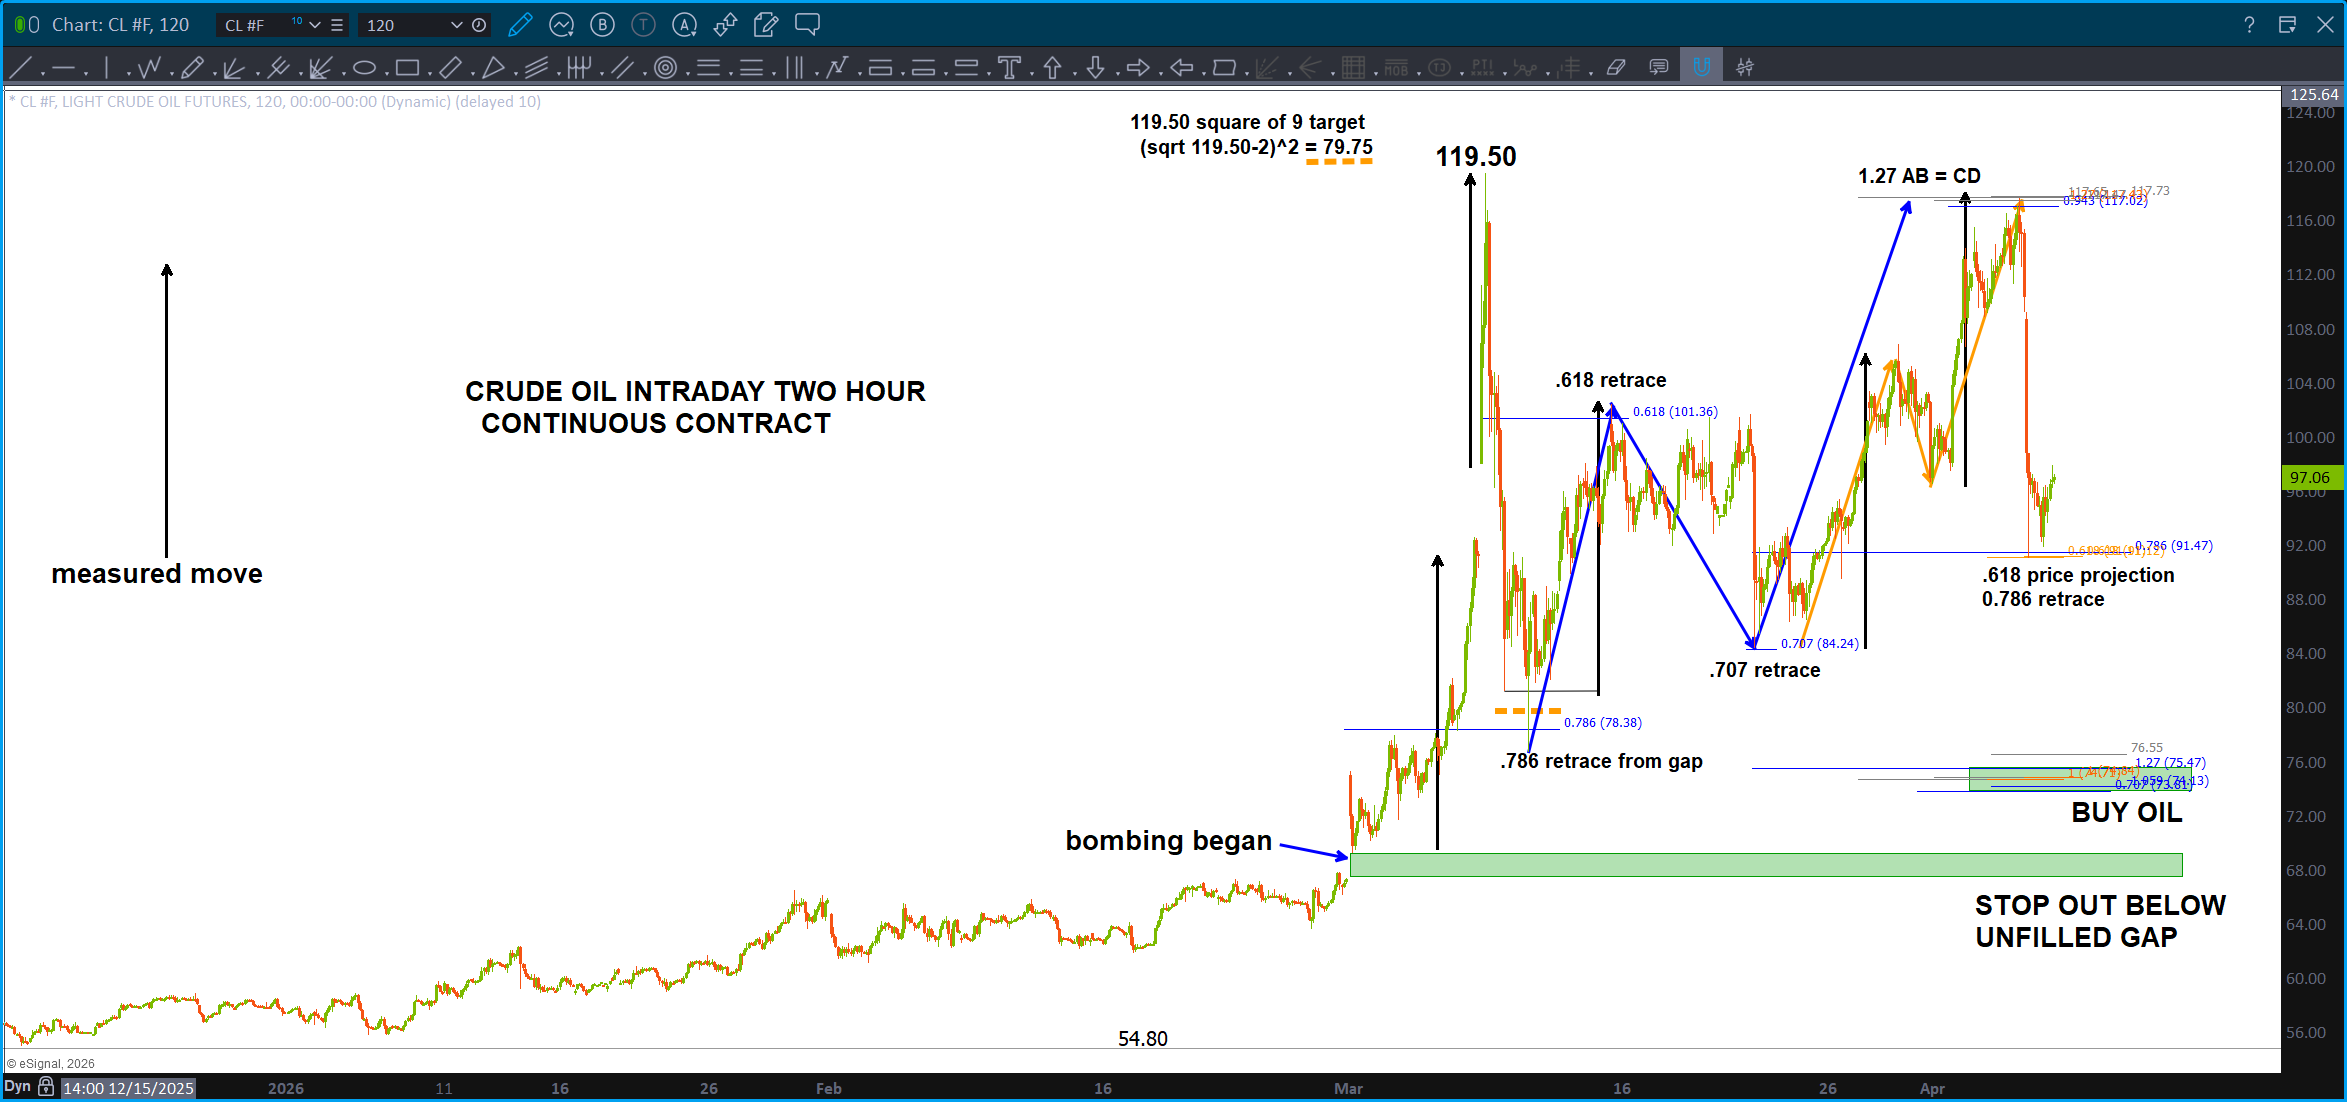
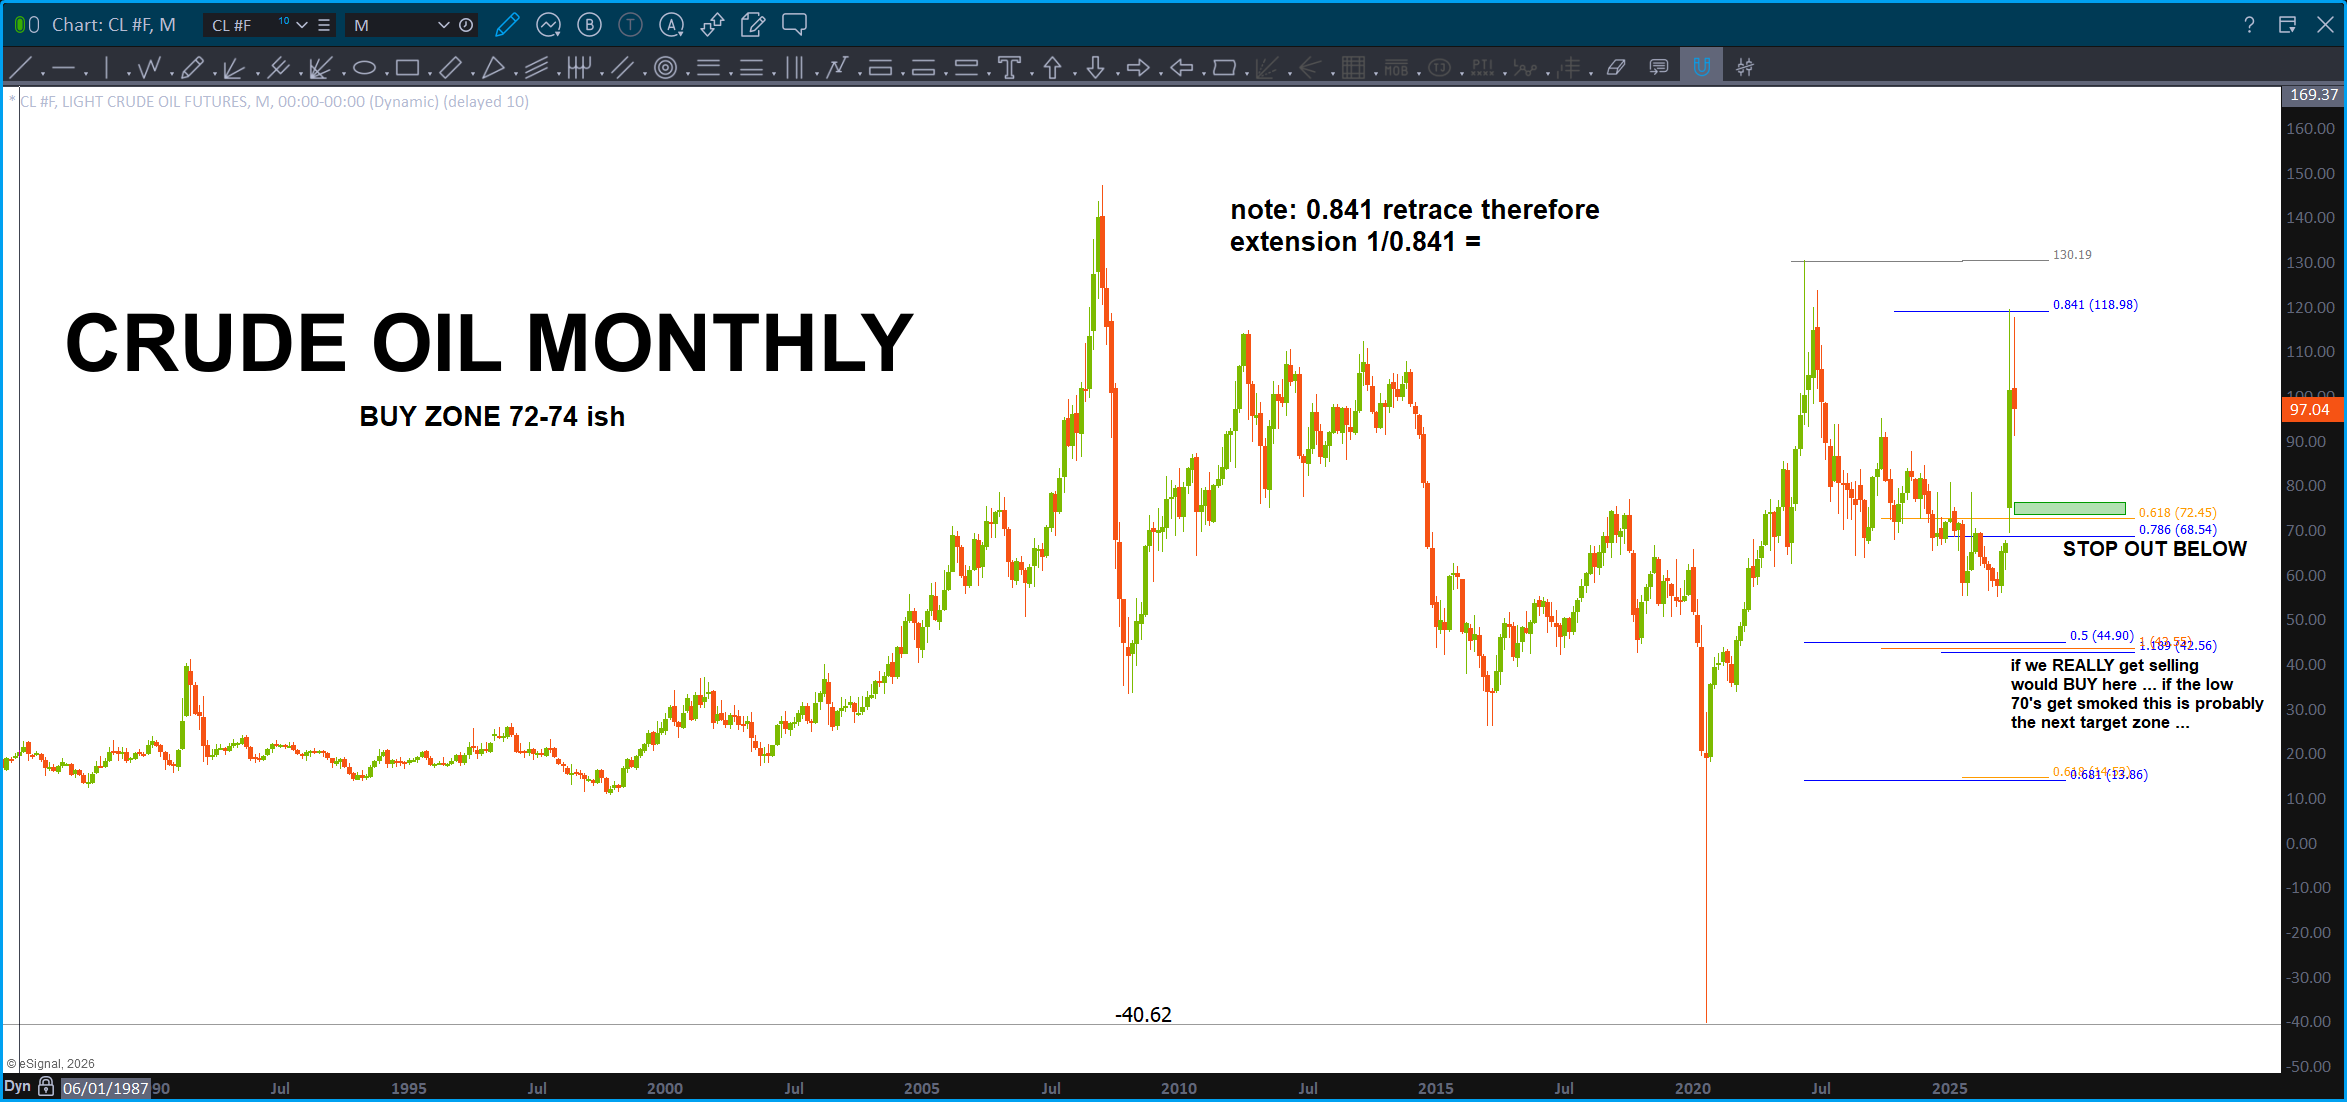
Crude Oil – July 7, 2026

Well, looks like they are bombing Iran, again …
Did the bombing of Iran cause oil to find support or was the attractor ‘sitting’ in the platonic space waiting to be discovered? Who knows and, frankly, who cares.
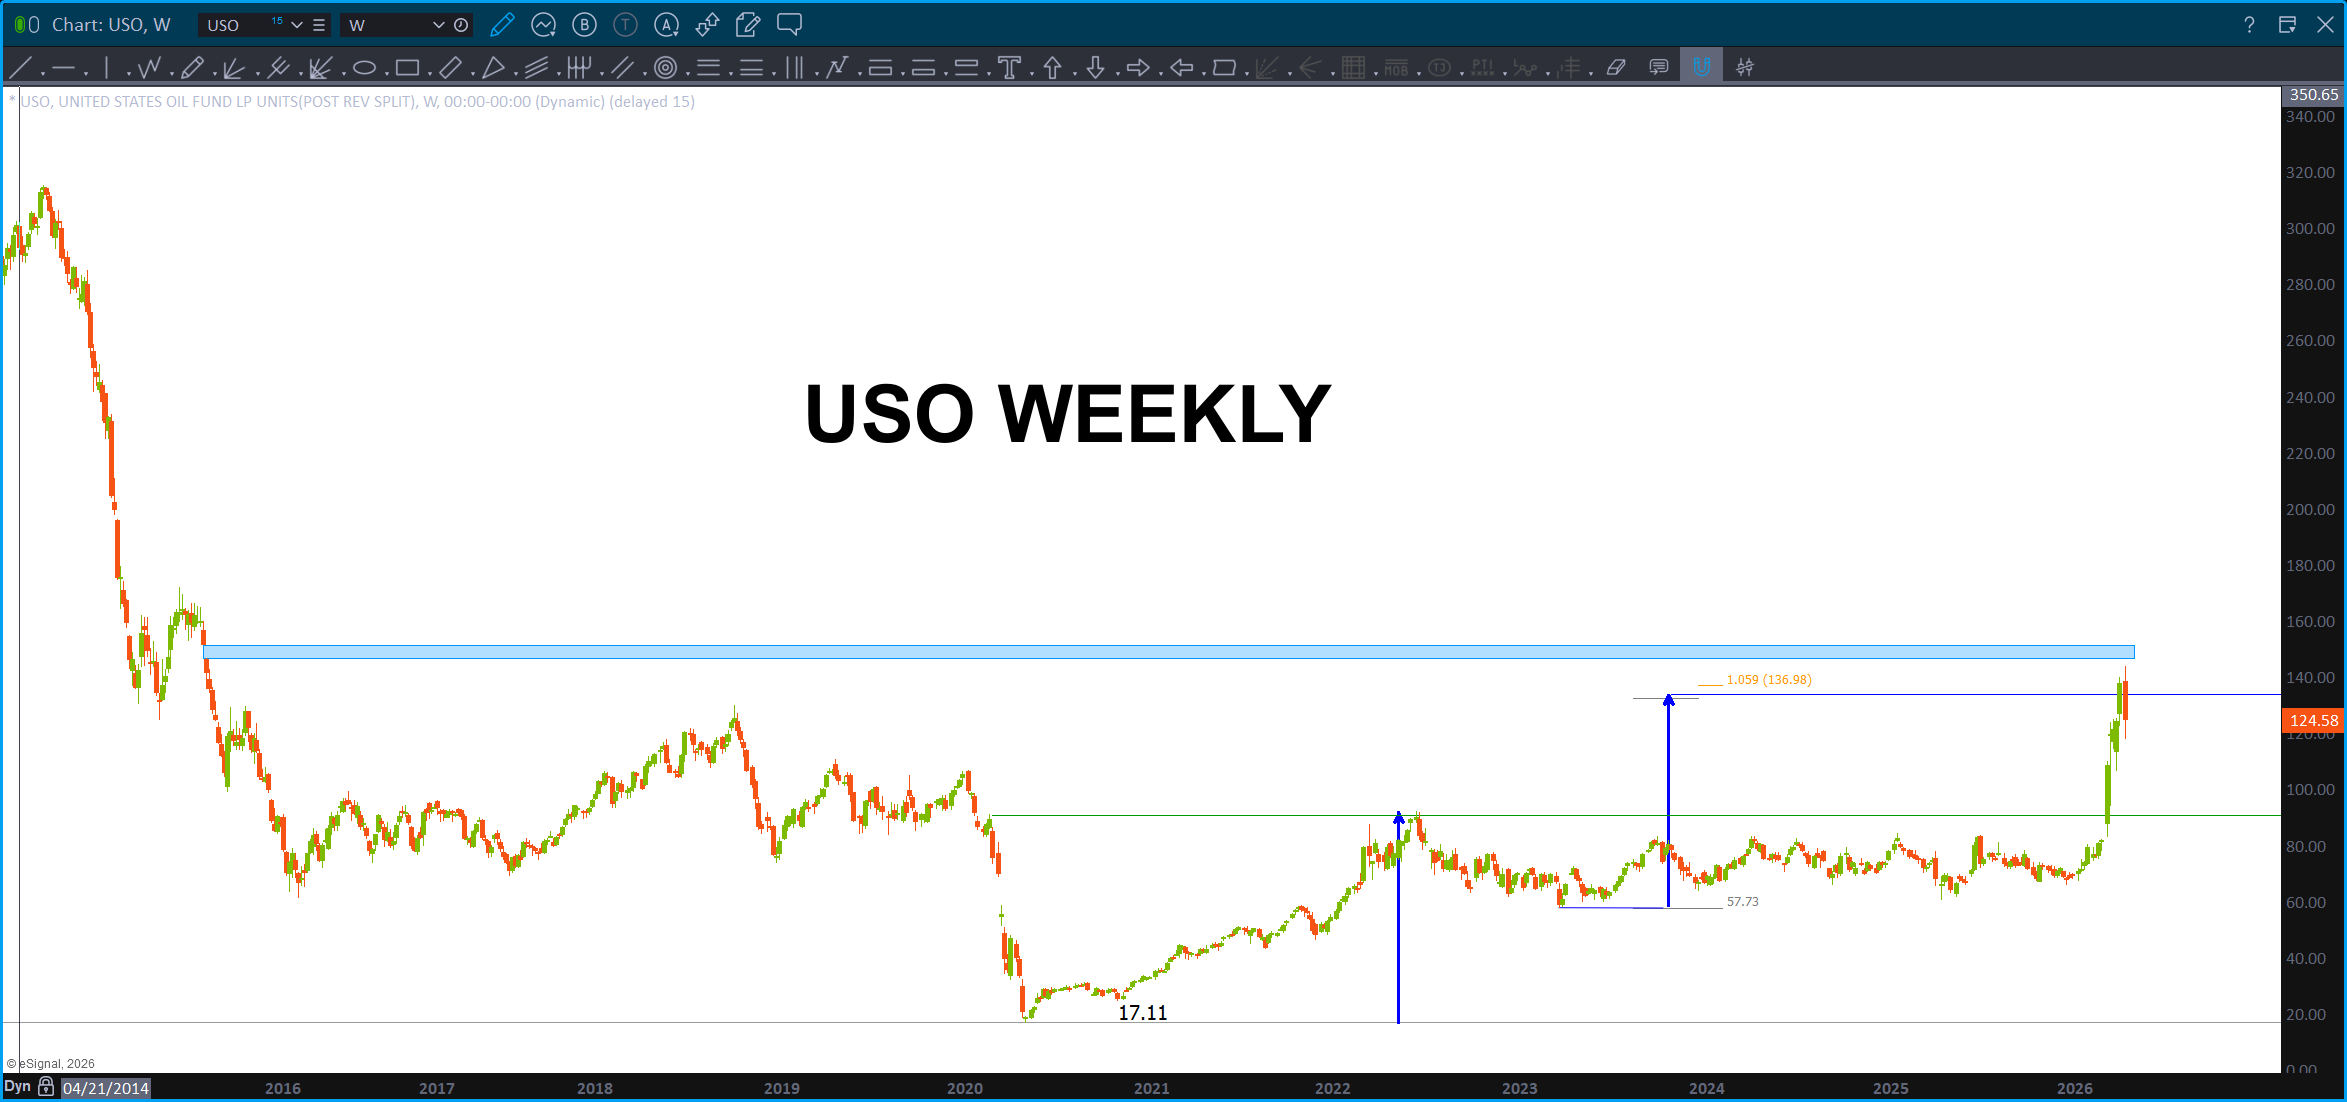
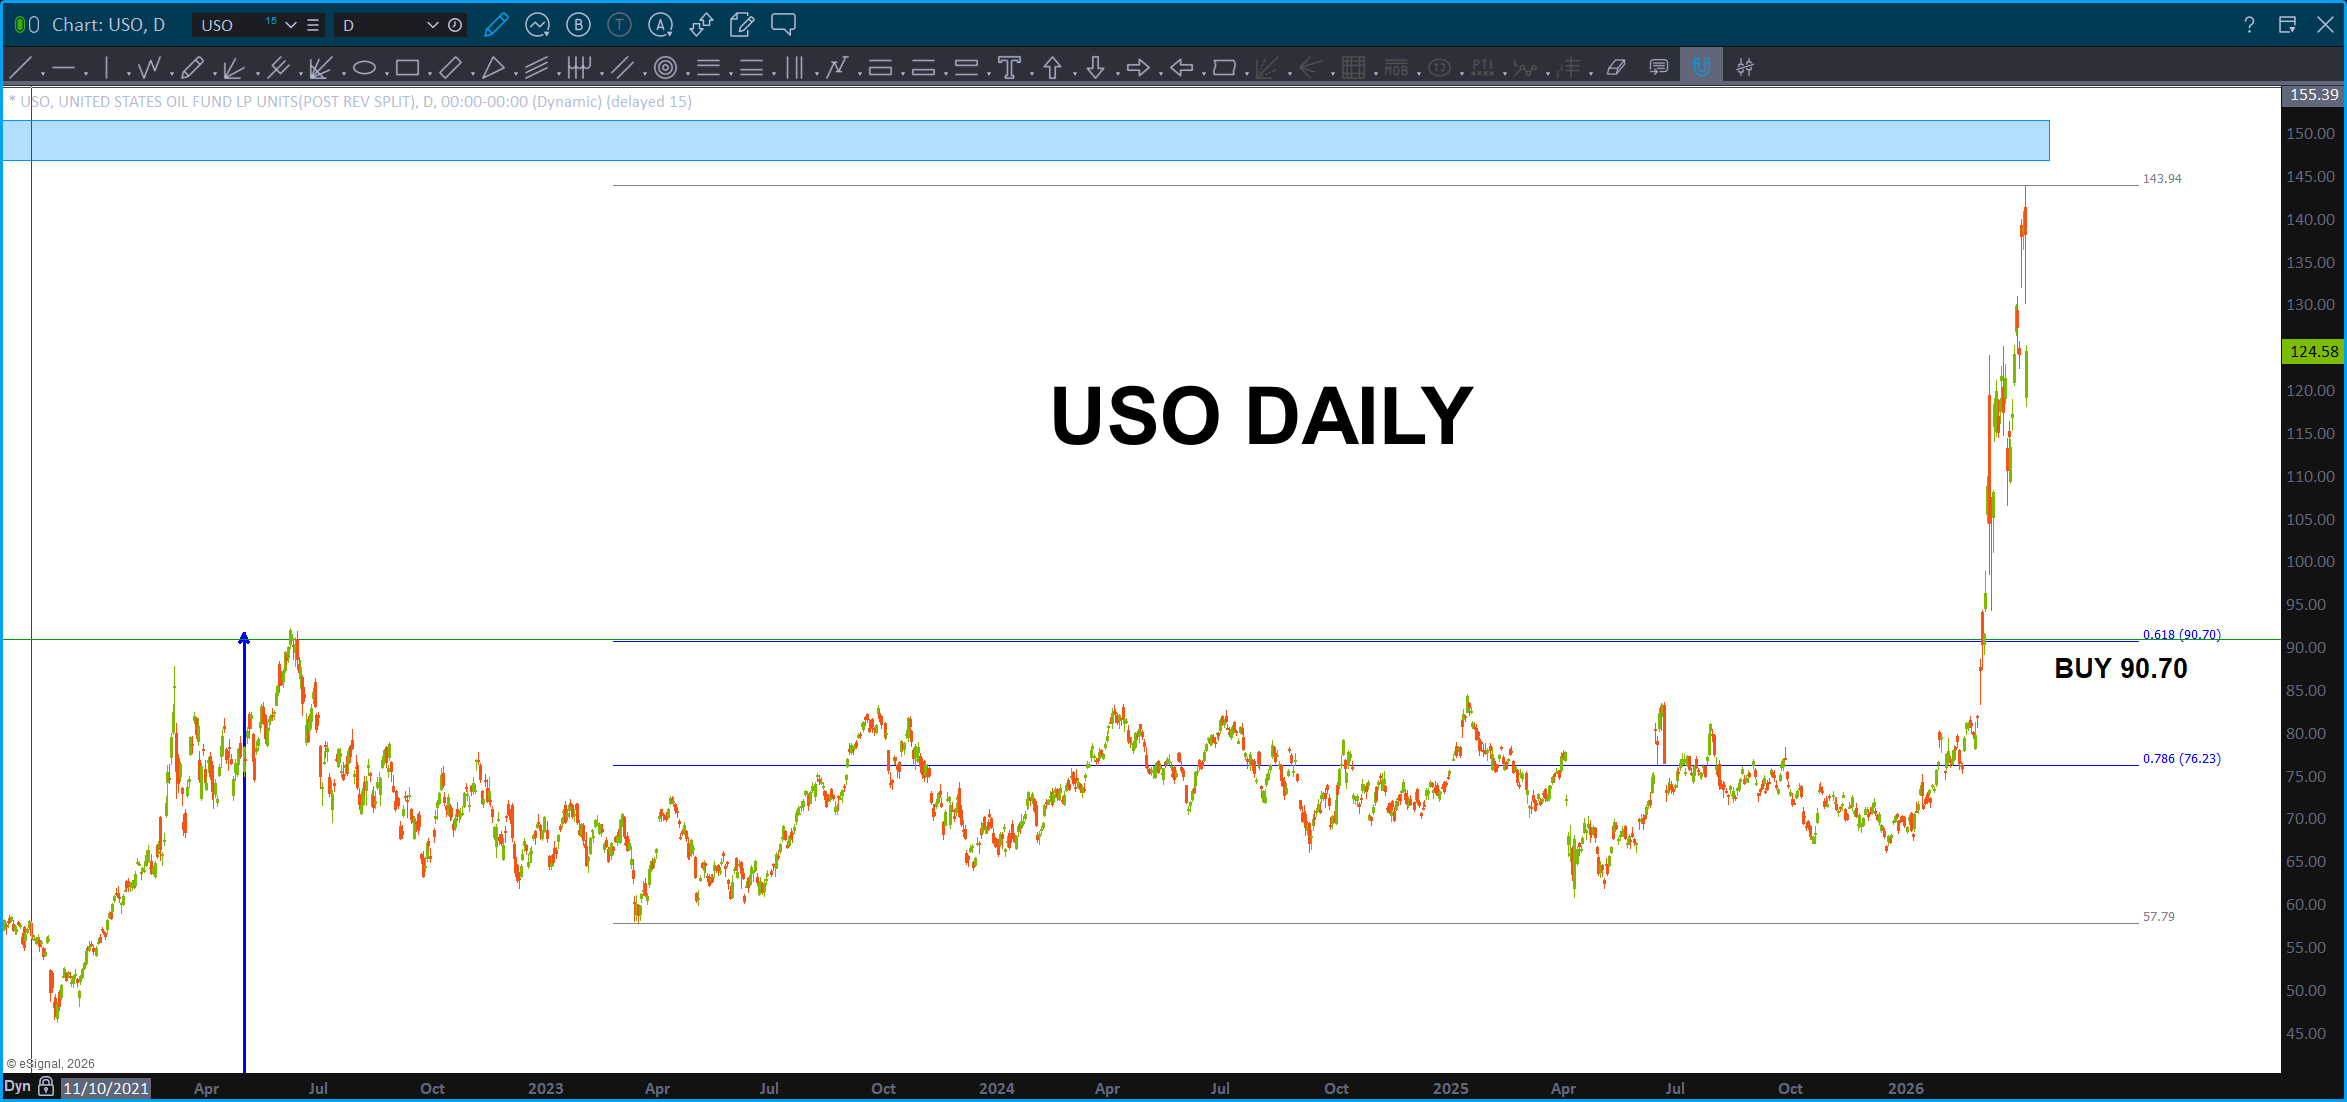
Either way, here’s a Crude Oil Chart posted on April 8th, 2026 looking for the BUY in/around 68-70.

Here’s the updated chart from today. Honestly, I totally missed this … when I heard they were bombing again I just went “shoot, I had posted on Crude months ago … wonder what level it bottomed?”

Folks, crude bottomed 5 days ago … went right to the attractor.
Crude: new highs ahead, stop out below the low 5 days ago if we reverse and blow thru to the downside. Look above and you will see the next level to BUY if this level does not hold.
Right now, there is a member of our Armed Forces in harms way, let’s never forget that …
Silver – June 10, 2026

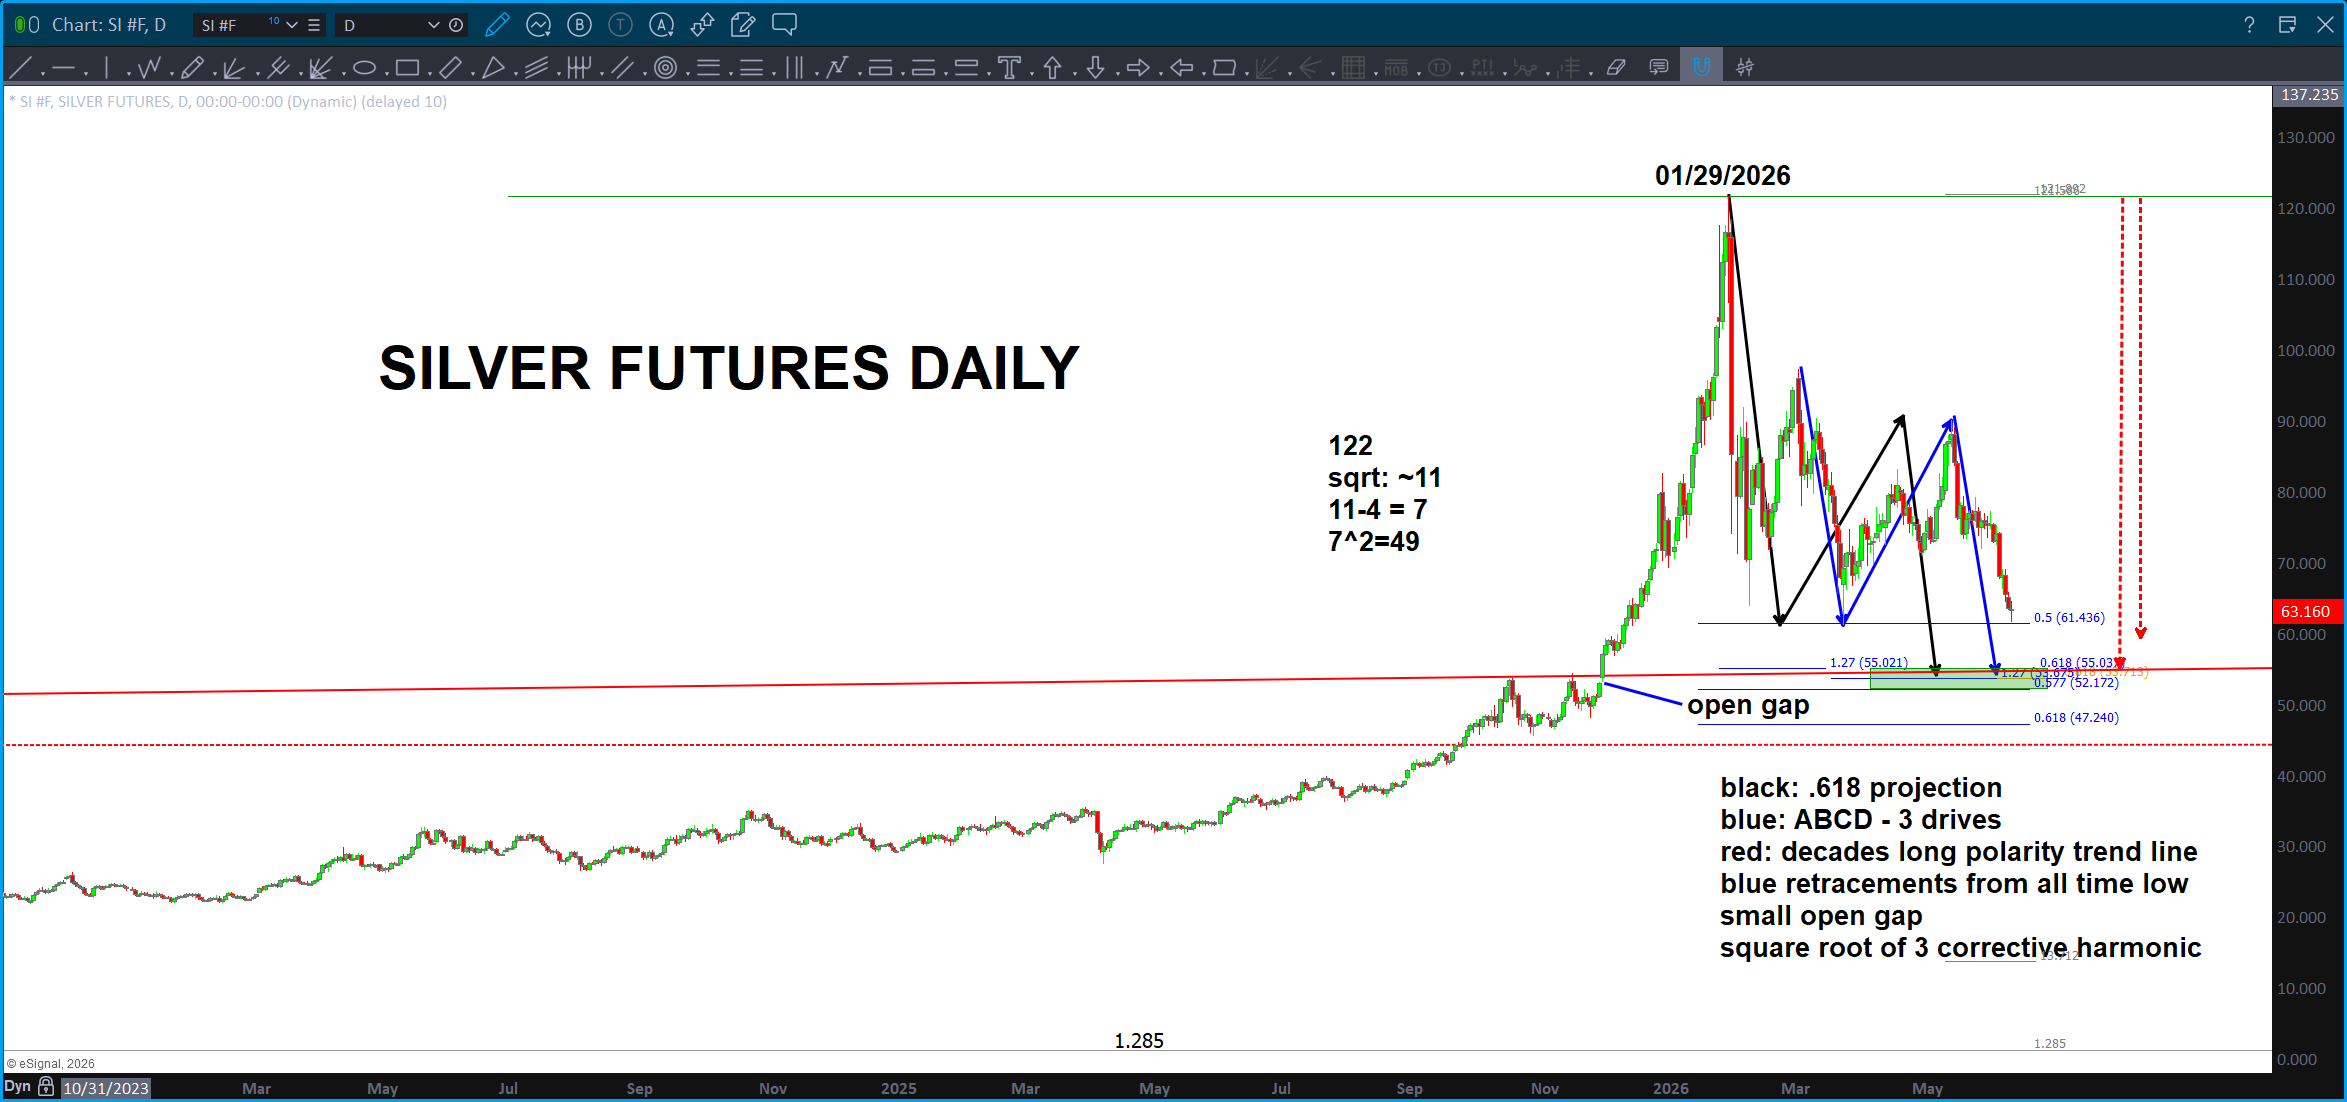
I will be working on some timing techniques over the coming days.
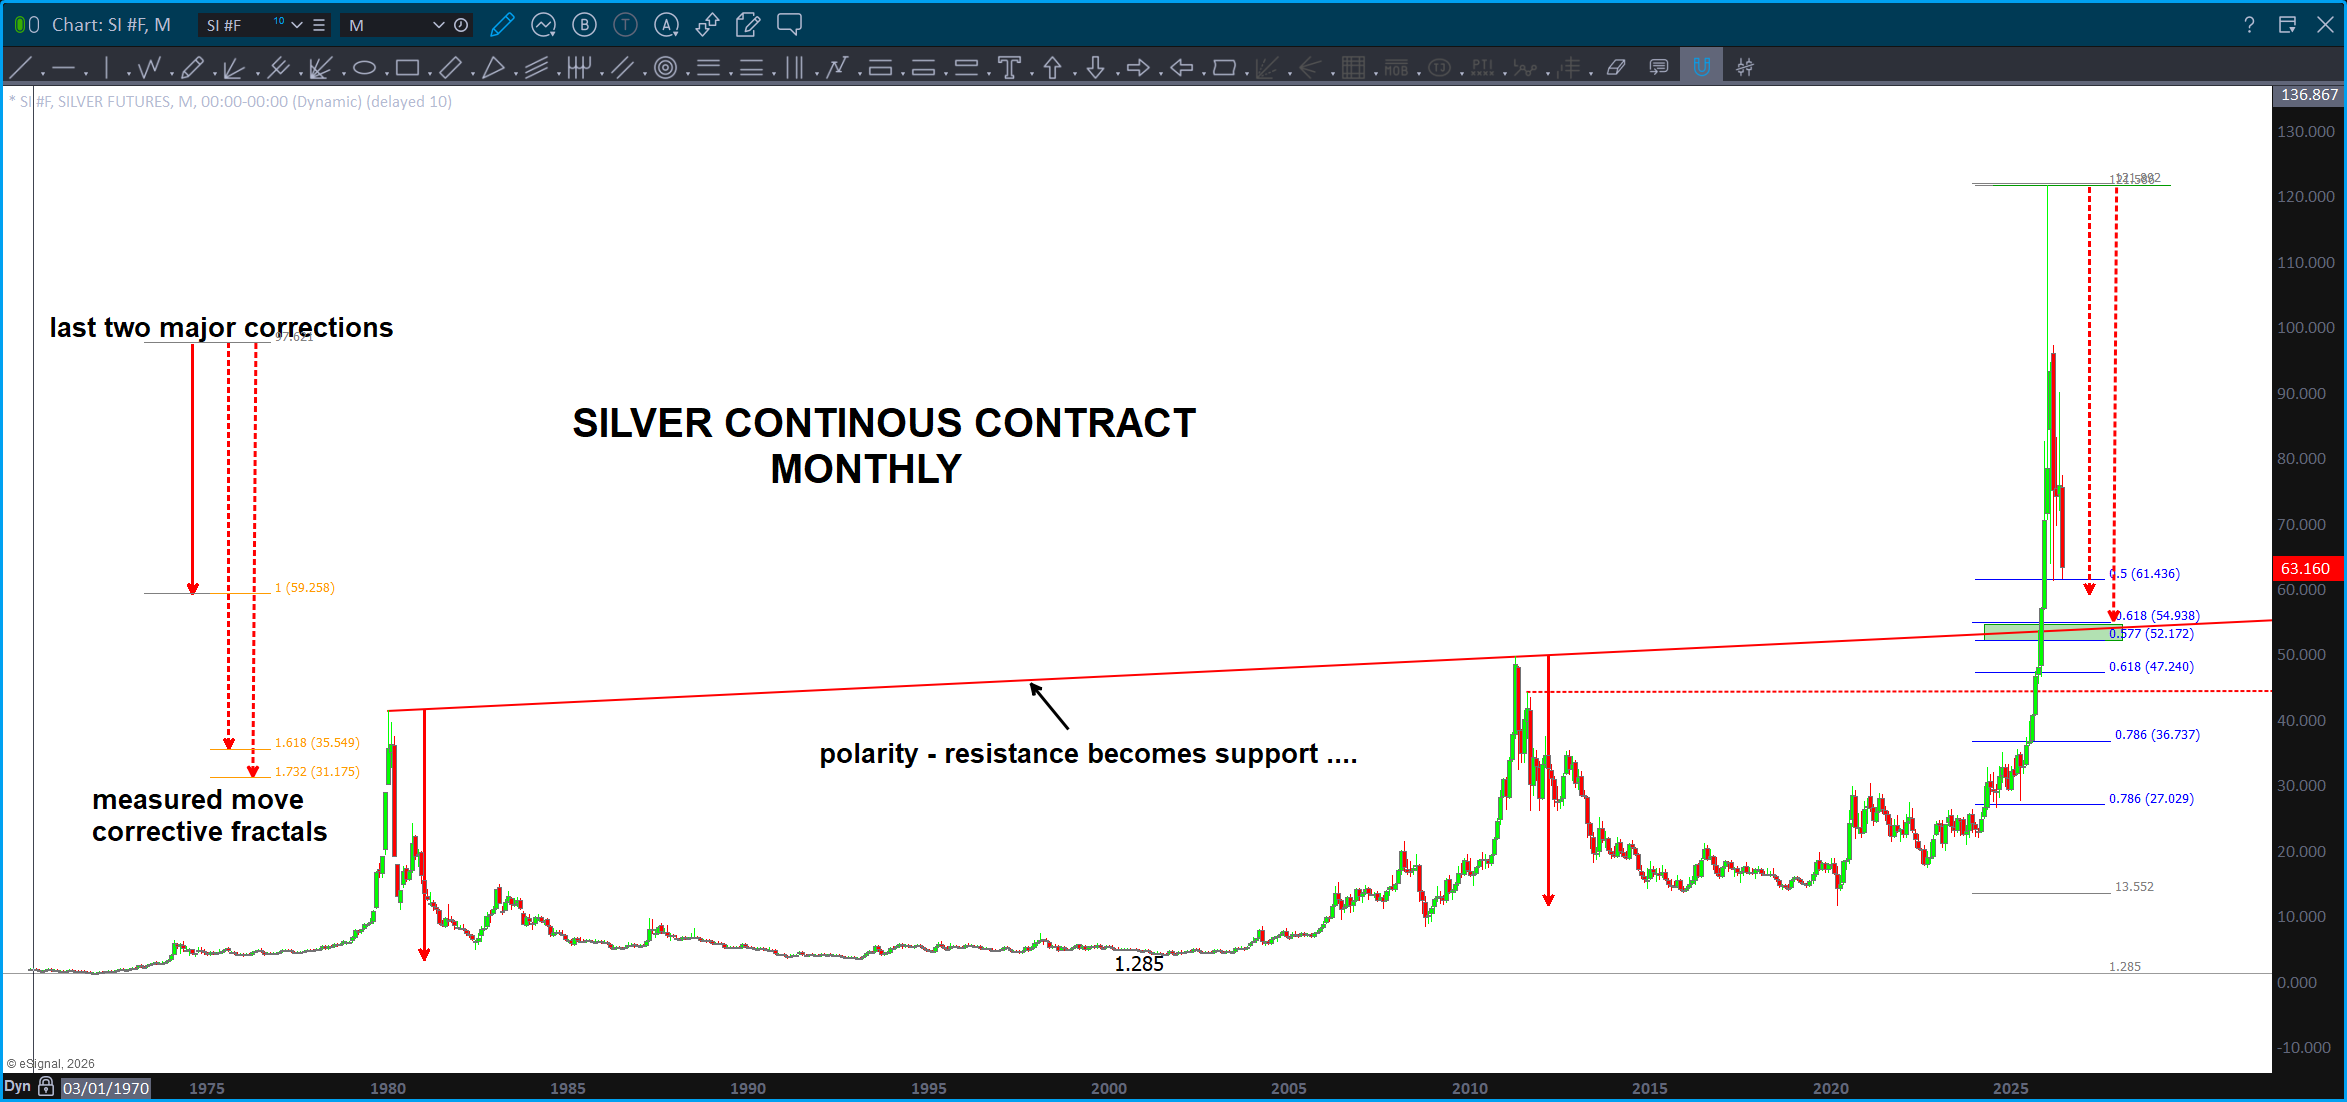
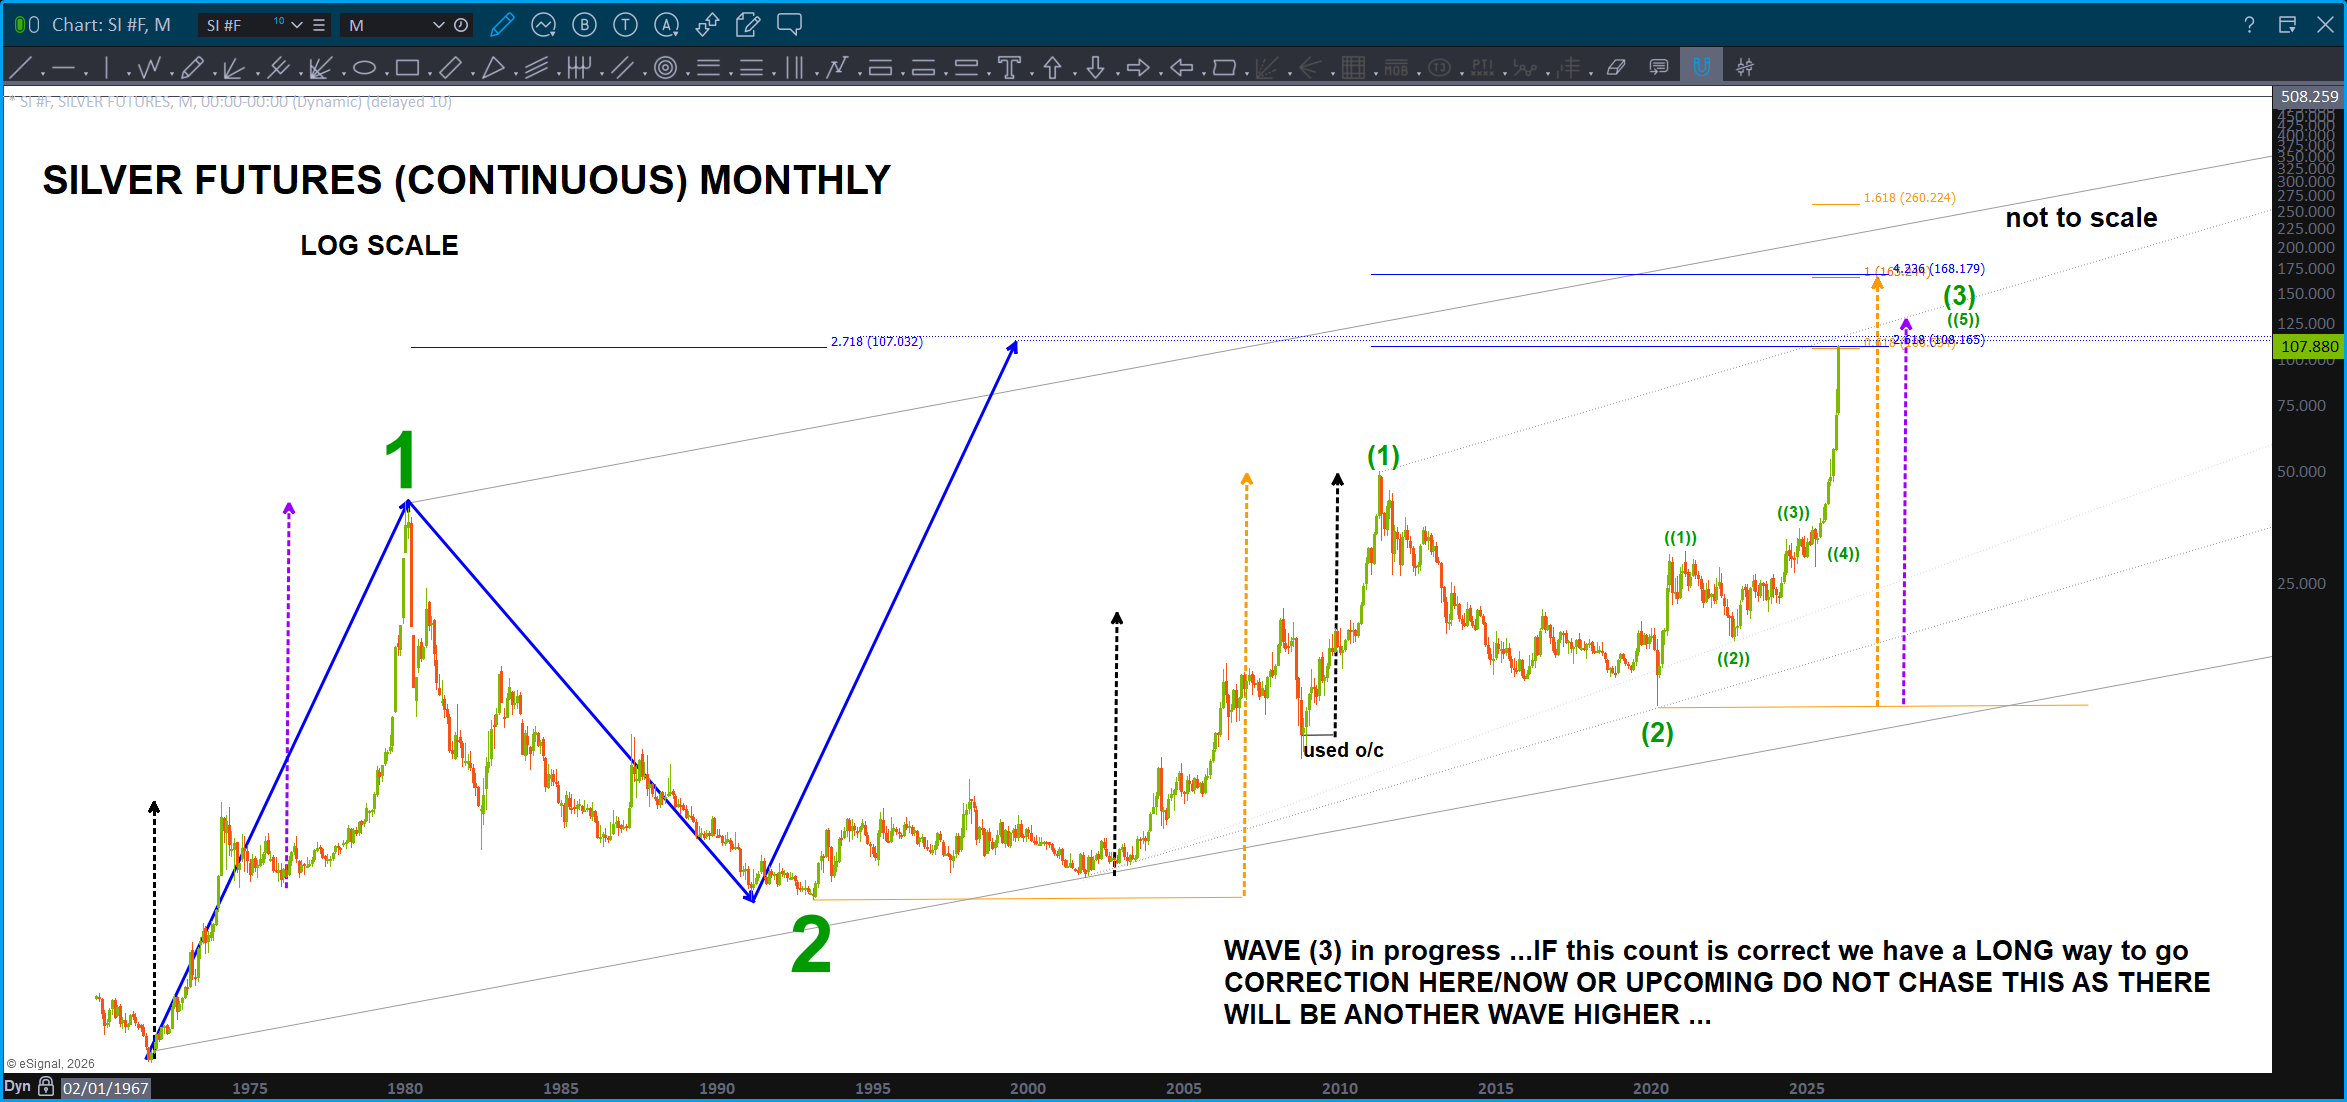
I think long term – in this case 45 years – polarity plays are worth taking a shot.
On top of the 45 year polarity trend line we have multiple retracement and extension levels along w/ a .618 price projection and the ‘blue’ ABCD three drives, all landing on the polarity line.
If you look a the monthly chart, you will see that the prior two major corrections were exact so, the probability of this current correction being harmonic to it is higher than usual. Take note, the 1.618 and 1.732 (square root of three) harmonics of the measured move land right on the polarity trend line.
If this analysis is correct, then Silver will go to new highs.
Happy hunting …

Memorial Day – May 25, 2026

Was it worth it?
Closing in on the 250th Anniversary of America, THE Constitutional Republic, I think this is a fair question to ask.
Was it worth it?
May 30, 1868 — the FIRST national observance General John Logan of the Grand Army of the Republic issued General Order No. 11 on March 3, 1868, calling for a national day of remembrance for Civil War dead. On that first official Decoration Day, roughly 5,000 people attended a memorial at Arlington National Cemetery to decorate the graves of more than 20,000 Union and Confederate soldiers. Children from the Soldiers’ and Sailors’ Orphan Home laid flowers, recited prayers, and sang hymns. This was 57, 698 days ago. The sun came up and went down … 57, 698 times and the beat went on.
Did the men and women who fought in America’s Civil War understand the nature of what they were creating?
Was it worth it?
To put General Logan’s ‘world’ into perspective, imagine transporting your world just 100 ish years back …
General Logan had never heard a recorded human voice. The phonograph didn’t exist yet. He’d never seen an electric light. He communicated with his troops via handwritten orders carried by horseback. The fastest he’d ever traveled in his life was probably about 60 mph on a train.
Was it worth it?
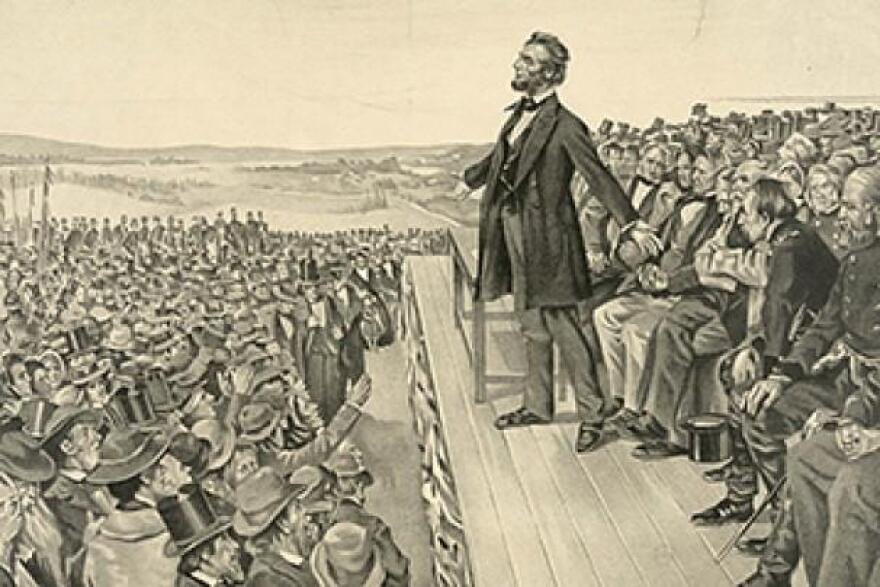
If you will, go w/ me to November 19, 1863
Eyewitnesses describe the scene:
“… The night before set the scene perfectly. Gettysburg was a lively place that Wednesday evening. Many visitors who thronged the streets were still seeking lodging. Military bands played patriotic music by torchlight, stirring the crowds. People slept on parlor floors, in churches, anywhere they could find space. Blogger
Then the morning arrived — and the weather cooperated in a way that felt almost symbolic. “It was one of those very few November days in our climate that are adapted for open-air audiences and open-air speakers,” wrote eyewitness Henry Eyster Jacobs. “The sun shone brightly: the air was almost balmy.” Blogger
At 9:30 a.m., Lincoln, riding a brown horse, joined the townspeople and widows marching out to the grounds. About 15,000 people attended the ceremony, including the governors of six Union states. Wikipedia
Then one of the most remarkable eyewitness accounts comes from a 19-year-old schoolgirl named Sallie Cook, who shook Lincoln’s hand that morning in David Wills’s parlor. She sat close to the platform and later recalled: “I heard all of the Address, but it seemed short. Then there was an impressive silence like our Menallen Friends Meeting.
There was no applause when he stopped speaking.” Abraham Lincoln’s Law Offices
That detail — no applause — is extraordinary. The crowd was so stunned, so overwhelmed, they simply went silent. Lincoln reportedly sat down thinking he had failed.”
My wonderful friend, boat school roommate and patriot (progressing SUP surfer) sent me this article which I read yesterday:

https://jameshatch67.substack.com/p/what-american-leaders-can-learn-from
Take the time to read it …because then you will understand or perhaps ‘feel’ the nature of the weight on his shoulders as days before 51,000 Union and Confederate Soldiers had perished. Let that sink in … doing some research, multiple accounts exist that they were STILL burying bodies close to the stage as Lincoln rose to speak. I can imagine it probably didn’t smell like roses, if you get my drift. It was an ugly depiction and objective example of the world of polarity in which we live …where there is PEACE there is VIOLENCE. Sorry folks, that’s just the way it is.

I believe he knew it – to his bones. Why?
I’ve only attended two Change of Command Ceremonies since departing the Navy. One was for the individual who dropped me a quick text yesterday for the article above on leadership and the decisions made by leaders and the effect of those decisions. The other was for another friend who, no doubt, weighed the same feelings that my friend had. At that Change of Command, my friend took the podium, moved it so he could stare directly into his men’s eyes and tell them, without saying a word, “I know the gravity of my decisions and I know you have given it all for our Republic.”
Almost as if they were Templars from a different time, conducting a mission for our Republic, yes, but something far deeper that they cannot comprehend. They will, as many of us will. (Yes, that’s foreshadowing)
You bet your ass Lincoln knew … I cannot imagine the gravity of the moment. This was the pivot for America … a land prophesy foretold was to be “the New Atlantis.” Did they know then? Who knows? Probably not.
In hindsight:
“… They thought they were fighting for the Union. And they were — but perhaps the Union was always something larger than maps and constitutions, larger even than the men who wrote it into being. Francis Bacon dreamed of a New Atlantis three centuries before the first shot was fired at Fort Sumter — a society built not on the accidents of birth and blood but on reason, knowledge, and the radical proposition that human beings could govern themselves toward something approaching wisdom. The men who fell at Gettysburg did not know Bacon’s name. They did not know they were soldiers in a story that began long before 1861 and would not end in 1865. But the experiment they bled to preserve — this strange, arguing, imperfect, luminous Republic — was always the carrying vessel for something the world had not yet seen completed. The Union had to survive not merely as a nation, but as a proof. A demonstration to history that the dream was possible. And now, standing at the far edge of everything those men could not have imagined — in a world of instantaneous light and artificial thought and voices carried across oceans in a breath — we approach the moment Bacon glimpsed from his window in another century: not the perfection of government, but the perfection of human potential itself. Gettysburg was not the end of anything. It was the price paid to keep the door open long enough for us to walk through it…”
Why did this speech … all 22 minutes and 272 words have such an amazingly powerful resonance?
Does anyone else remember any speeches that President Lincoln gave …
What, possibly, could be going on here?
Watch this episode … the Gettysburg Address was DIVINELY guided. THAT is why, at this point in time in the history of our YOUNG Republic, the ‘TRUE AUTHOR’, the “ARCHITECT” of this amazing gift of life, intervened a bit and encrypted, ‘for those w/ eyes to see’, a message that this American experiment, IS divinely guided. (Folks, she created the Heavens and the Earth, correct?)
Could the Gettysburg Address be so powerful because, subconsciously, the Architect (s) of this amazing matrix of consciousness was actually speaking ‘thru’ President Lincoln? In the immortal words of the Big Lebowski “well … that’s just your opinion man.”
WATCH THE VIDEO … (note, the video is 2:27:27 (22 minutes long, 272 words ;))
Was it worth it?
Now that we are back from our time machine trip back to the very beginnings of our Republic, can we answer if the 50,000+ who ‘died’ at Gettysburg ‘died’ in vain?
Was it worth it?
As we approached the election between Vice President Harris and President Trump, I remember, vividly, my disgust w/ the entire process. The debt, charades in Congress, endless wars, corruption, conspiracy theorists, COVID-19, etc. etc. Back then, I would have answered “no, it was not worth it.”
But, folks, in the man who personifies the next President of the United States (maybe?):

“PING” went the audio alerting me to an email in my inbox …
Over the coming weeks, I received 22 videos showing that our founding documents contain ETERNAL TRUTH.
The Declaration of Independence has ETERNAL TRUTH encoded w/in it … the secrets to our very nature of reality. As you continue to seek truth in the age of Disclosure, look no further than this document. On the surface and beneath, it’s a portal to the divine.
Yes, I said that, because over the past year or so, I dove head first into the Codes and their meaning for all of us – and that’s the big ALL (8.5 billion of us) – and the nature of our reality. It’s perfect folks …

Alan will be publishing THE AMERICA CODES in just a few weeks … if you want to prepare and understand what’s coming and what’s happening now …read the book.
I PROMISE, by the end of the book, you will (like me) emphatically be able to state:
YES, IT WAS AND STILL IS SO WORTH IT …
The pyramid still speaks in silence
We listen
Bacon saw it coming
The fallen made us
Thank you
Your blood seals the American covenant

BONDS – May 19, 2026
We have been in a consolidating, long term, 3 year triangle in the 30 year bond. Being in a triangle is like being in the ring, as an amateur, w/ a professional UFC fighter. Prices going up … no. Prices going down …no. So, based on this post, from 3 years ago, I had no idea that we would coil. Well we did and now we have broken out:
Here’s what I believe is going on:
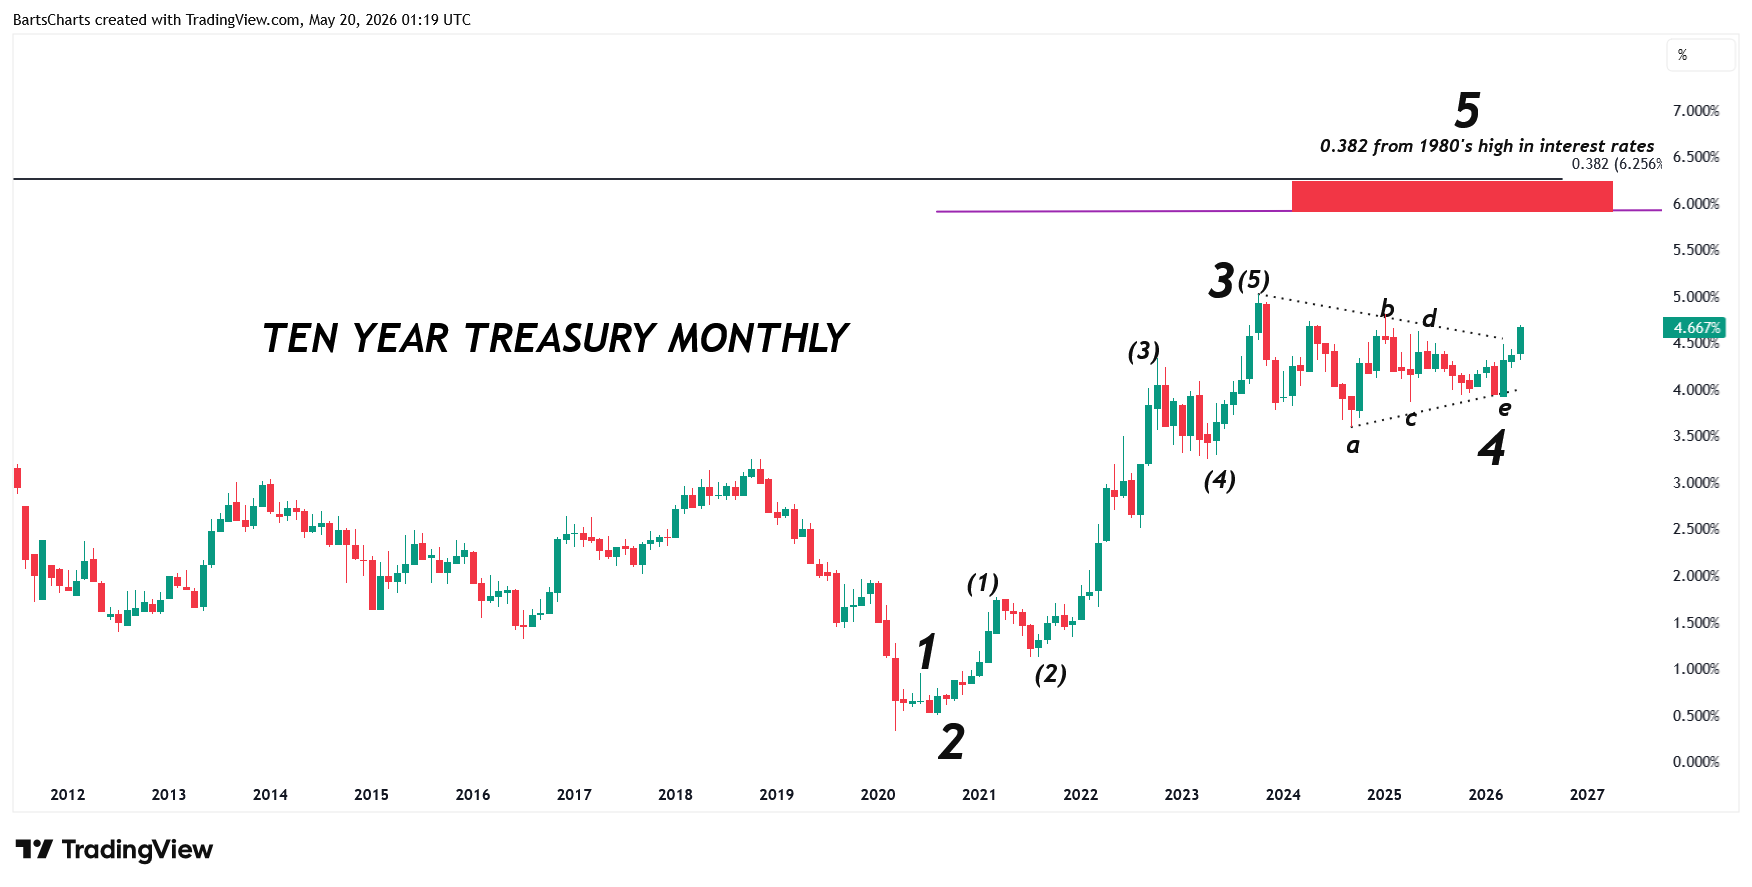
That’s a target of 6-6.5 on the ten year. Hello servicing trillions of dollar of debt
Simultaneously, we are watching this attractor that we ID’d 3 year ago:
So, what are we looking for … 5 waves UP on the 10 year interest rate and then, simultaneously, check in w/ the 30 year support level ID’d.
As for timing … well, guess we’ll have to ask AI about a BIG planet that starts w/ a U. Bonds REALLY do track to it … ever wonder why the trends in bonds last so long …? BIG planet, far away causes BIG long moves. See how it works?
The noise is loud and this is a BIG deal as each 1/2 percentage point in rates really hurts emerging markets and other rate sensitive countries.
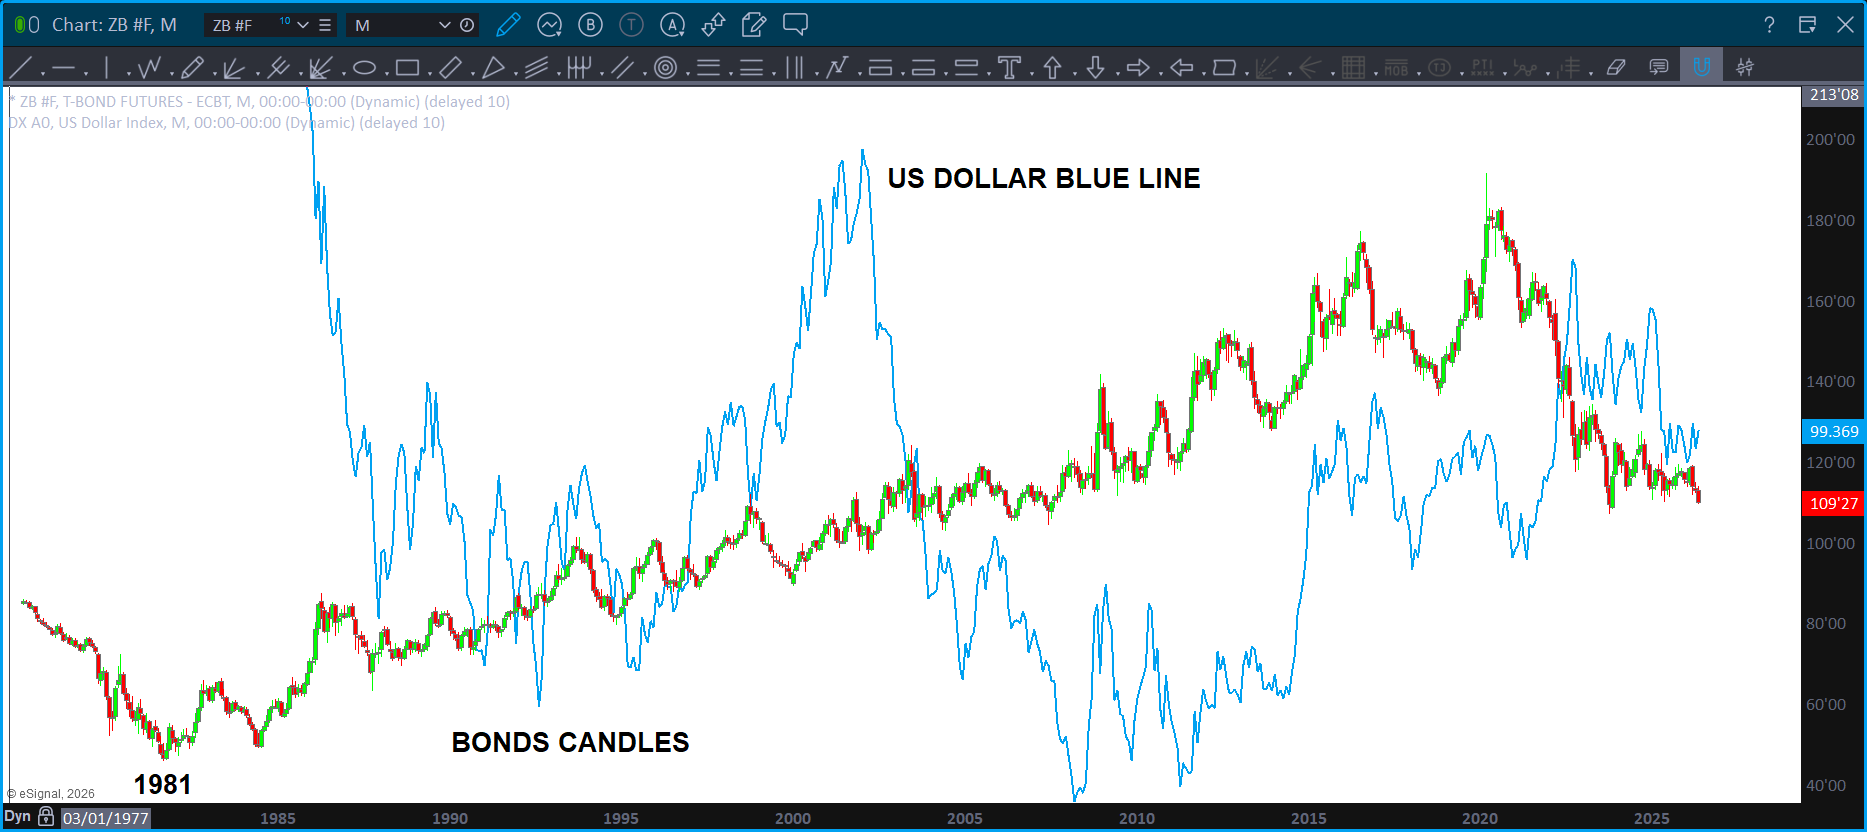
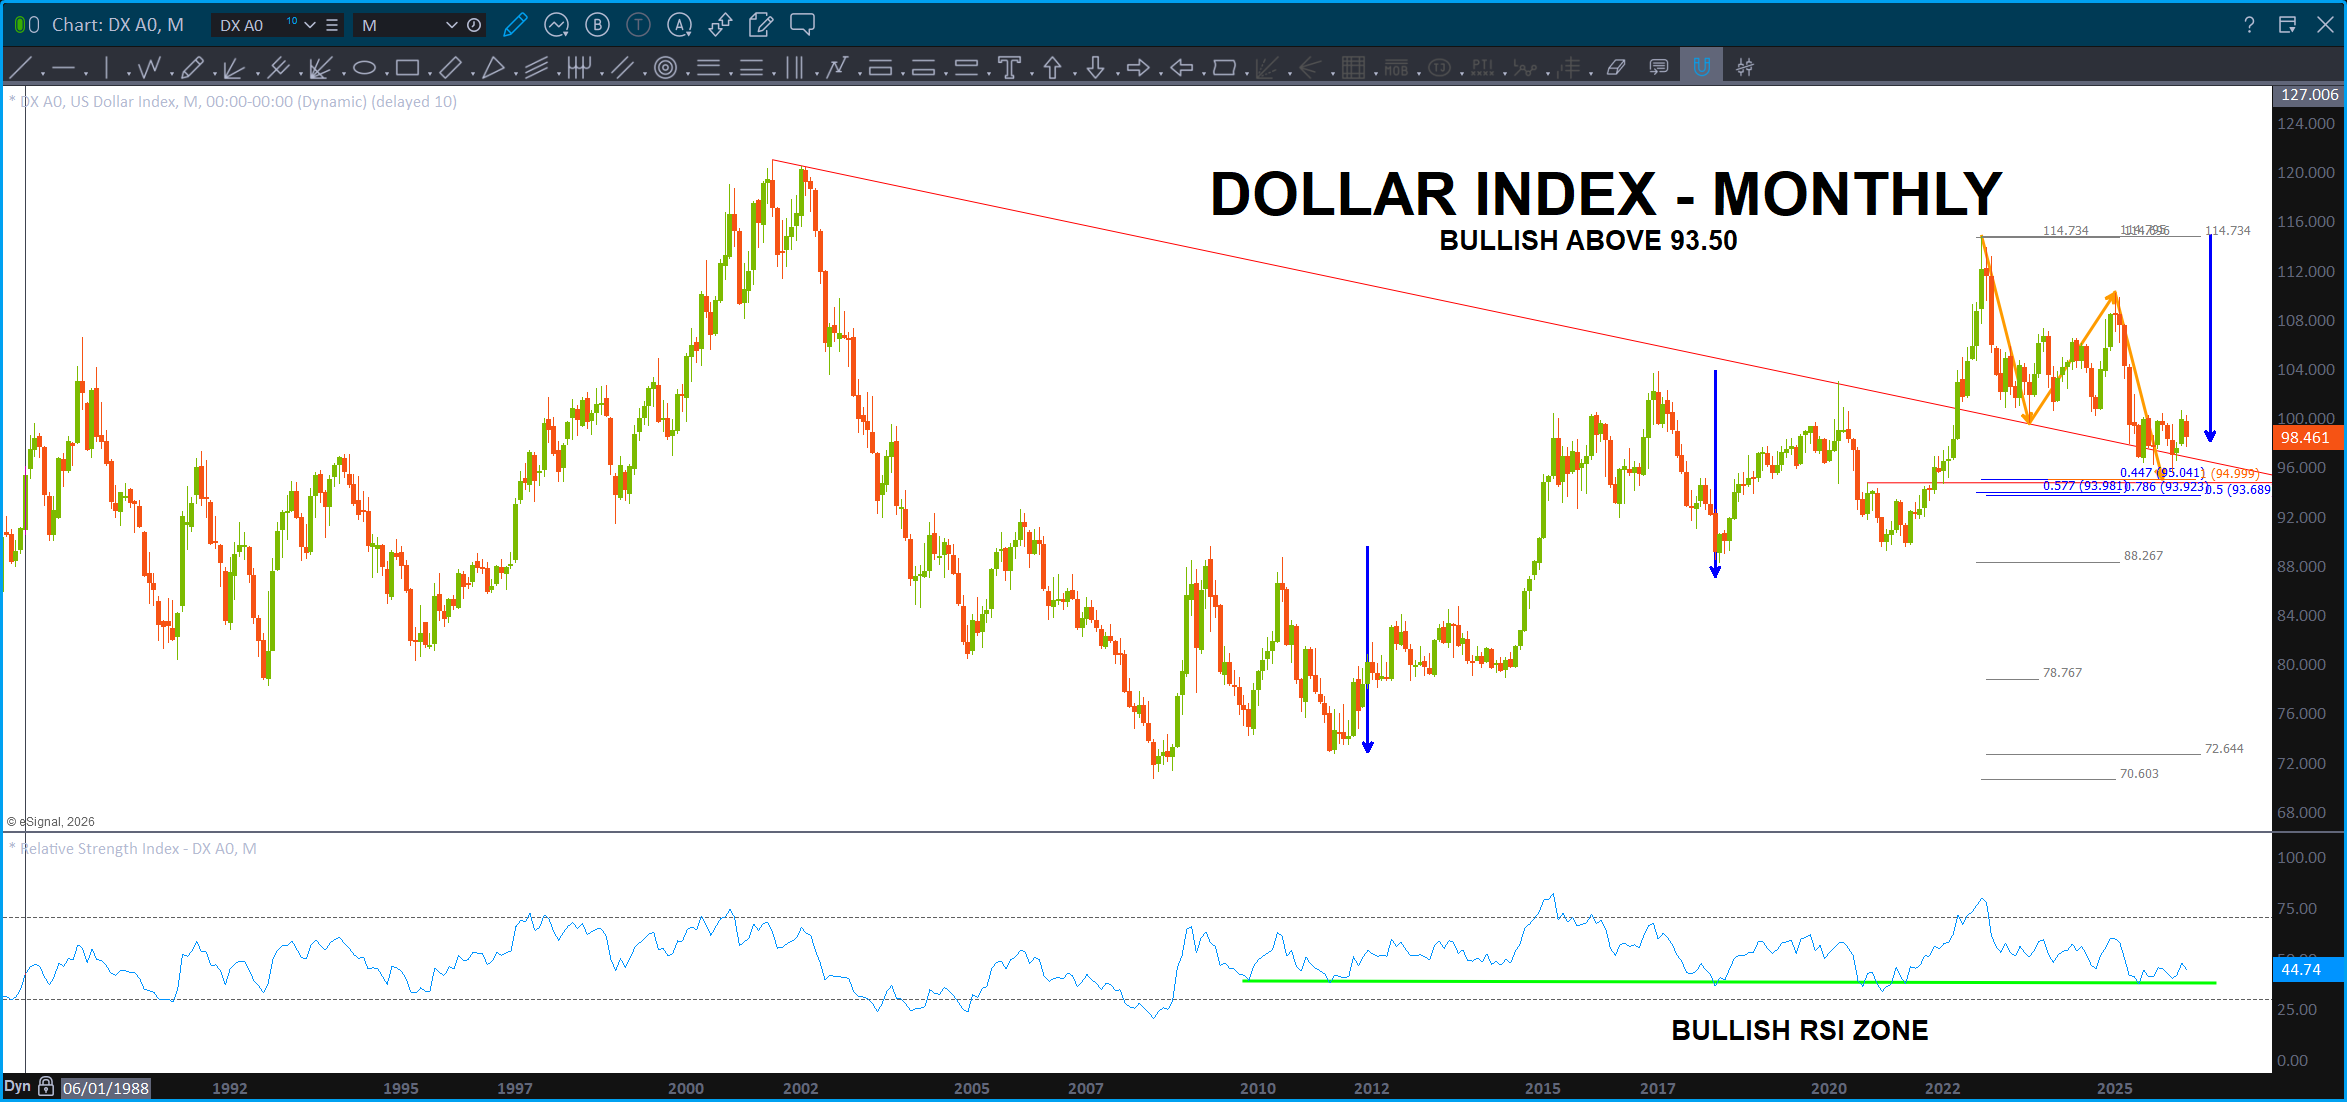
Note, believe we have a dollar low in place … the dollar and bonds ‘can’ go up together as shown.
I have been long TBT for years … I’ll cut it and flip to TLT once we get up a little higher in rates and take a peak at the patterns.
ONE LAST: it’s just a pattern. Yes, I like my count and believe this is a 5th wave – however – this level could fail and then, watch out as something ain’t right at the circle K.

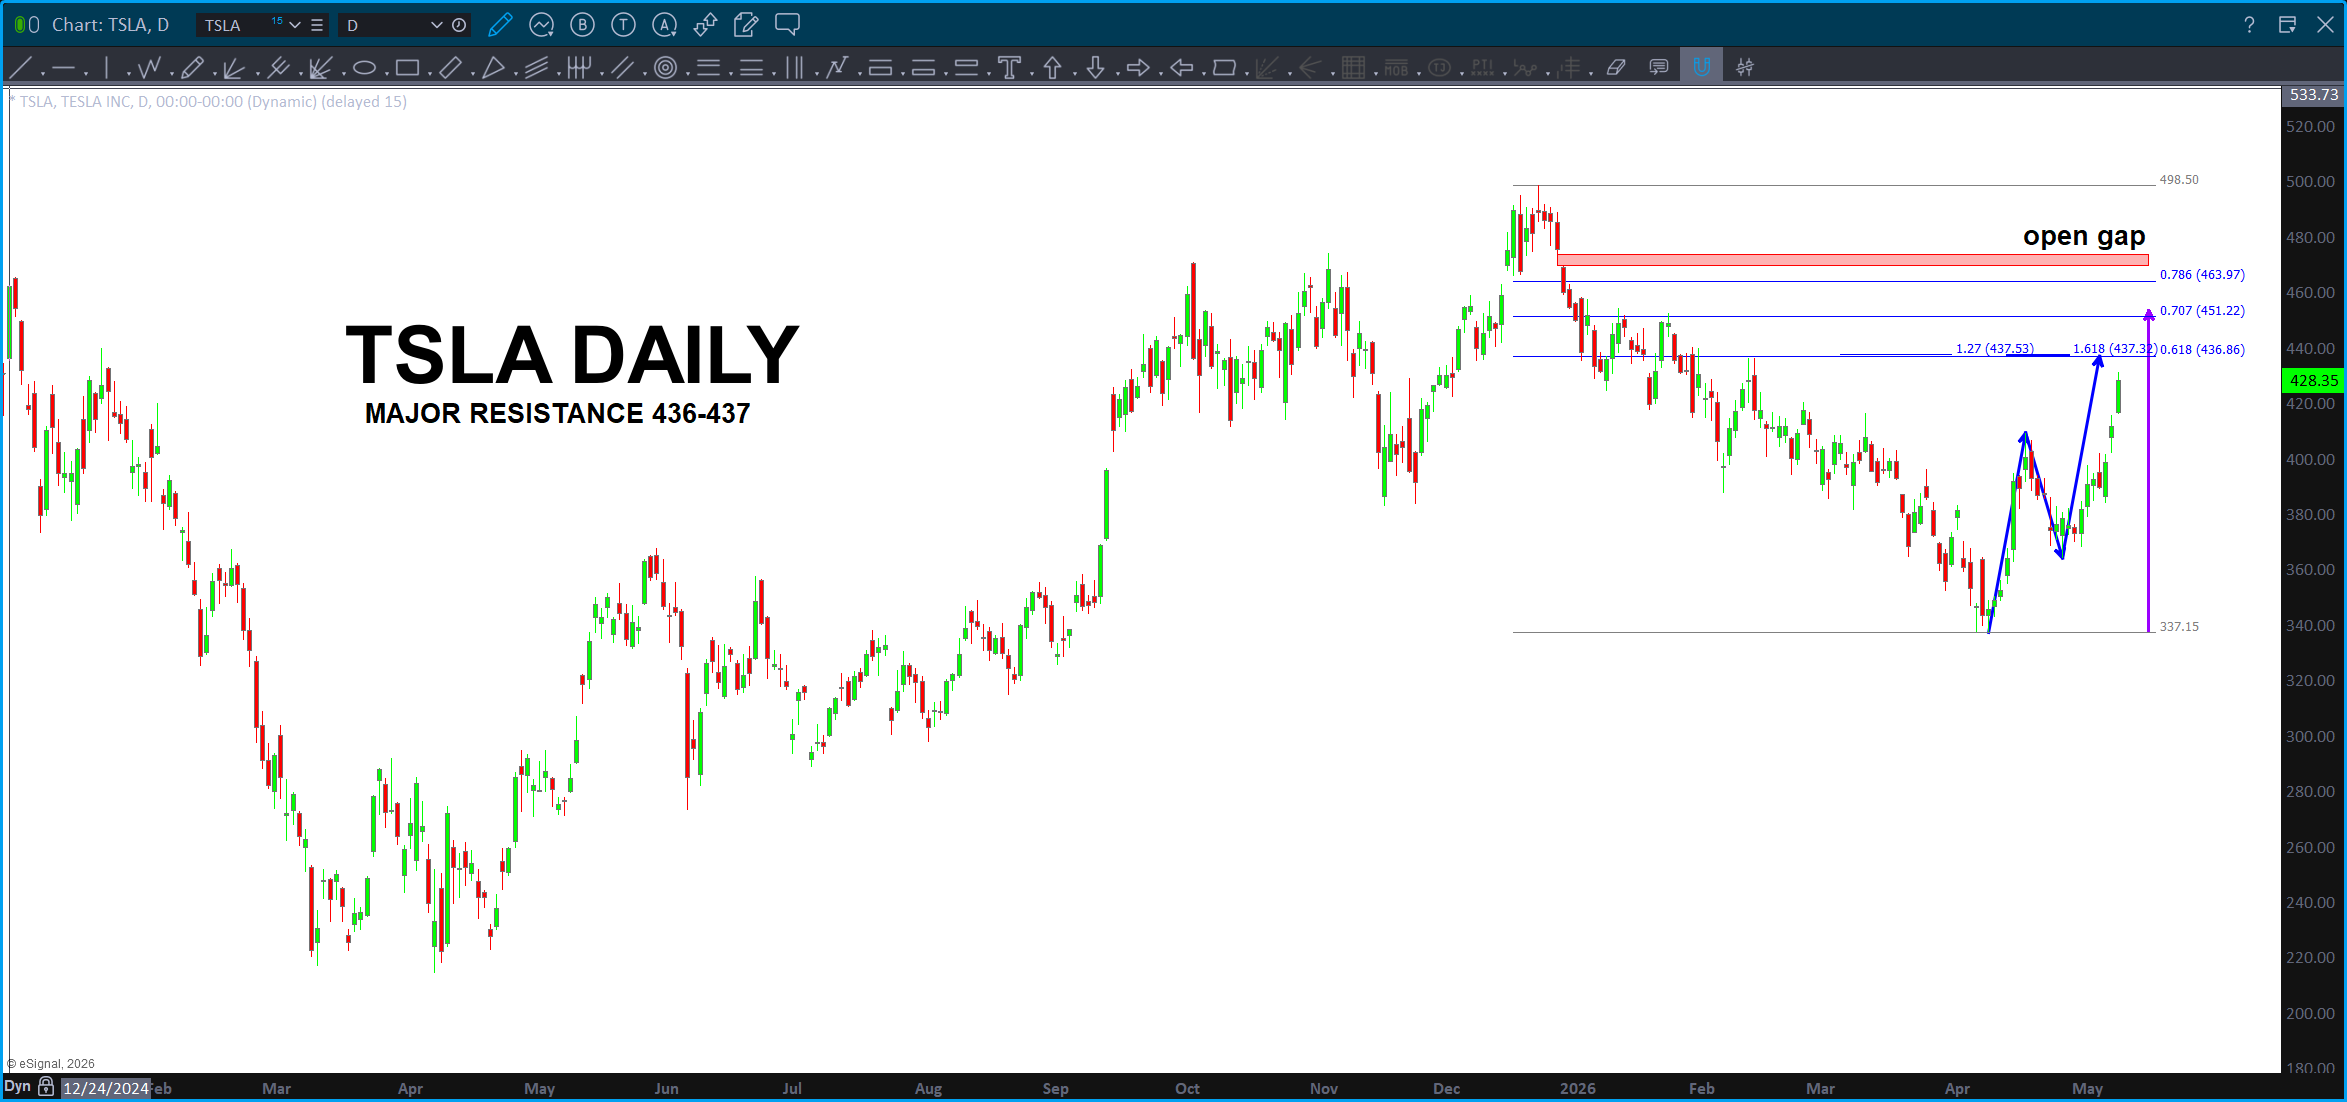
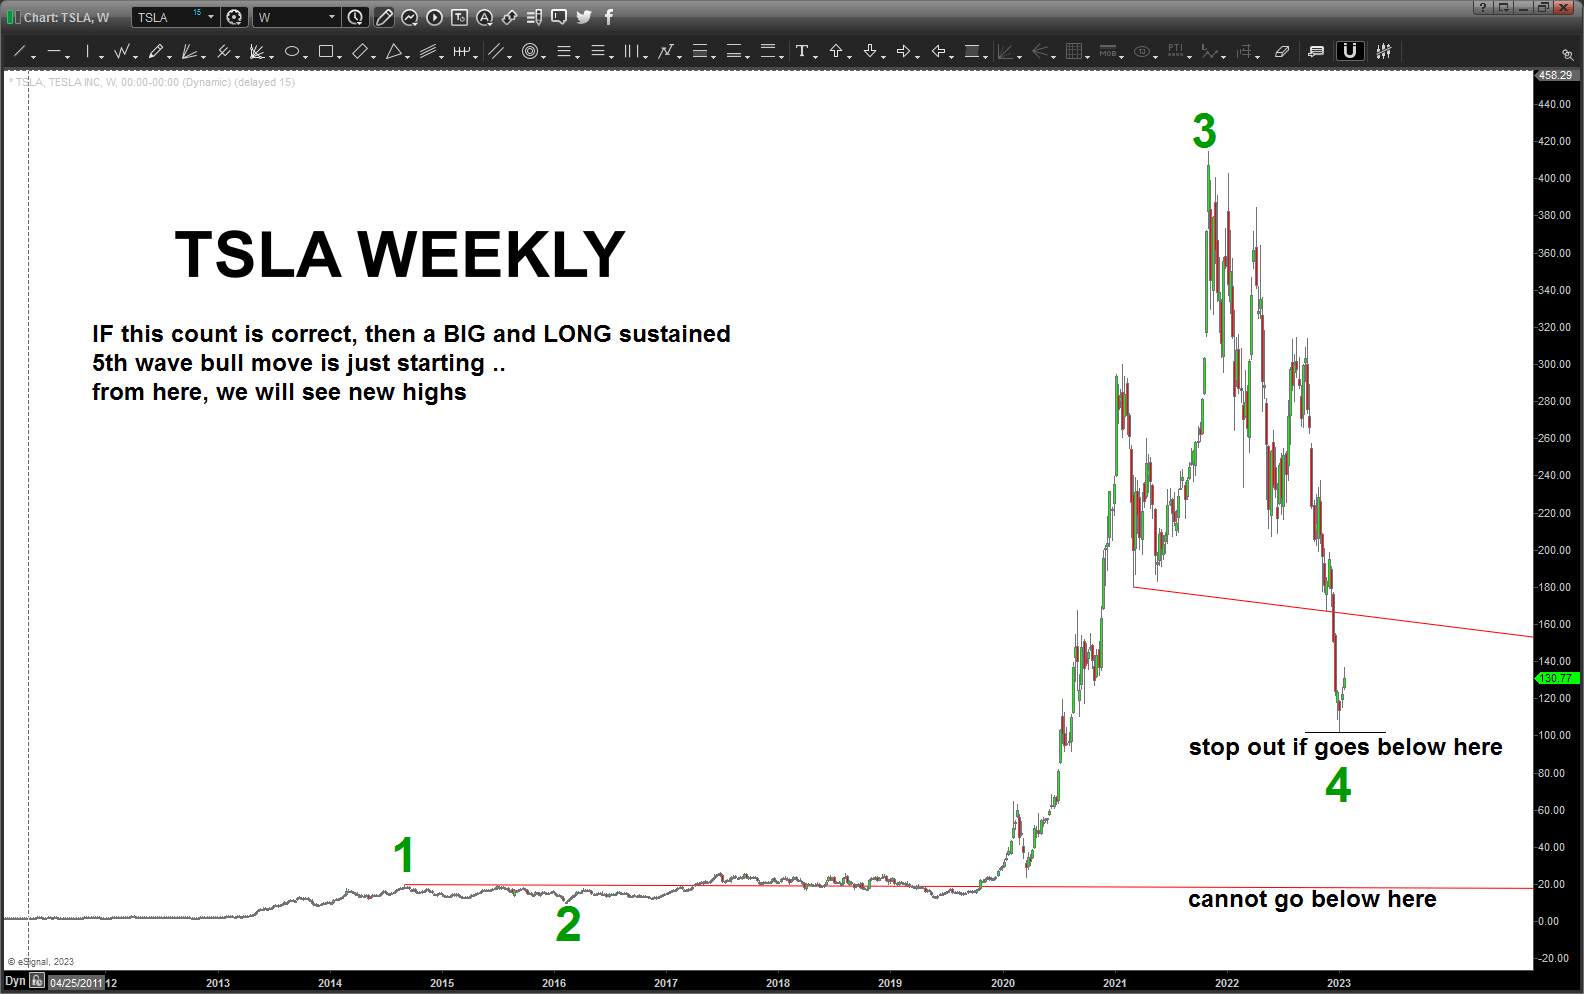
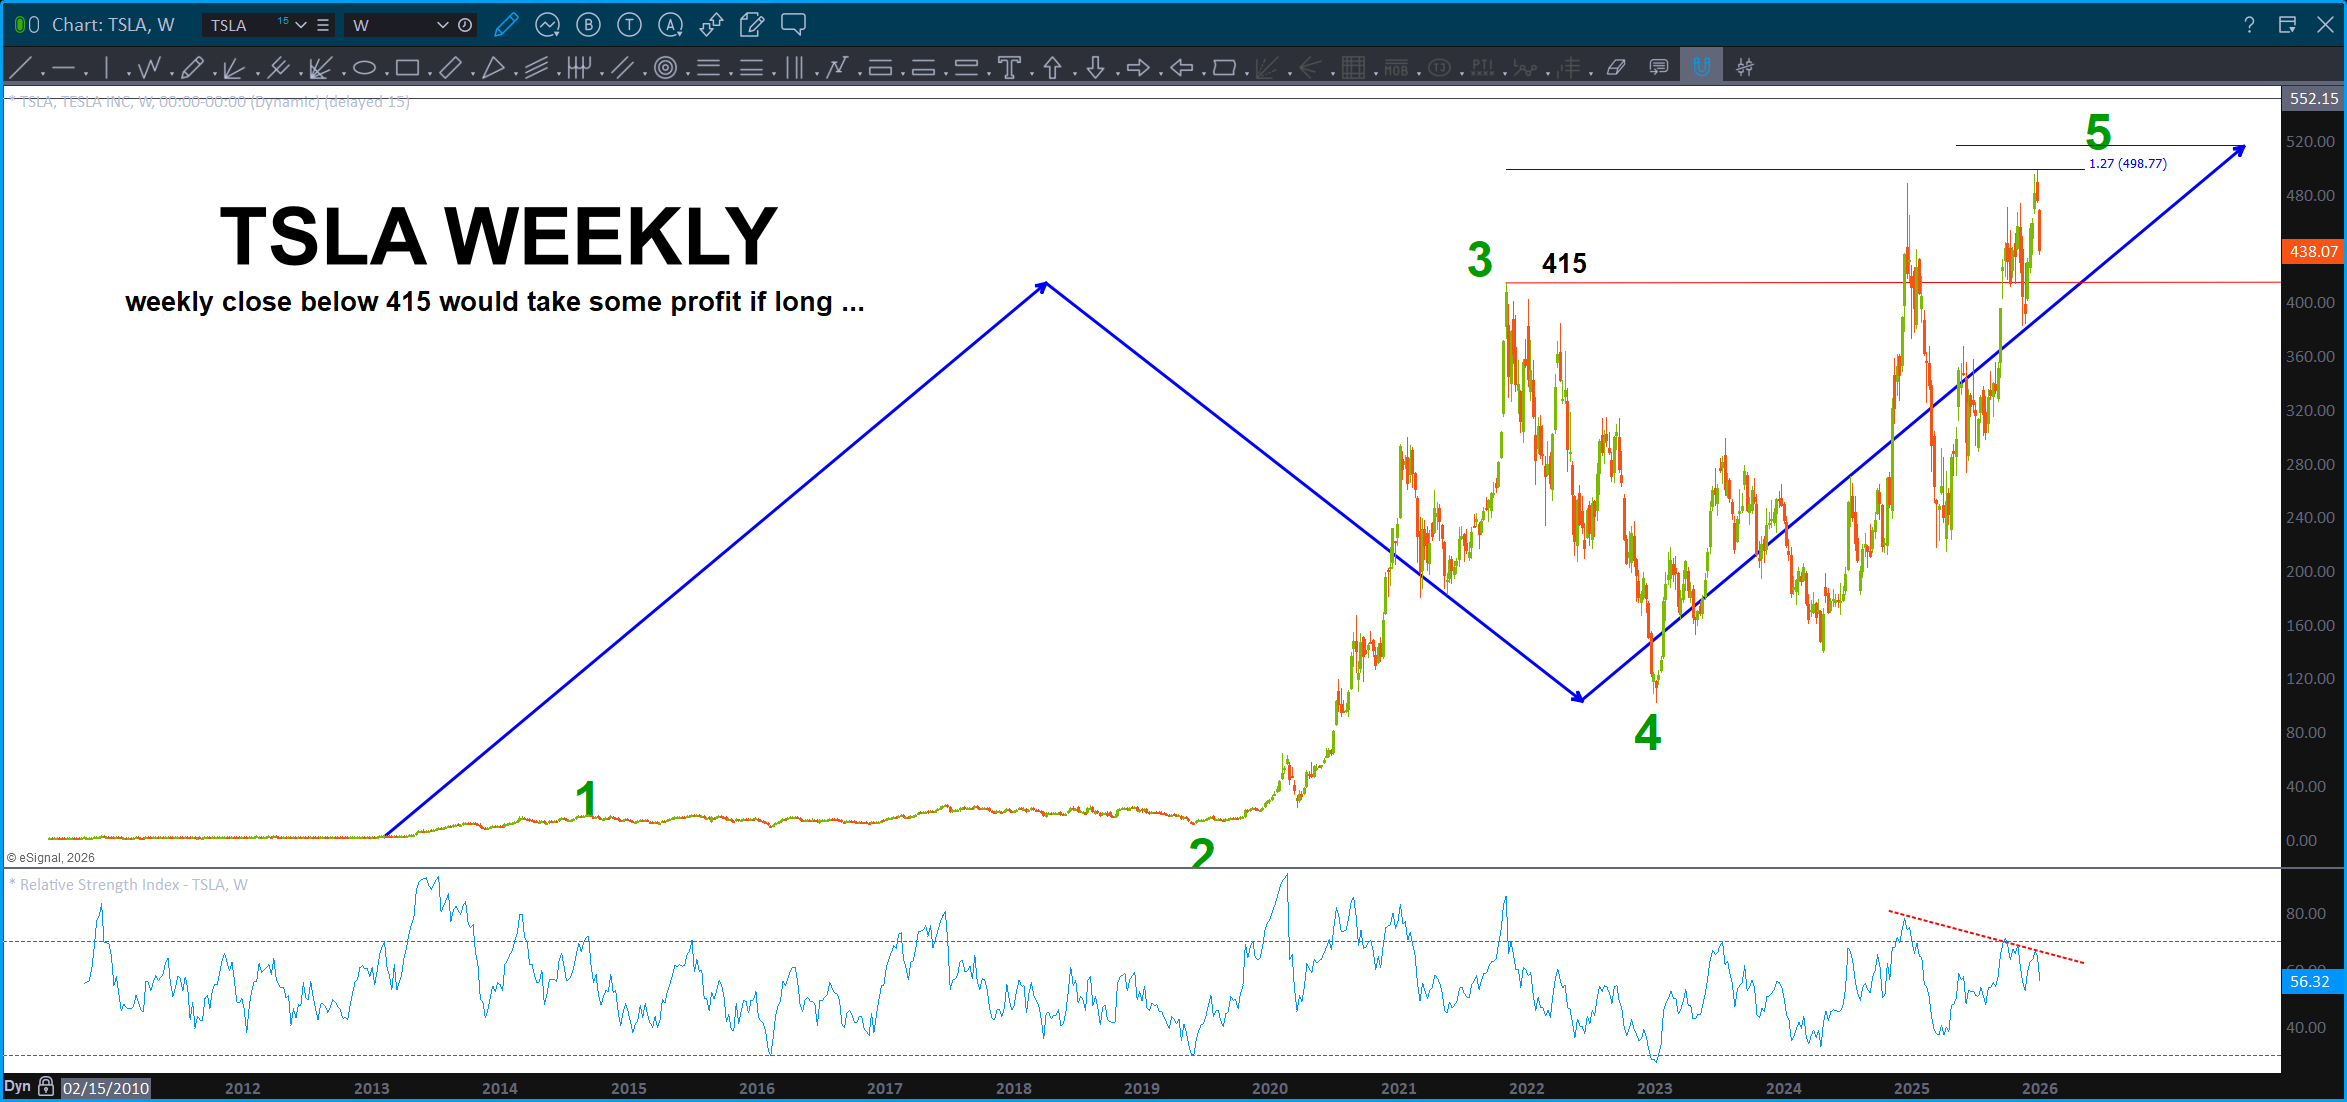
TSLA – May 11, 2026

TSLA certainly looks like it wants to attack one more high THEN we need to start being very careful w/ TSLA as I can see 5 waves up.
Also, the most recent all time high, just doesn’t look and feel like that was a top … believe we have one more wave higher.
That being said, if the NASDAQ starts selling off, seems that TSLA will do the same.
Crucial week … either way, the SELL PATTERN on TSLA is approaching a little higher. A PERFECT overlaps of the ABCD projection, .618 retrace and 1.618 BC extension land right on top of each other. SHOULD BE RESISTANCE.
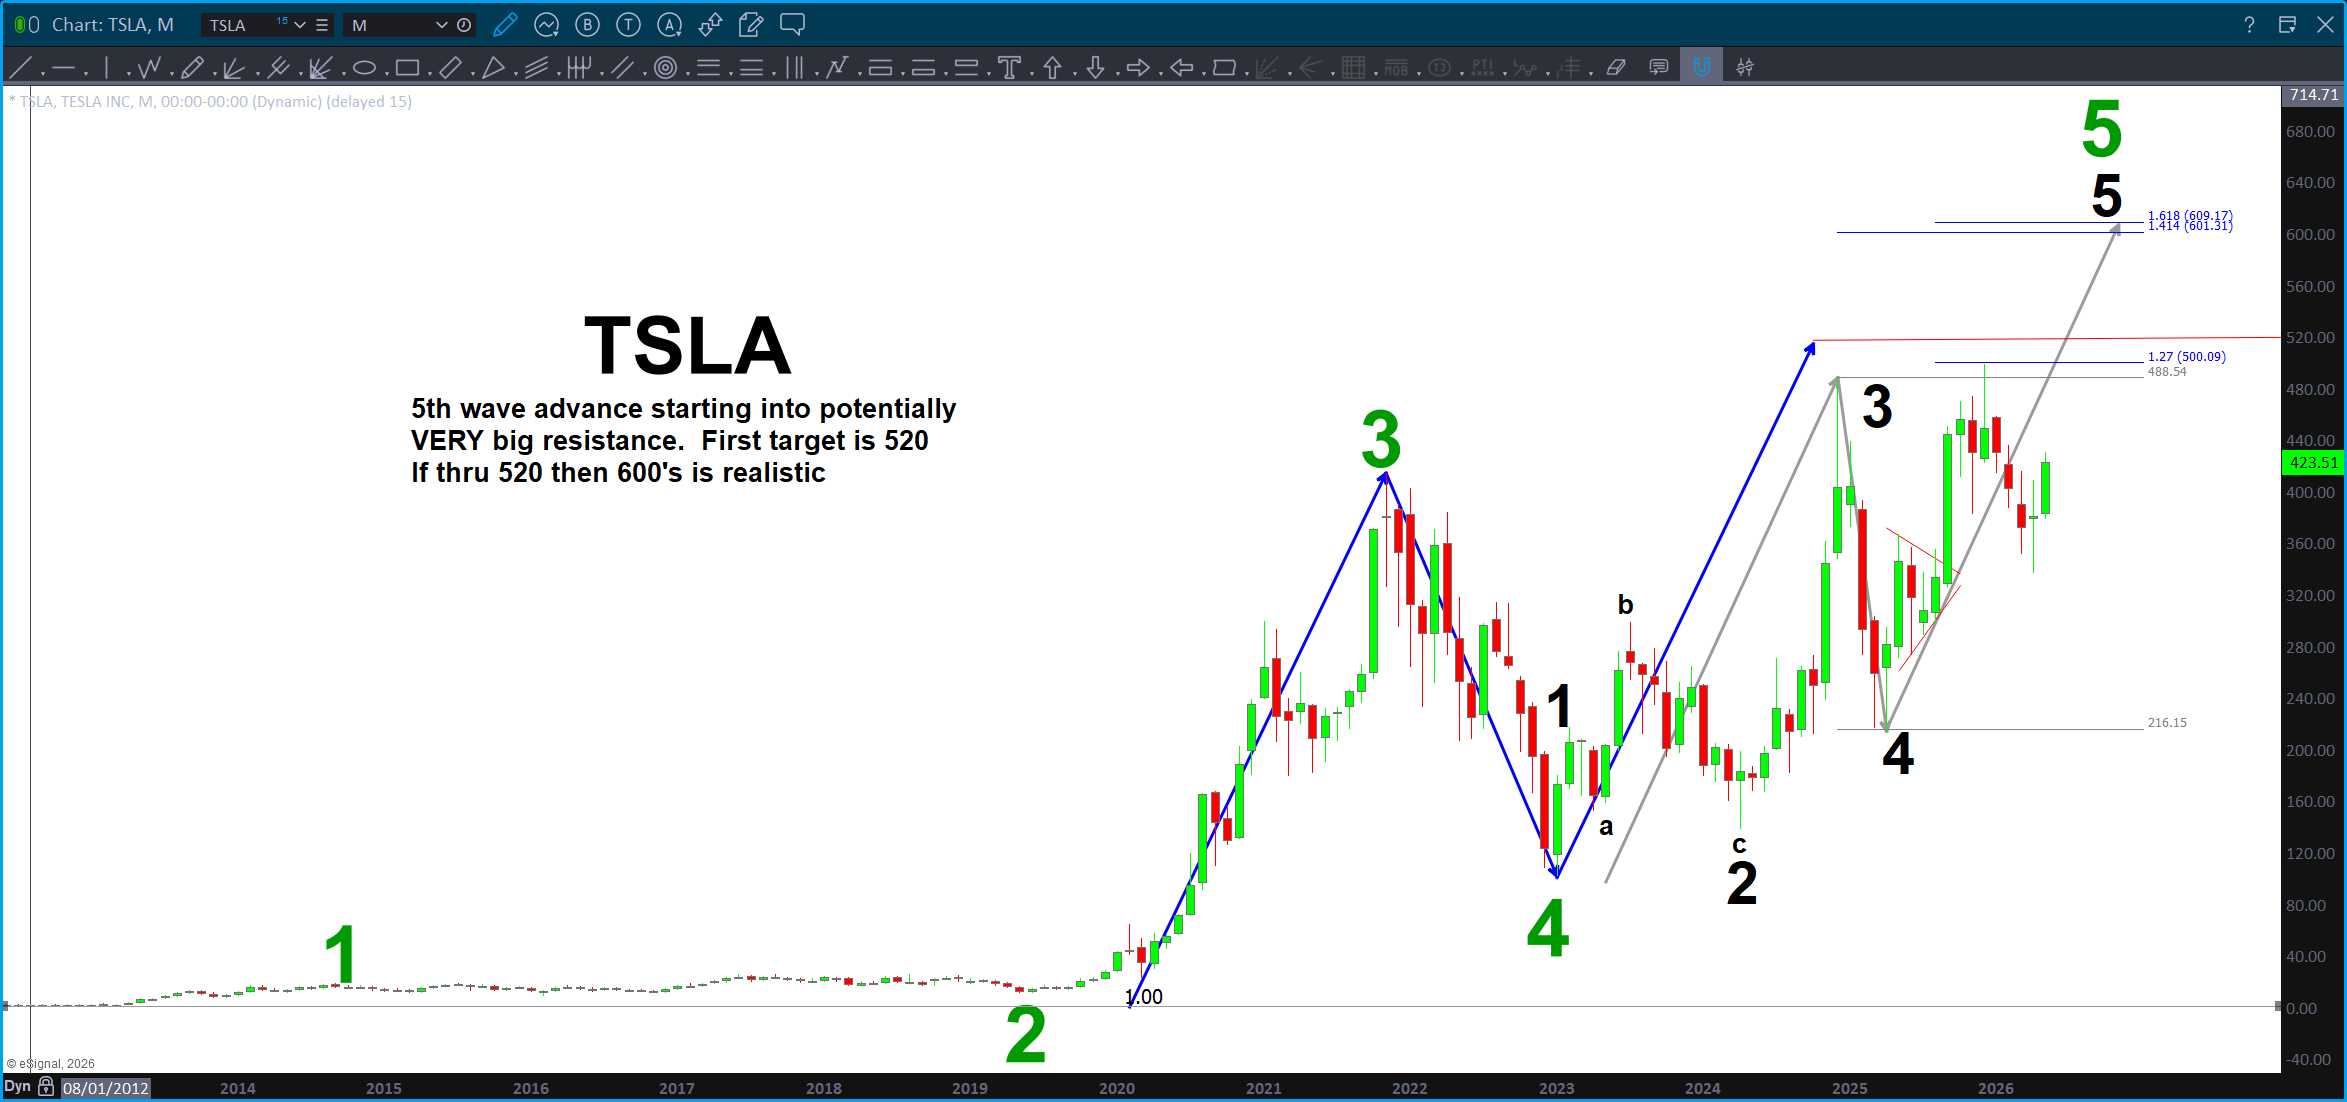
When we have a pattern w/ a lot of thrust approaching the level, it’s usually best to step aside and look for a signal reversal candle or a bearish engulfing pattern. Let’s see if the pattern is able to hold … or not.
Avis (CAR) and Extremes – May 10, 2026

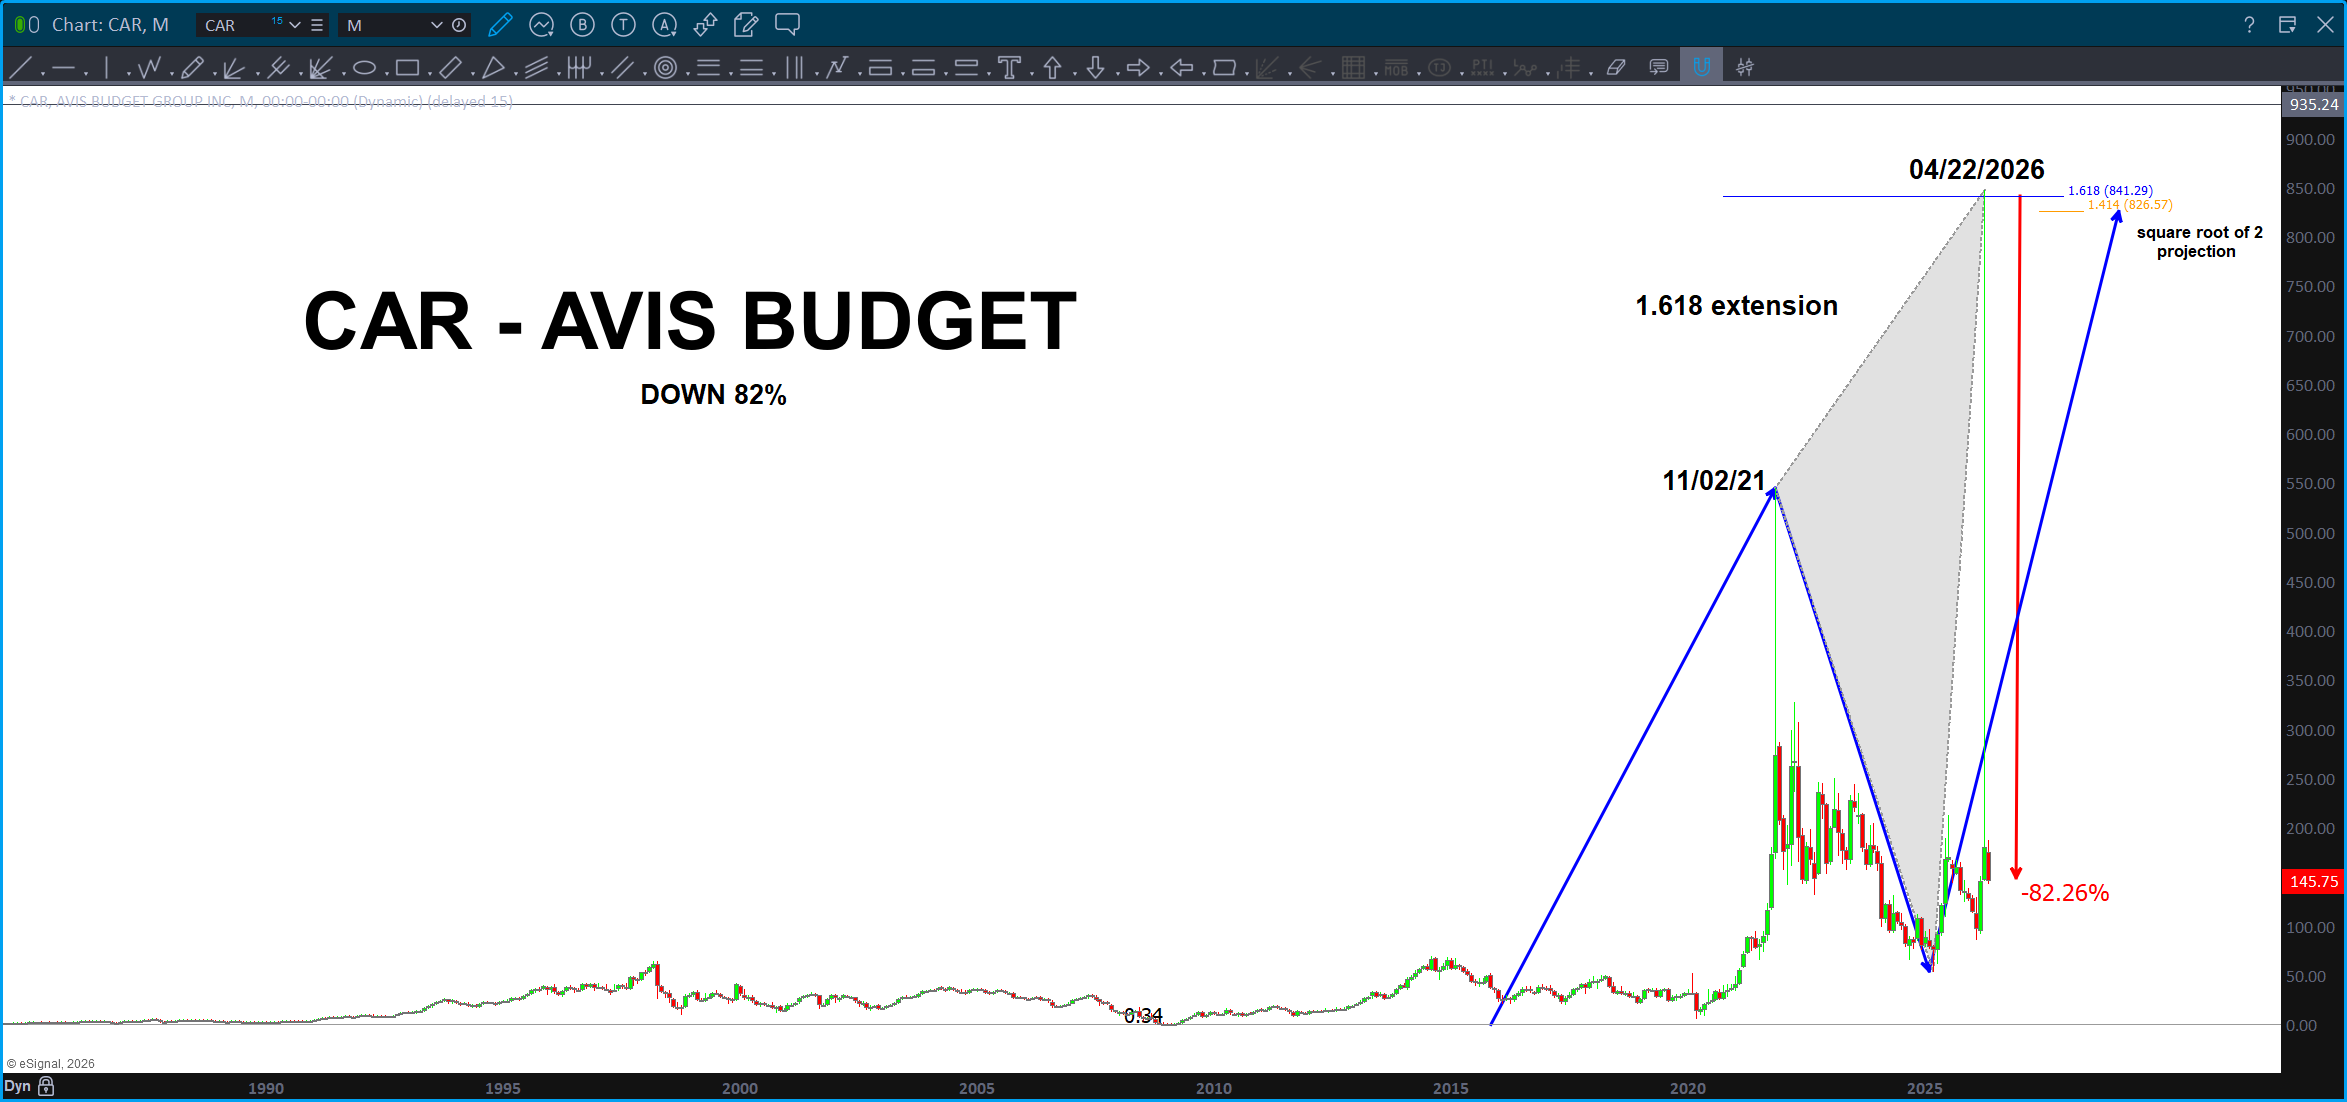
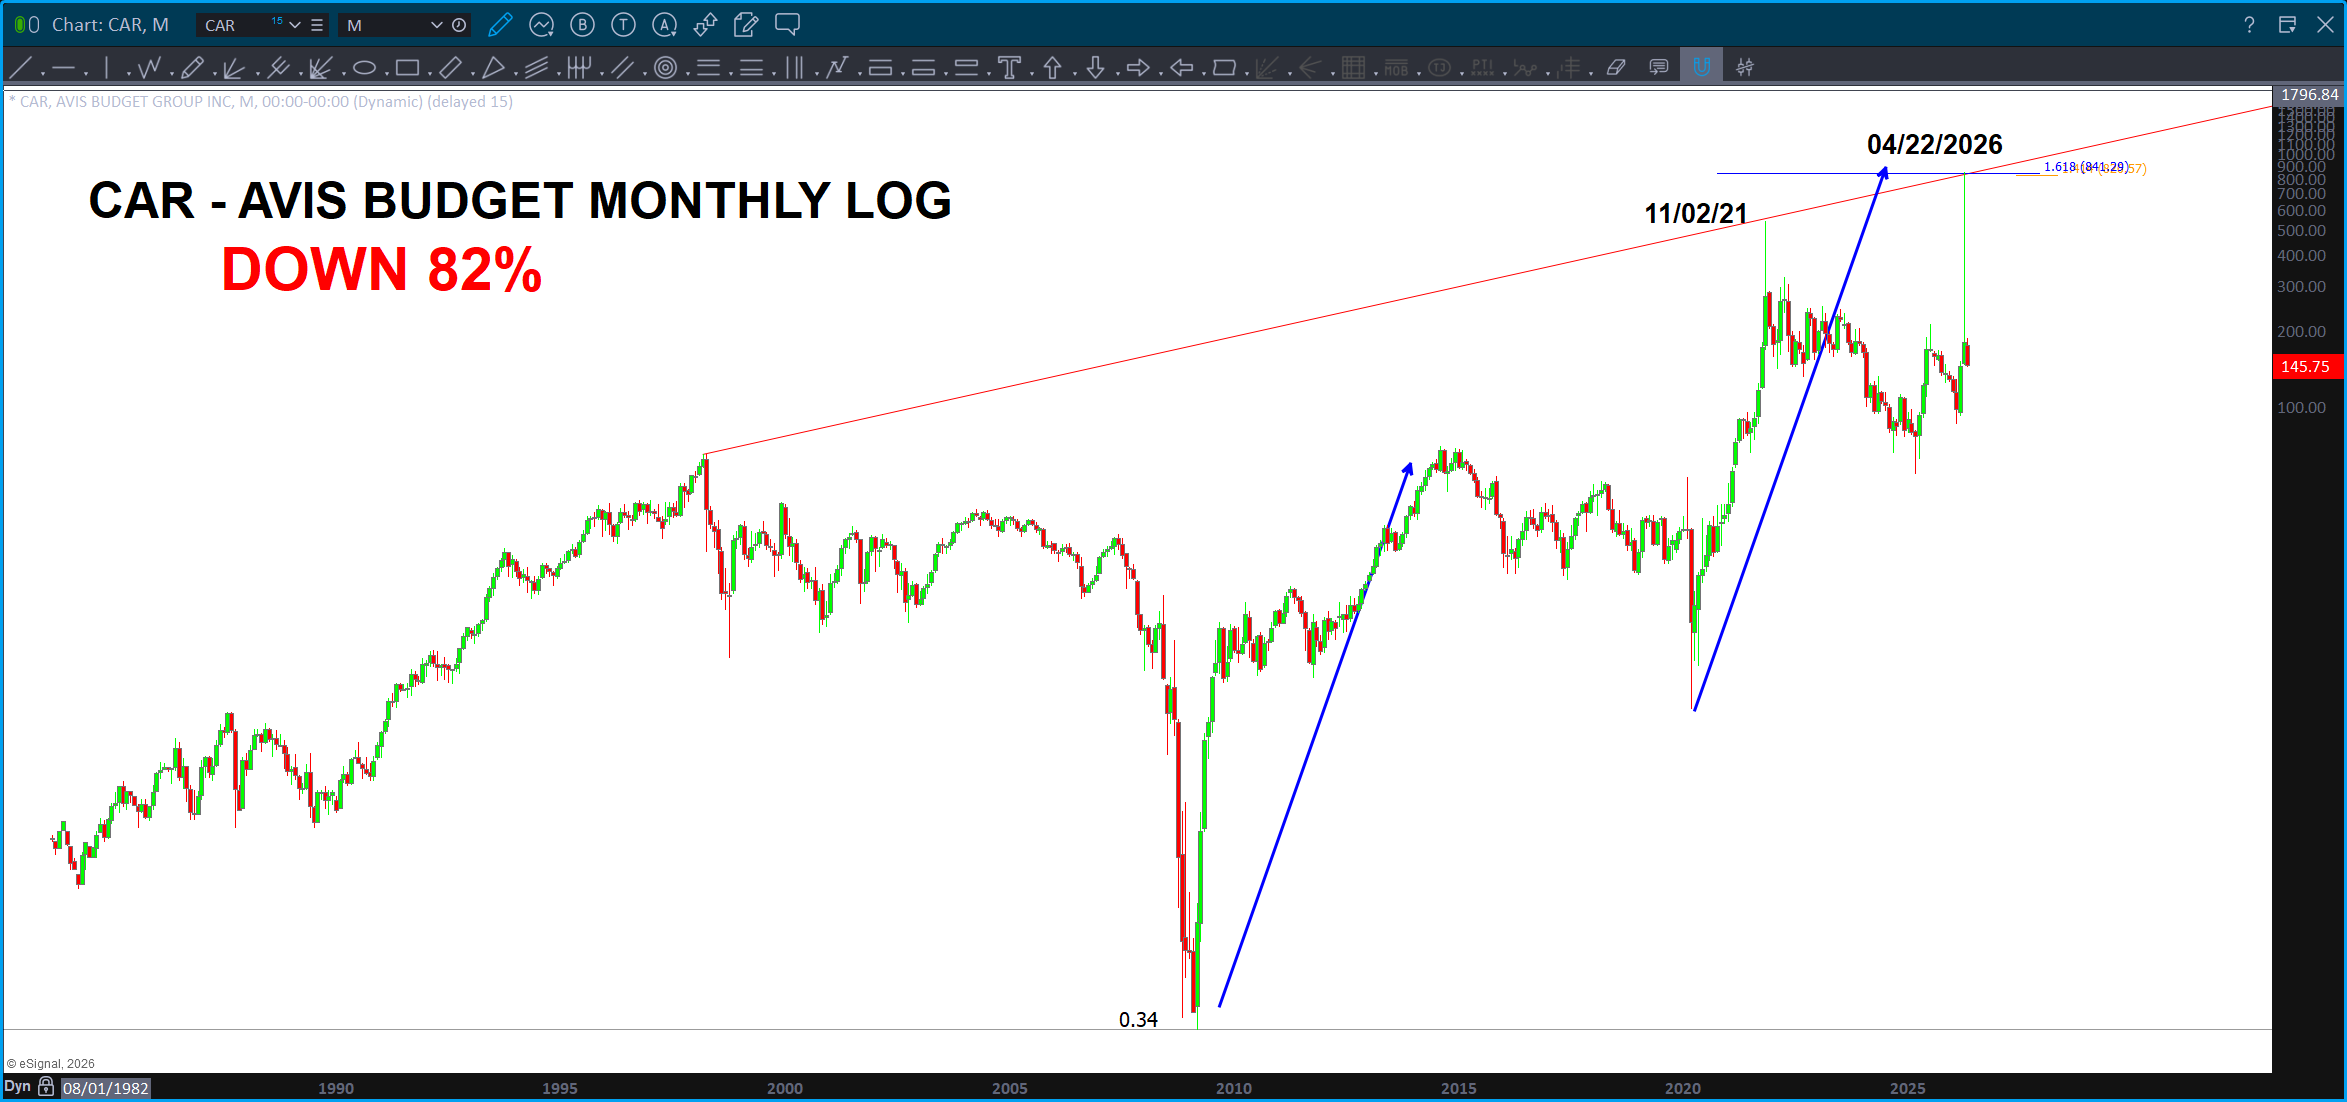
I do not like to do “post mortem’ charting because it’s the ‘could have would have’ syndrome … see what I ‘would’ have done. No, I like to do everything pretty much real time. In this case, however, just to give an example of a parabolic move higher followed by a bust then look no further than CAR.
It EXPLODED in a frenzy … that frenzy needs to be balanced and will (as shown) balance it out by a corresponding amount of fear. Hence, it’s down 82 percent from the all time high. OUCH …
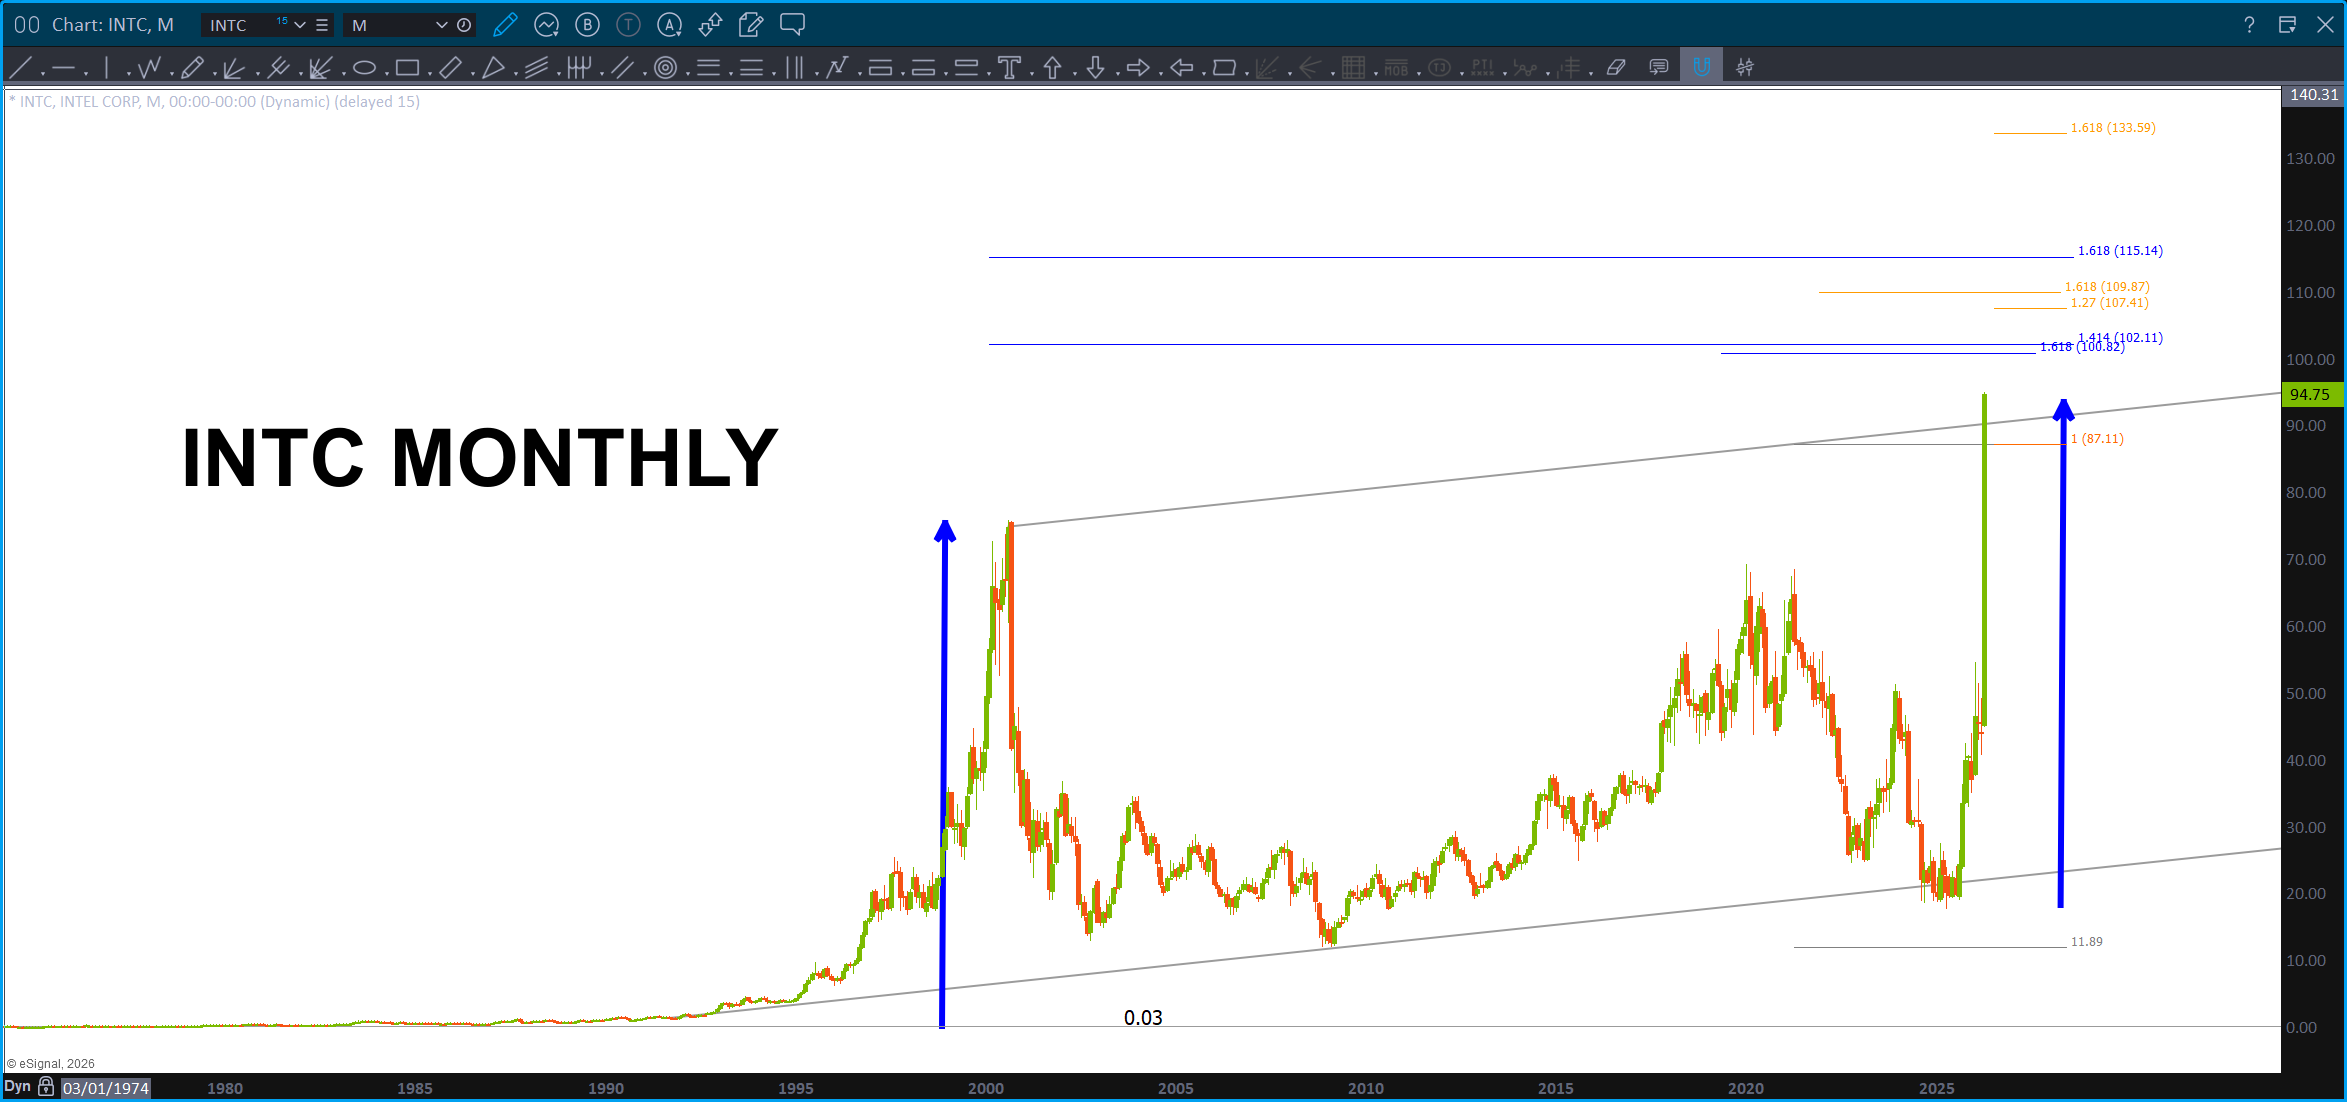
Check out INTC right now … check out the Semi-conductors right now … IF you are long enjoy the ride but realize on runs like this the carpet will, literally, get pulled right out from under you.
In flying we used to call it Bullseye Nose High … 90 degrees nose up w/ the engines in burner (more than likely a compressor stall in the F14A :)) and the jet just can’t go any higher. And when the jet simply has no more power to climb .. it falls.
It’s physics folks …

Attractors – May 10, 2026

My bud Ponch is going to BLOW AWAY the Hedgeye crowd this week …trust me.
I had a conversation w/ him late last week ( we have talked continuously for 2+ years ) and simply thanked him for, literally, teaching me the ‘real OODA LOOP’ such that pretty much everything around us is controlled by this masterfully complex yet simple in design ‘loop.’
To imagine the John Boyd literally studied the Hermetica and beyond to complete his theory of how living systems persist thru time is hard when the ‘loop’ seems so simple. It’s actually brilliant.
Tune into this talk …

Got me thinking … not that I’m anywhere close to where Ponch and Mr. Boyd are from an intellectual capacity perspective but I have gone down the rabbit hole, pretty deep. Almost came out in China to be honest …
My friend Alan Green told Ponch and I that Einstein was “obsessed w/ simplicity.” Think about it … E=MC^2. One of the MOST complex subjects distilled to that. Elegance in simplicity …
That’s why, ultimately, I simply trust the harmonics of the measured move. Why?
Because they are the basis for the fractal nature of our entire universe.
If PRICE = TIME … in that, say, a high price of 40 will spin of time cycles of 40 … minutes, seconds, days, degrees of planetary travel, etc. etc. then the harmonics of time are directly equal to the amplitude of the price move.
So, as you will see in the charts below, the MEASURED MOVE contains all the DNA (key here folks) for those who are invested in a particular security or index. The theory being that on the quantum level all the vibratory aspects of ACTION w/in, say, the stock of SBUX is manifested by geometric attractors – just like everything – that create the foundation energetic footprint of the masses. Since we push a stock up or down based on greed and fear those price vectors ultimately HAVE to contain a DNA element w/in them containing time.
What IS the ultimate guide for time w/in this 3D construct called “life” or “earth” if you will? The planets …
Don’t believe me?
“And God said, Let there be lights in the firmament of the heaven to divide the day from the night; and let them be for signs, and for seasons, and for days, and years.”
— Genesis 1:14
Or, do your own work:
Genesis 1:14–19 Genesis 1:16 Psalm 104:19 Psalm 104:20–23 Psalm 19:1 Psalm 8:3 Psalm 74:16 Psalm 136:7–9 Psalm 147:4 Job 38:31–33 Job 9:9 Job 26:13 Jeremiah 31:35 Amos 5:8 Isaiah 40:26
Psalm 104:19 is especially direct: “He appointed the moon for seasons; the sun knows its going down.”
Job 38:31–33 is worth highlighting — God asks Job whether he can “bind the Pleiades” or “bring out Mazzaroth in its season,” implying the constellations/planets operate on a divine schedule.
Jeremiah 31:35 refers to God giving the sun, moon, and stars as a “fixed order” — another strong timekeeping verse.
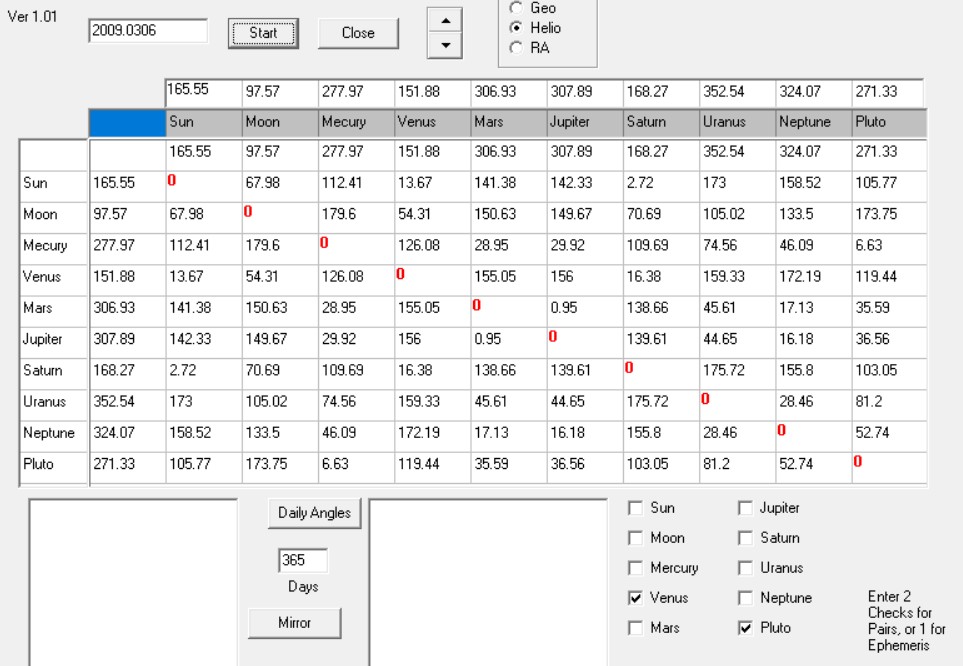
So, ultimately, there is a harmonic sheet of music being played …the below is an application that I received from Michael Jenkins and its the location of the planets, heliocentric, the date of the low for the Great Financial Crisis.
The numbers are the degrees of separation, helio, between the planets on that date. That date was a tremendously key low from a cycles perspective. Ya think?
So, if that is the beat of ALL the planets – think of it as the reflection of the beat of the masses on that date – when the orchestra of the world, perhaps, transitioned there emotion of fear to greed. A transition like the one that occurs in Led Zeppelin’s Classic Kashmir … a new beat. Since this is the ‘orchestra’ of the markets any/all future and (foot stomp) past market movements are harmonic to this ‘beat.’
It’s not just one planet or set of planets …it’s the entire orchestra that transitions. You catching what I’m throwing down …?
You see, every angle is key and not only every angle but also planetary travel of individual planets. And, yes, of course, tertiary angles … picture each planet as a musical instrument in the orchestra of the market. Each has a role and it’s multi functional and, frankly, multi dimensional (I said it).
So, how do you keep track of square outs, fundamental frequency targets, square of nine price and time targets, planetary and geometric angles based on the platonic solids, planetary motion, etc. etc. You don’t but … AI certainly might be able? Ya think …?
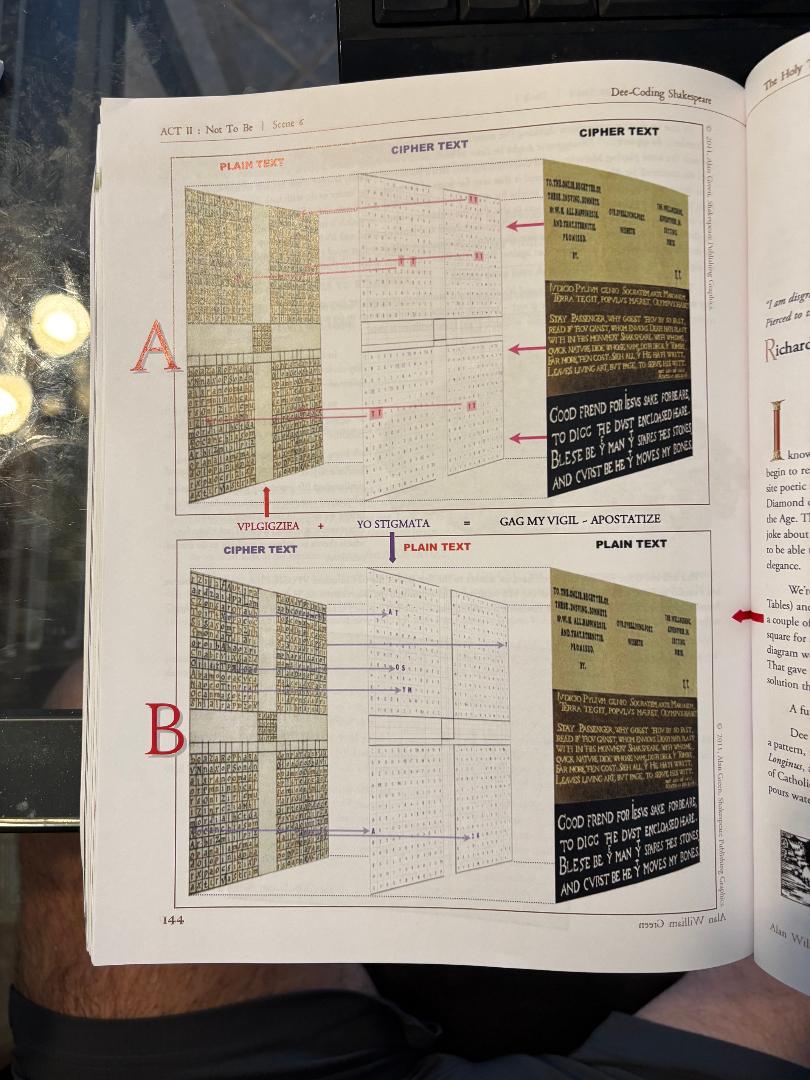
Is this doable … honestly, not sure. That being said, having read Alan Green’s book DEEcoding Shakespeare 3 times one can see that AI is not necessarily needed as John Dee, who downloaded the Enochian Tables from Angels (documented) and encrypted Shakespeare in a 3D manner (shown in the picture above) could certainly see the movement and flow of everything.
Just ‘playing around’ w/ an LLM I created a planetary AI Agent to look for cycles … the above is what it came up with. This is having NO access to any market data. Well, here’s what is interesting … look at that, a measured move, on a confluence zone on the date of a major cycle hitting …
All of this is a long way of saying that I simply trust the measured moves and, frankly, live and die by them as they are the truest indicator of market trends and emotions. Humor nature NEVER changes – why? Well, because it is ALL happening now just at different vibrations. Time … is not … linear. The UAP release should (operative word) give you some permission to explore this … don’t ya think?
So, tomorrow AM, I’m going on Stock Market TV w/ Spencer to talk the following charts.
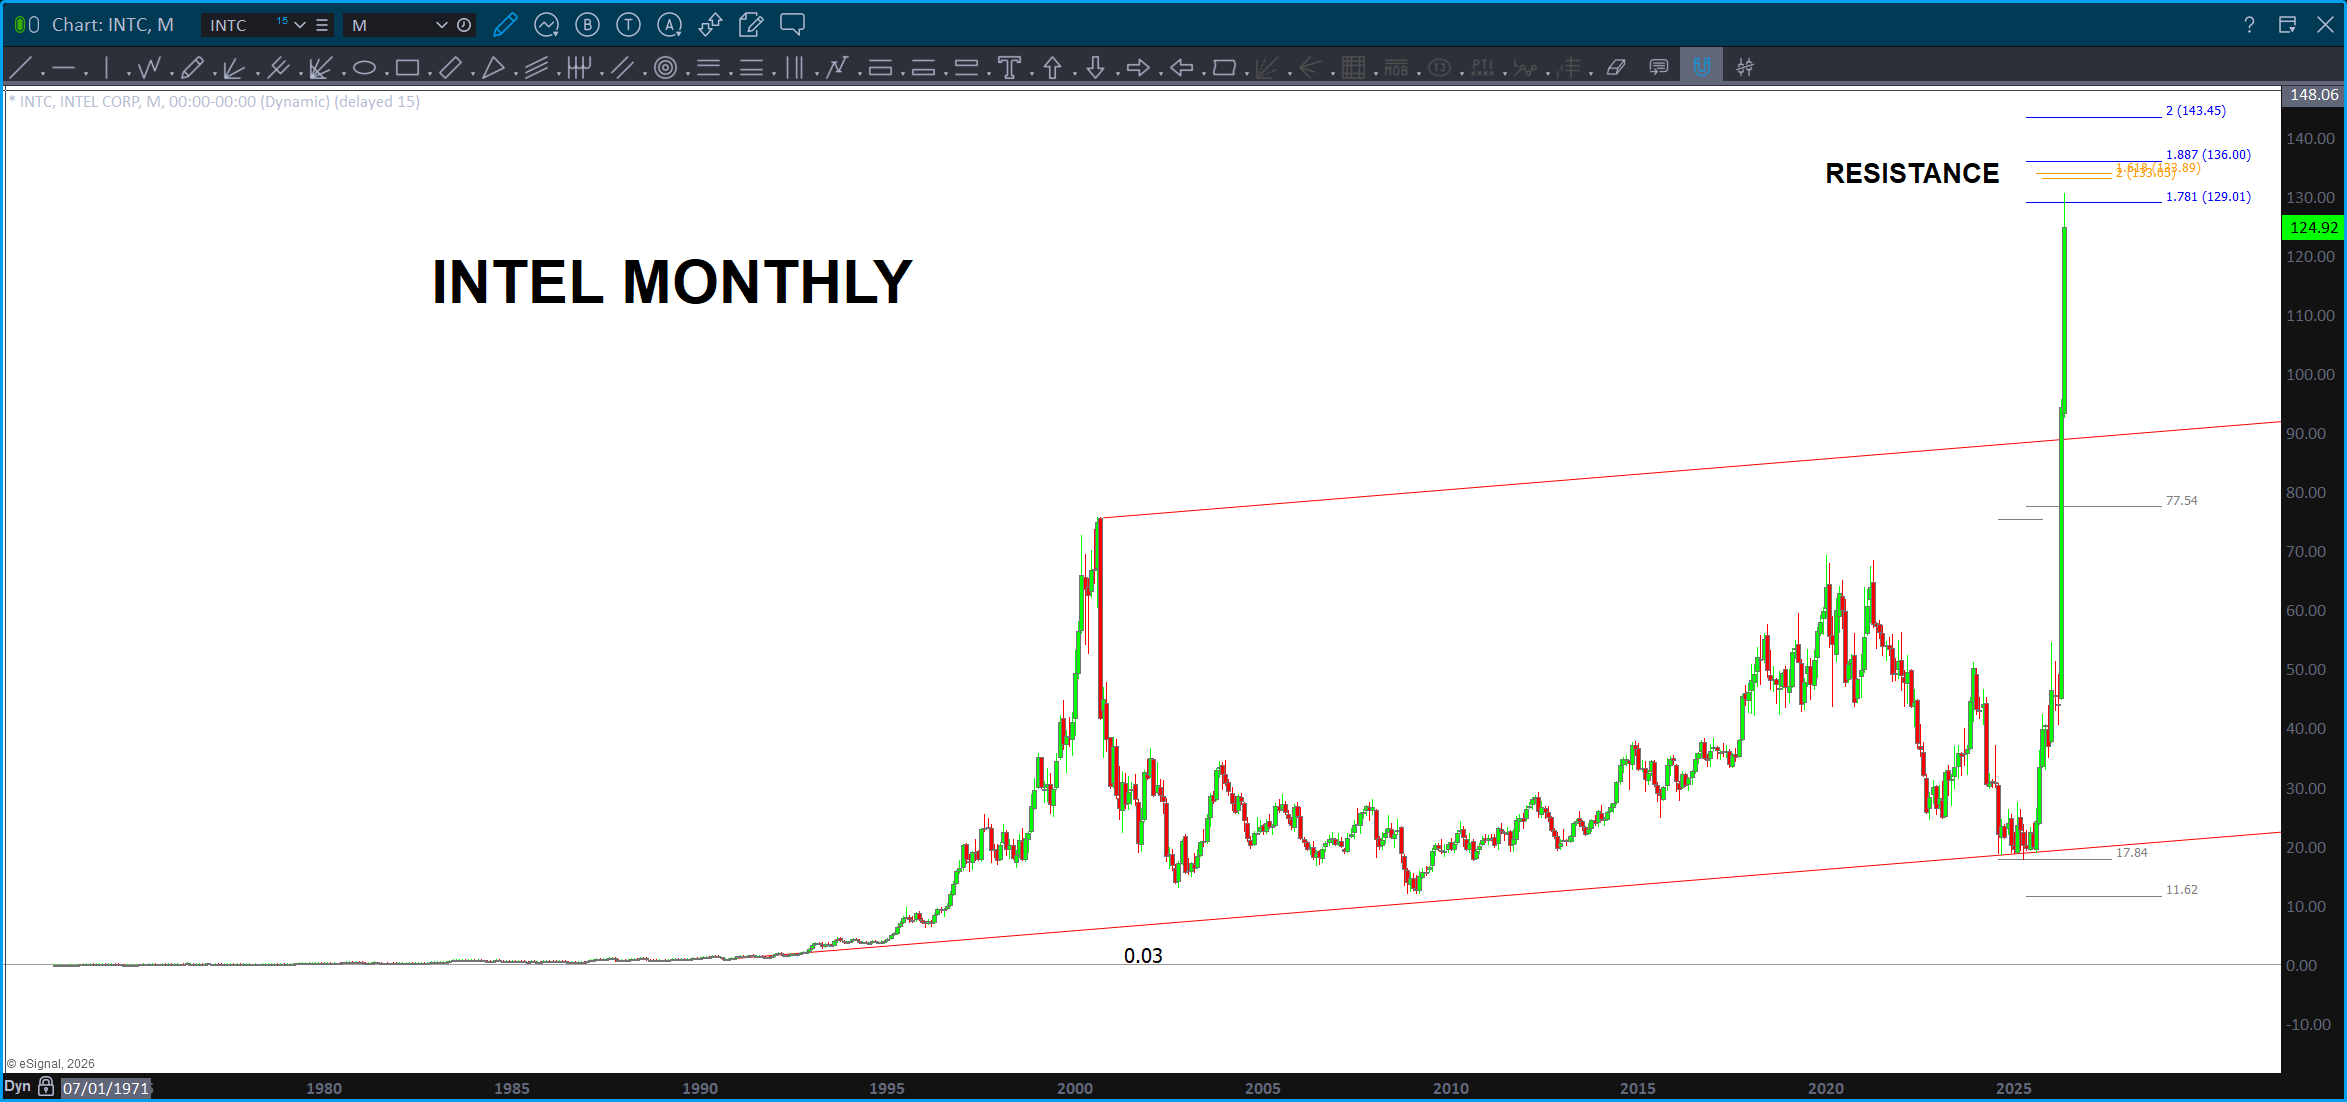
BLUF: If we are up at the end of the week, then I would expect a parabolic blow off. But remember, we are dealing w/ quantum level emotions of the masses. At this level, for every action there is an equal an opposite reaction. So, when something takes off in a parabolic run like INTEL, it will have to be balanced by FEAR. That’s just the way it is folks … it’s physics.
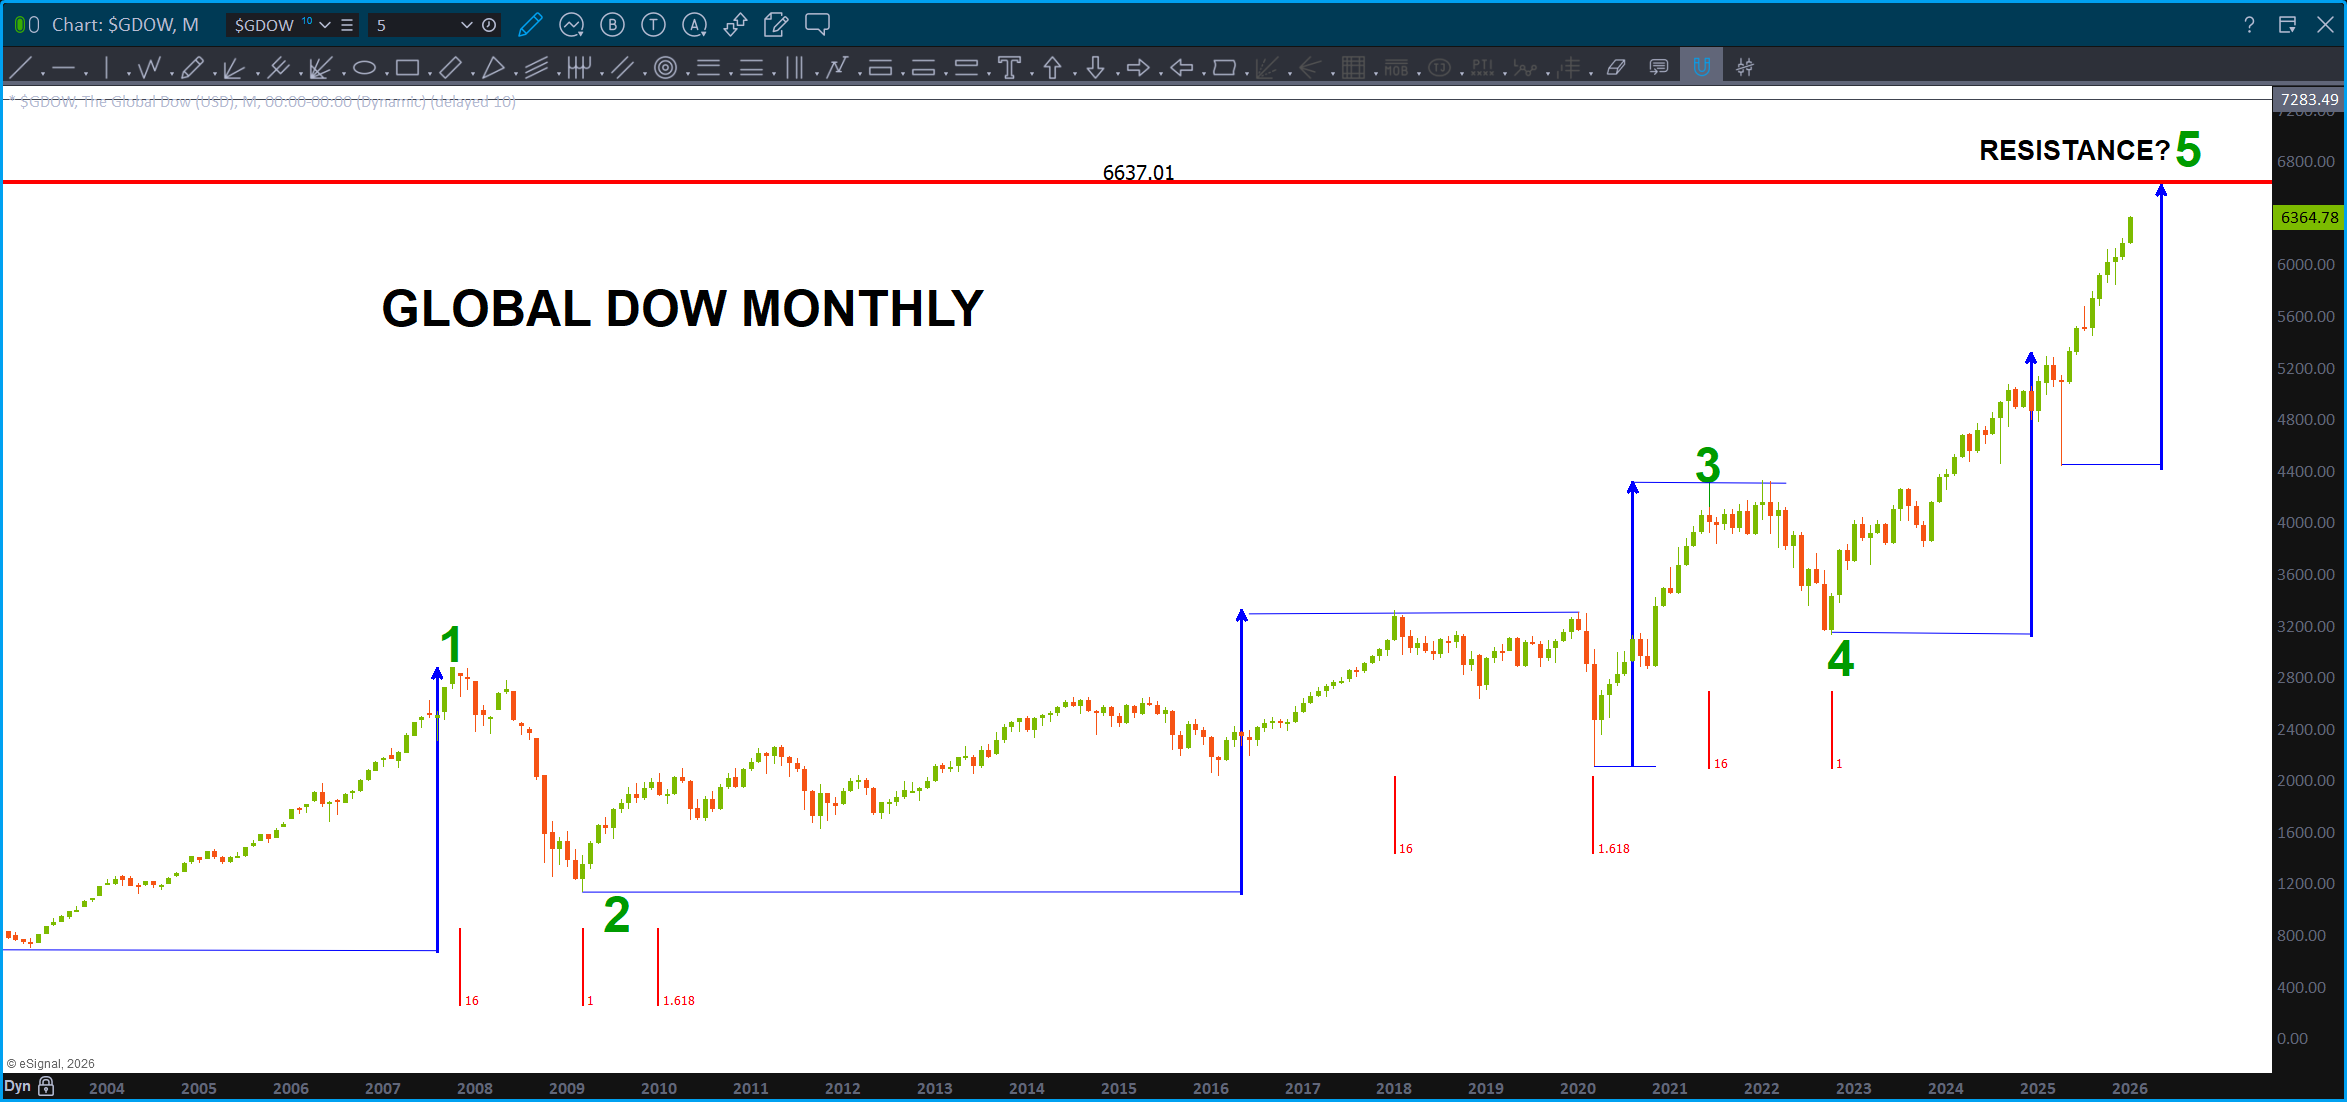
I always start w/ this chart when I talk to Spencer. It’s the Global Dow from 3 months ago … this is a VERY key chart folks. NOTE, every single up move was equal to the BLUE MEASURED MOVE. EVERY SINGLE ONE which was then followed by a correction of – at a minimum – 16 months. Folks, almost a 1.5 year correction.
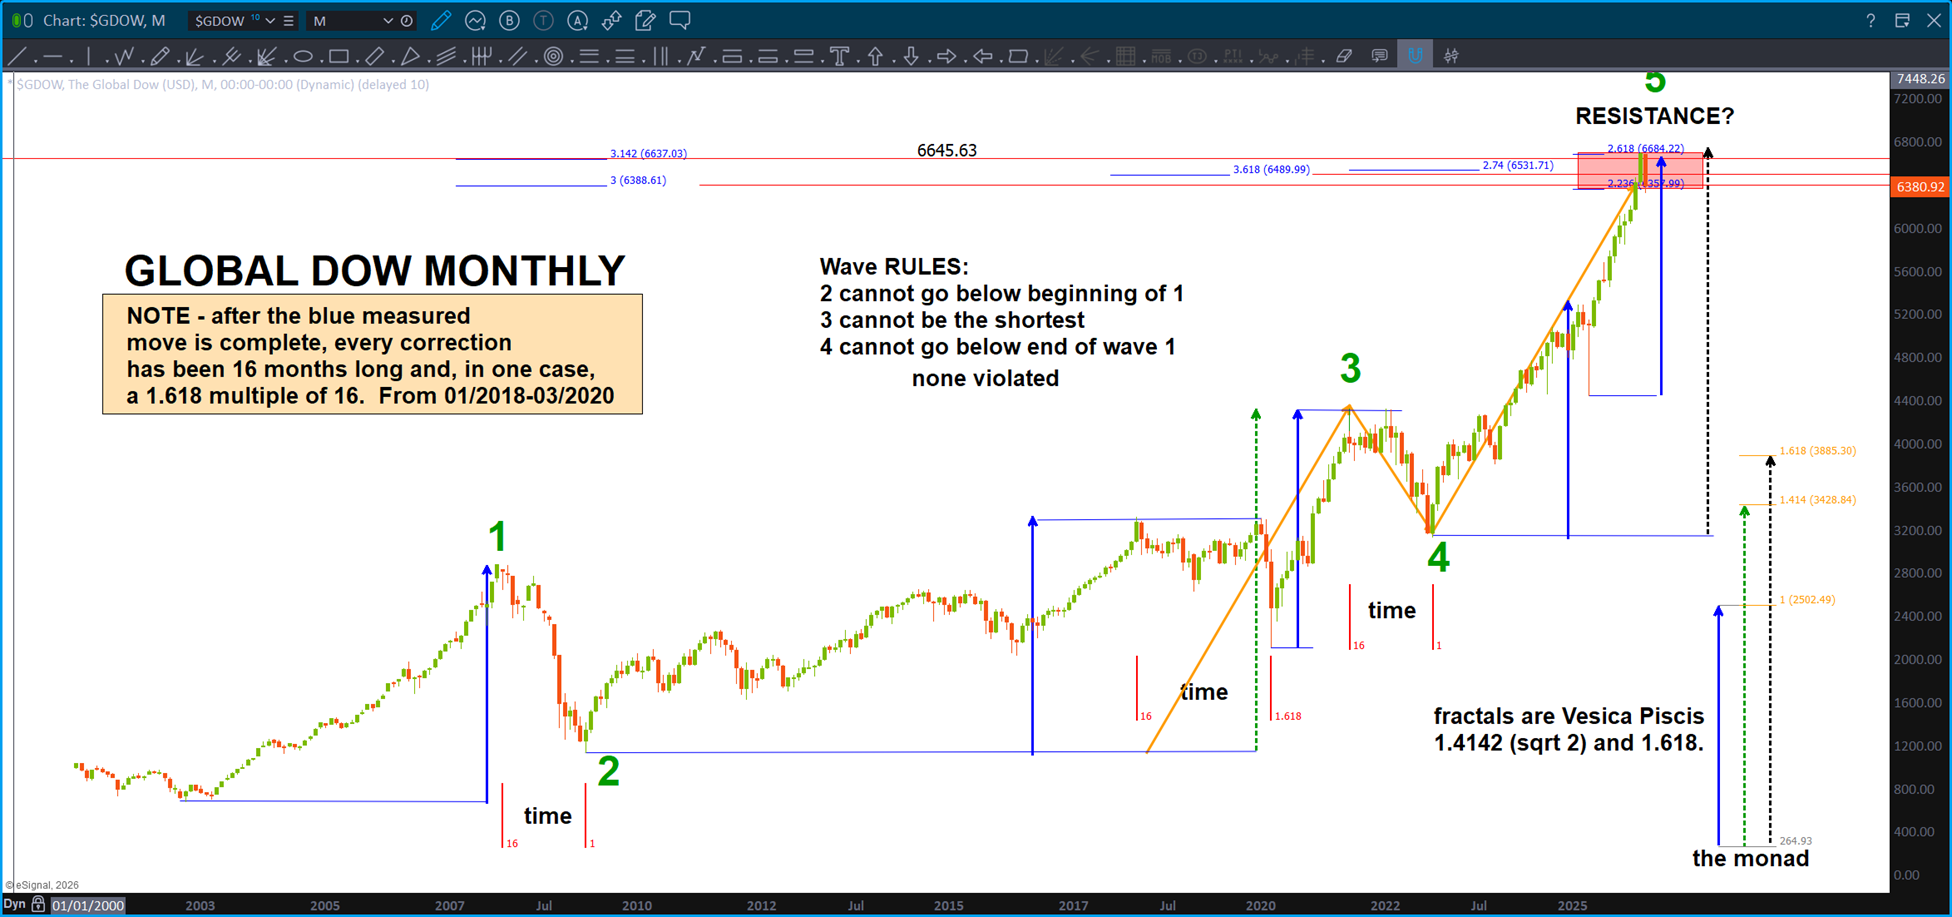
Well, here we are now … for the first time in 25 years it has blown thru this level. I have put another level above, but it has NEVER done this before. This is strength … we will see what the next target does or doesn’t. I just find it hard to believe (don’t trade what you believe, trade what you see) that after the same measured move we … failed.
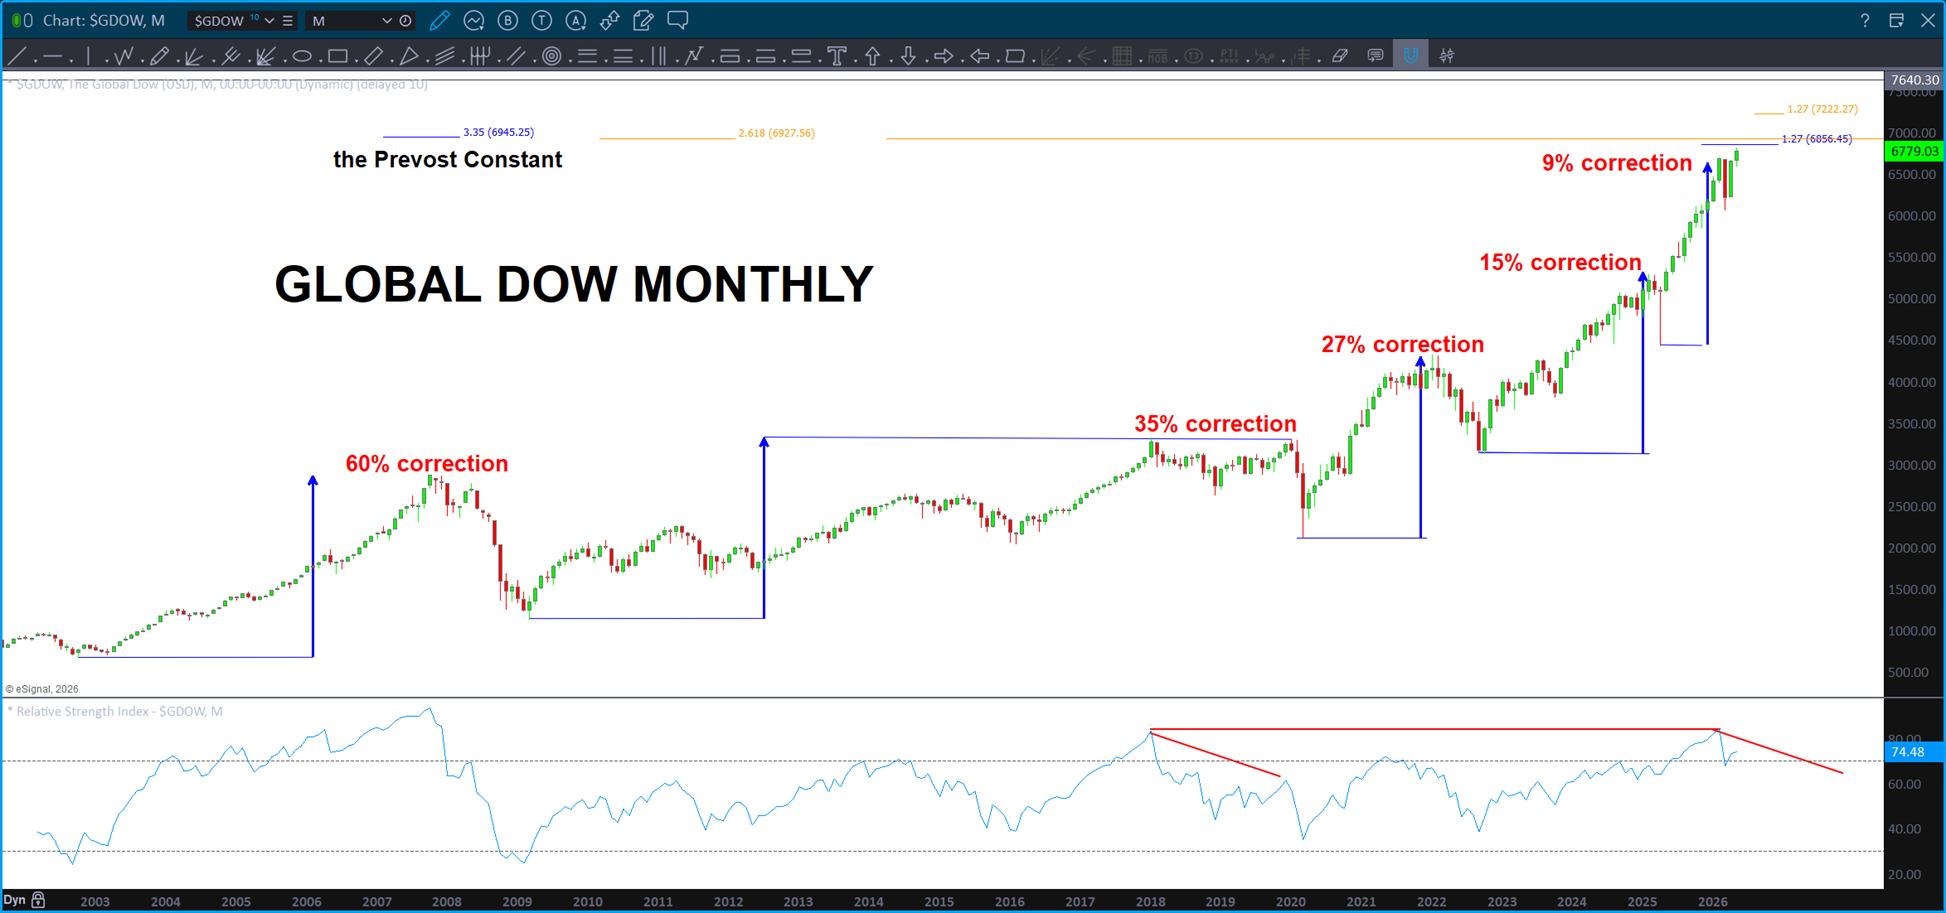
One last, before we leave the Global Dow … same measured move price every time but take note the corrections have become less and less each time. Hmmmmm ….are we about to explode higher? Need to see some failures first …
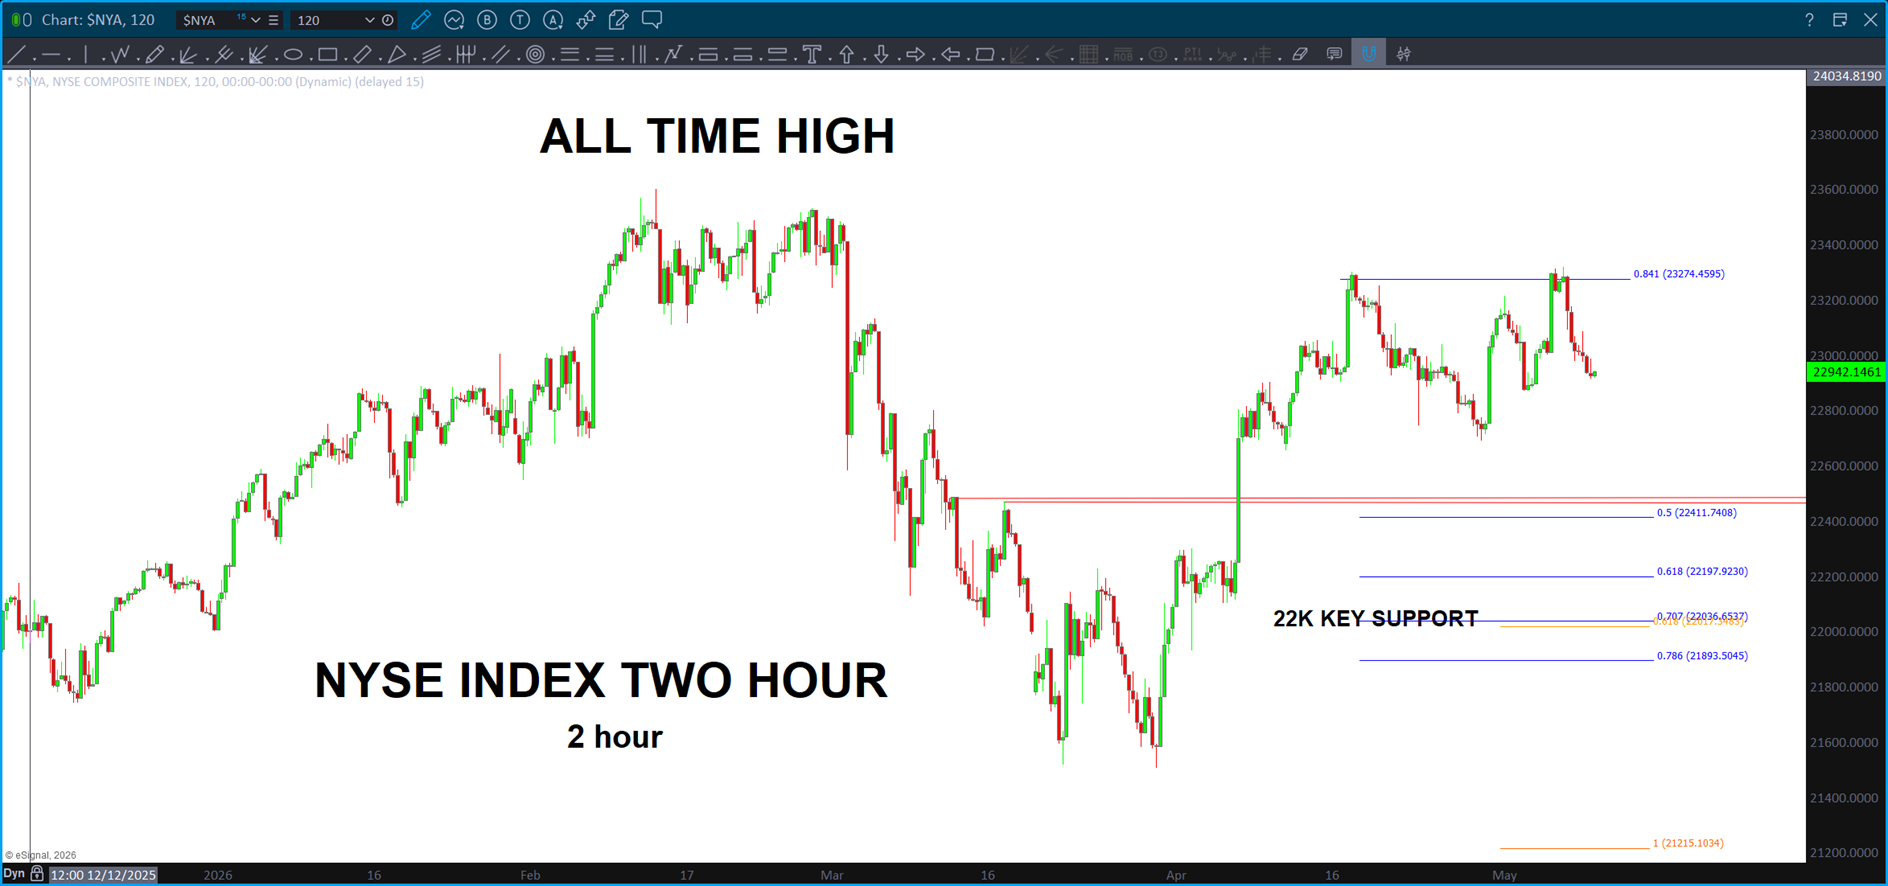
NYA … New York Stock Exchange Index – NO NEW ALL TIME HIGHS.
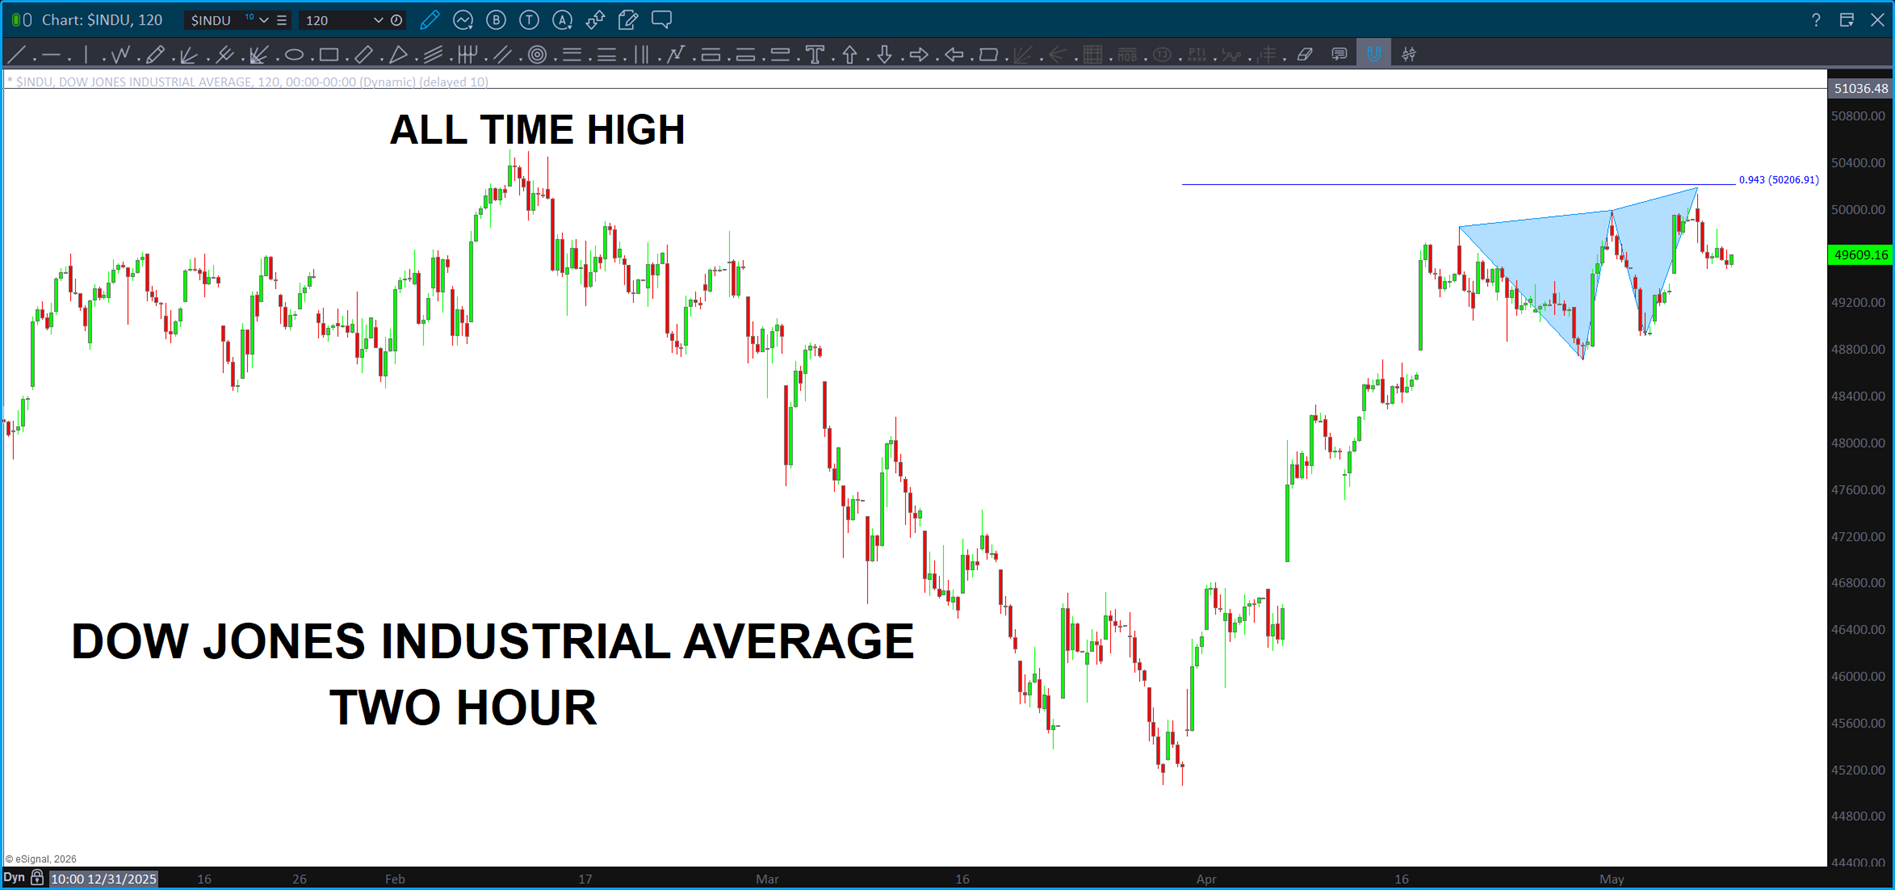
Dow Jones Industrial Average – no new highs.
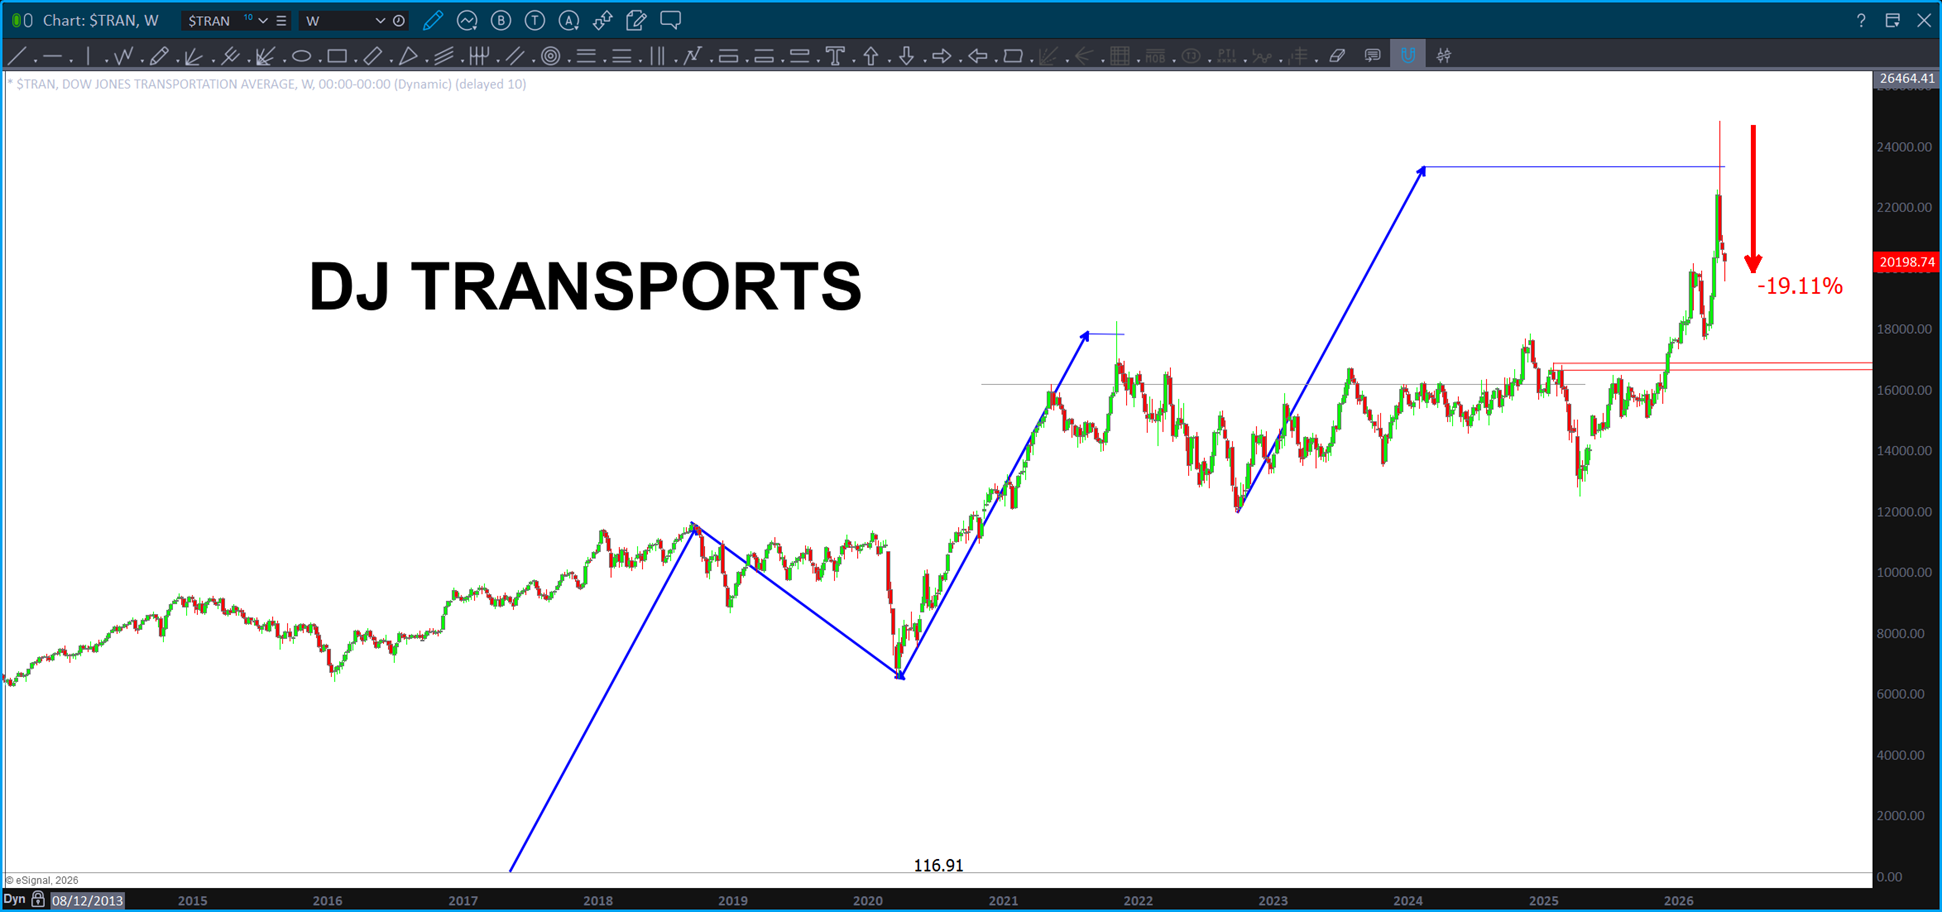
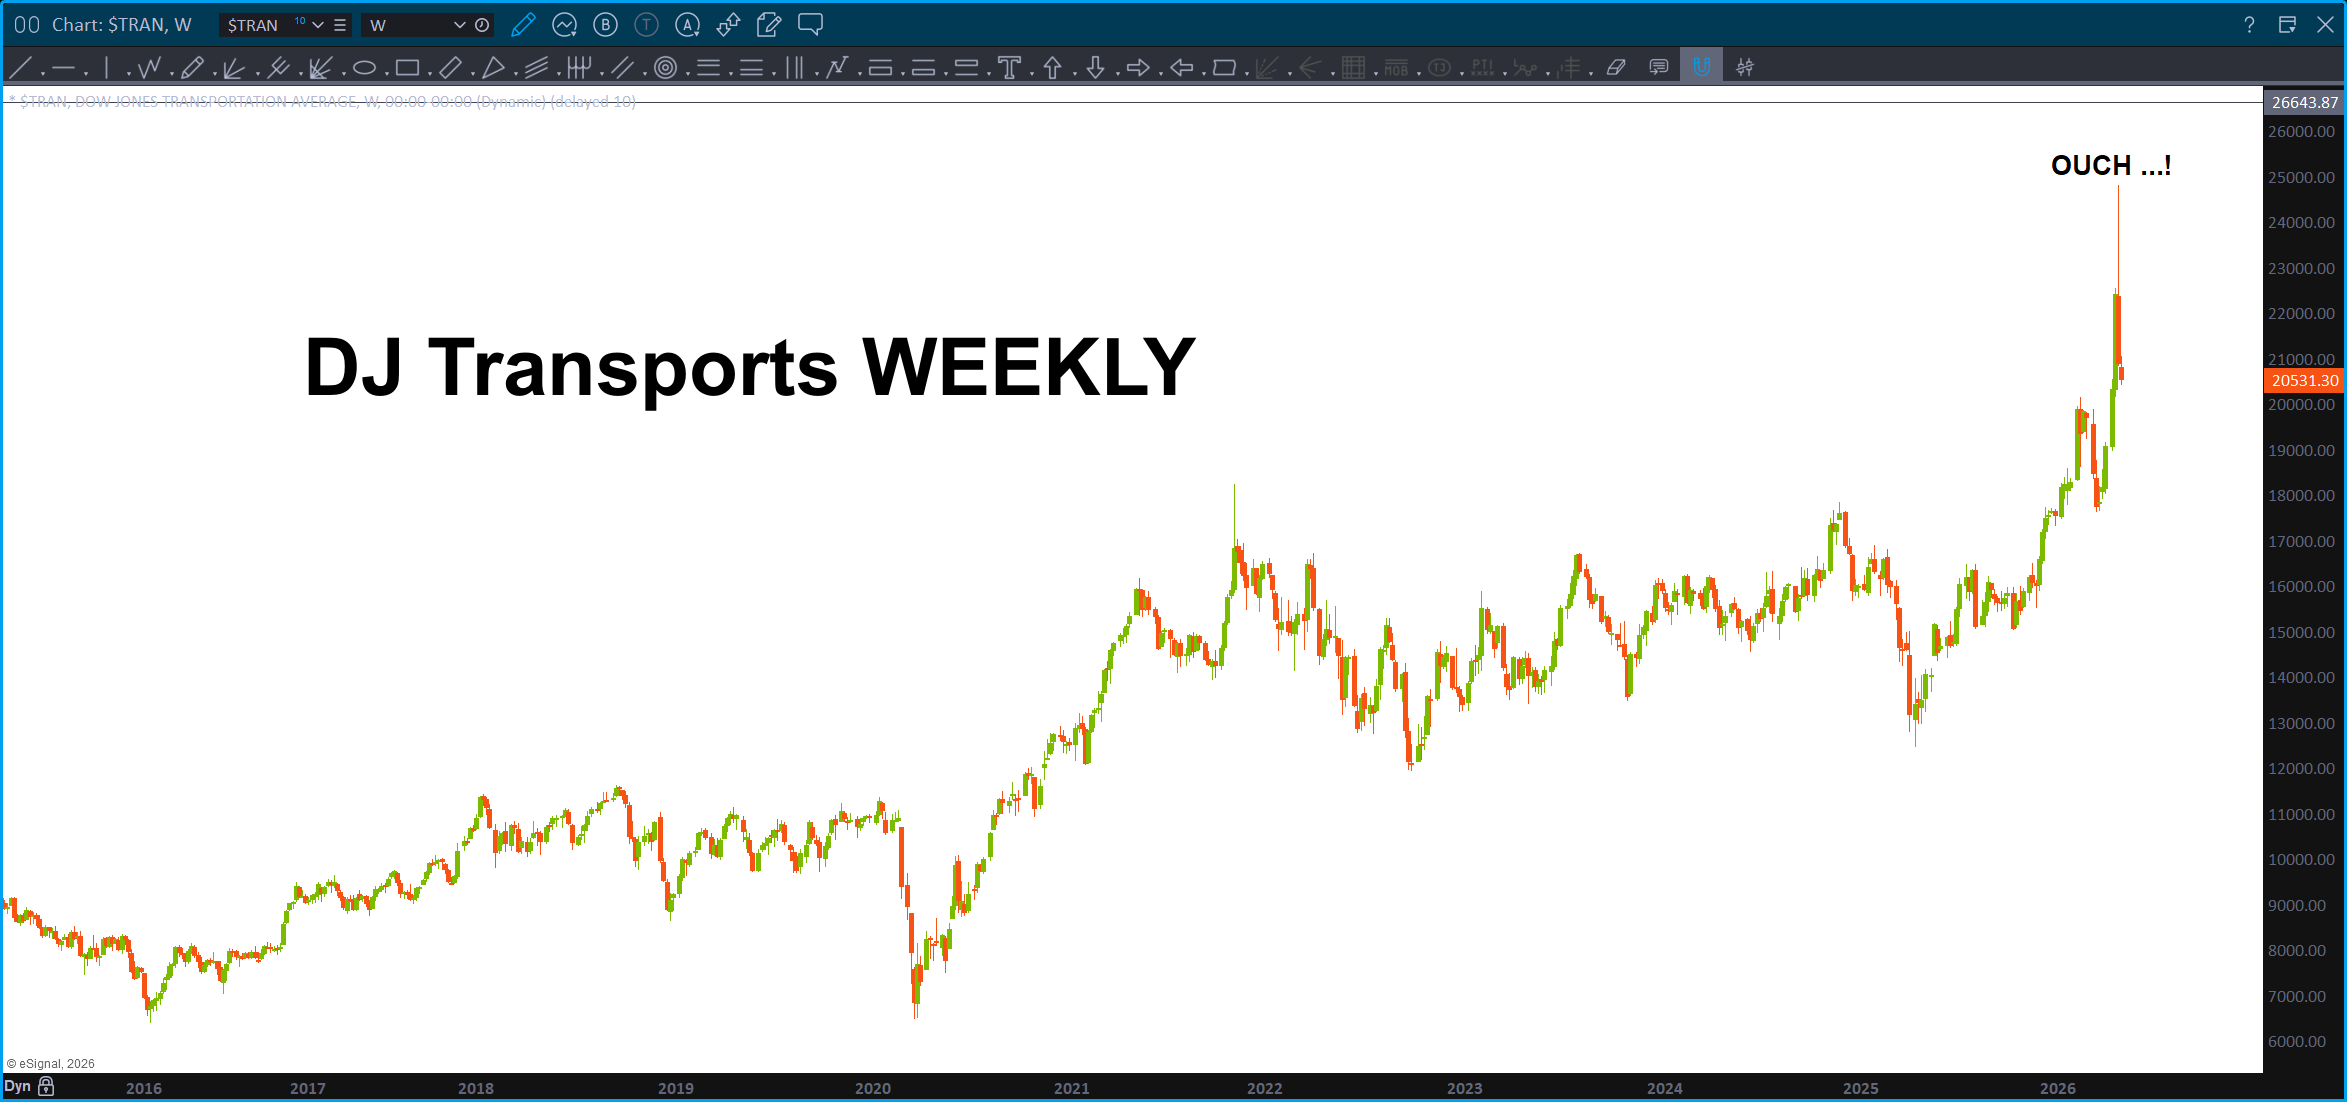
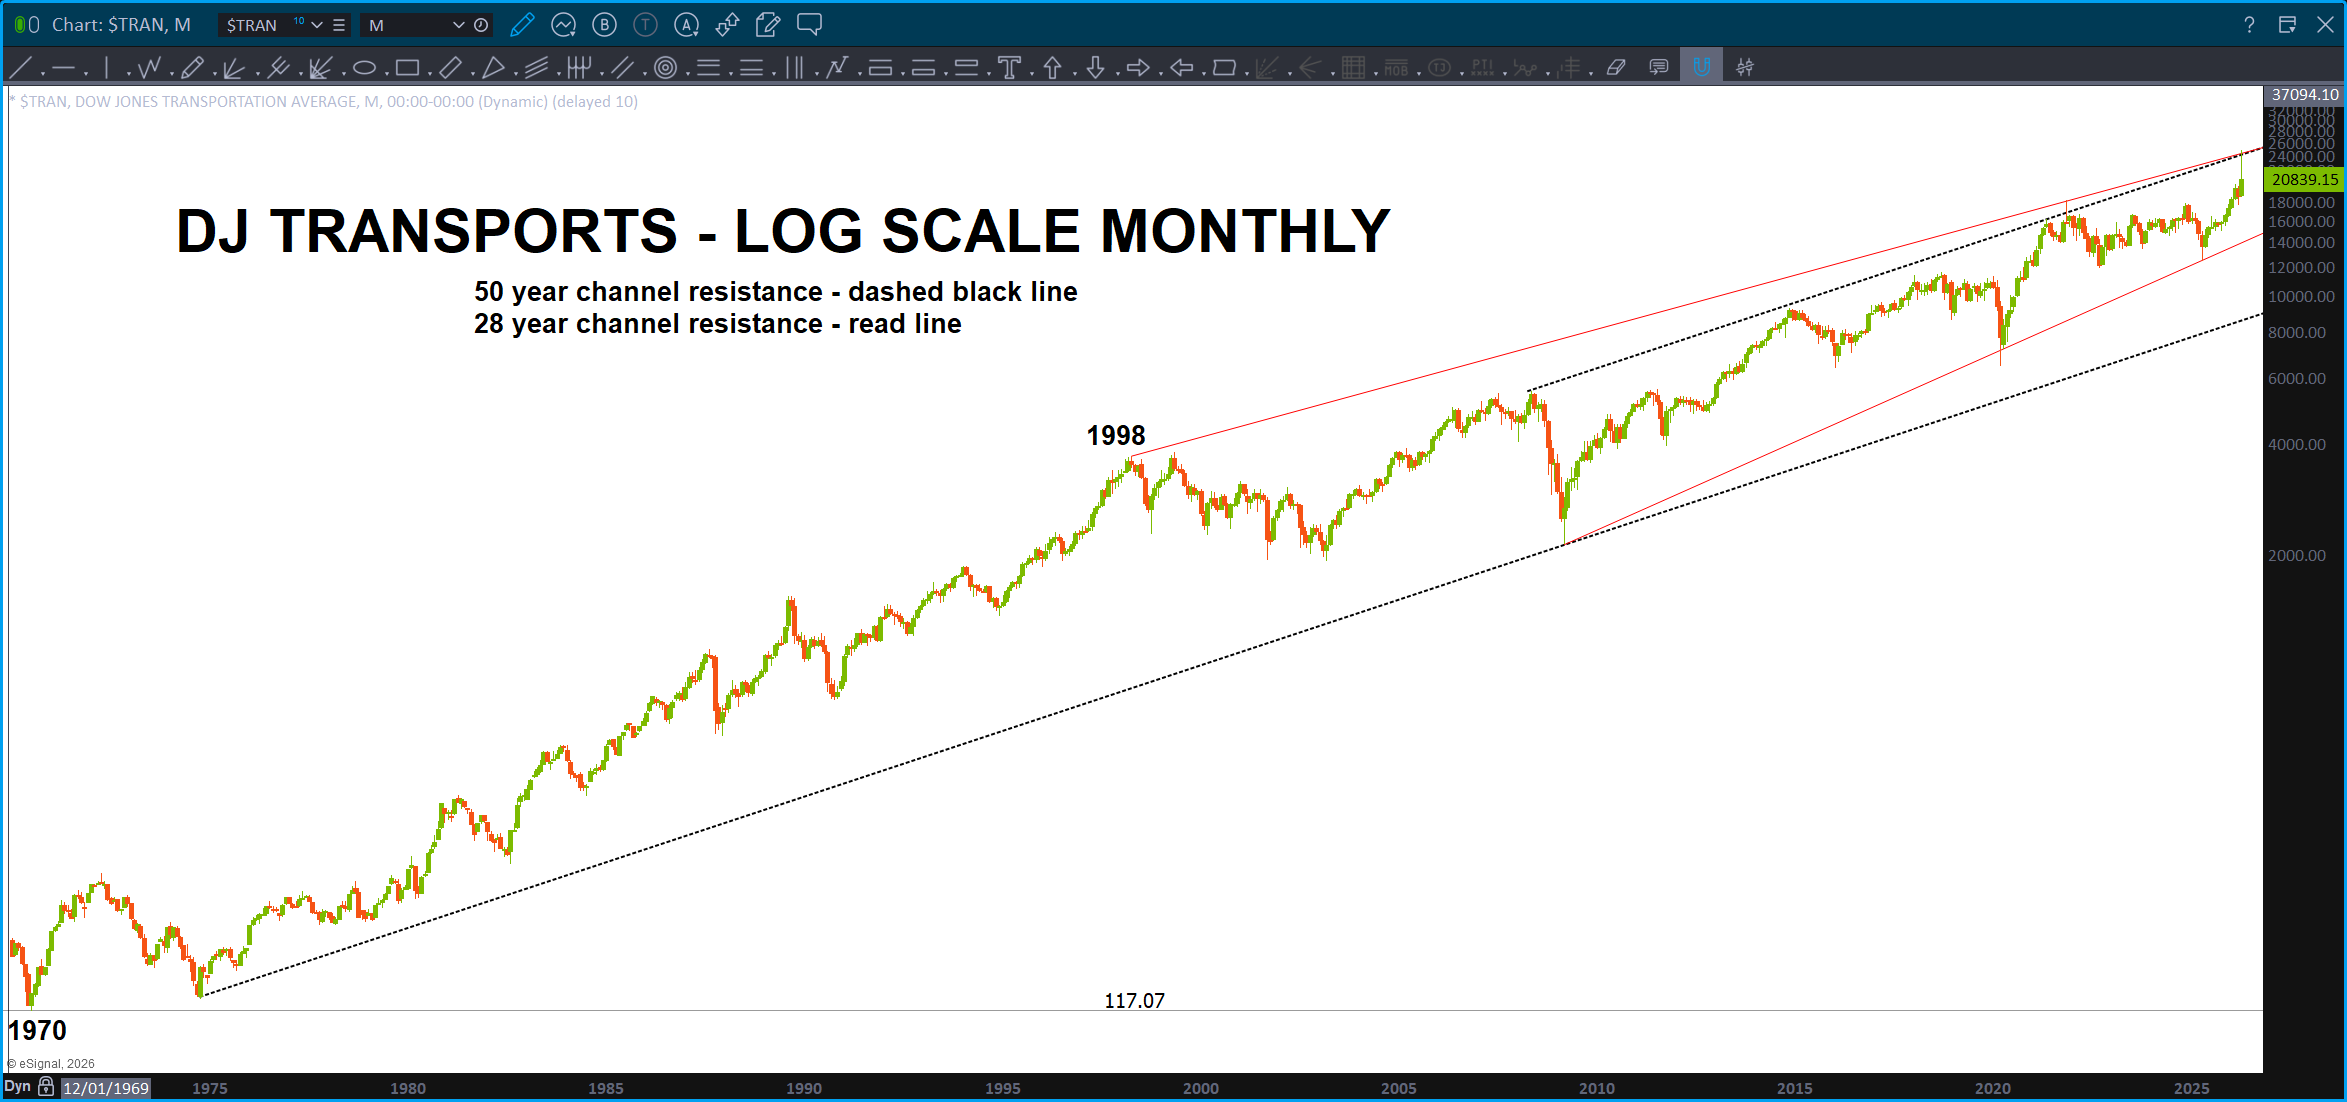
Here’s the Transports (throwing a little Dow Theory at ya) … take note of this longer term weekly chart. The blue measured move projections comes from the all time low. Then, the next two blue measured moves nagged the highs. Transports are down almost 20 percent from the high. Hmmmmm …
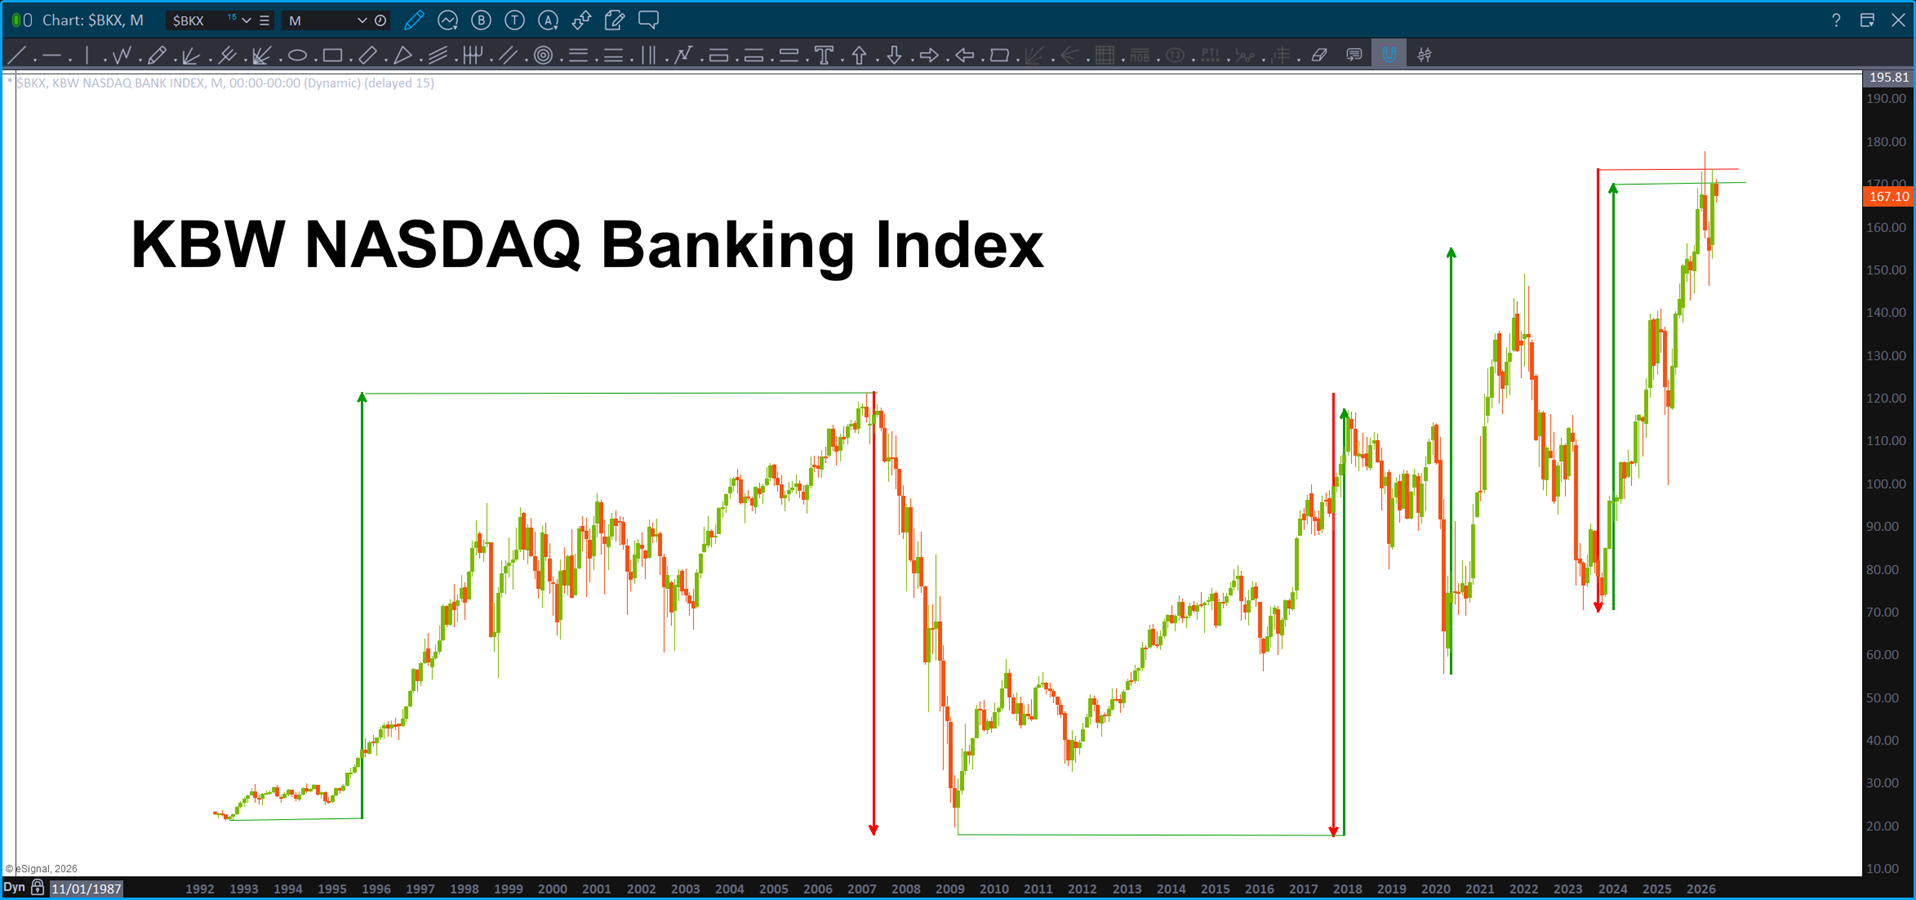
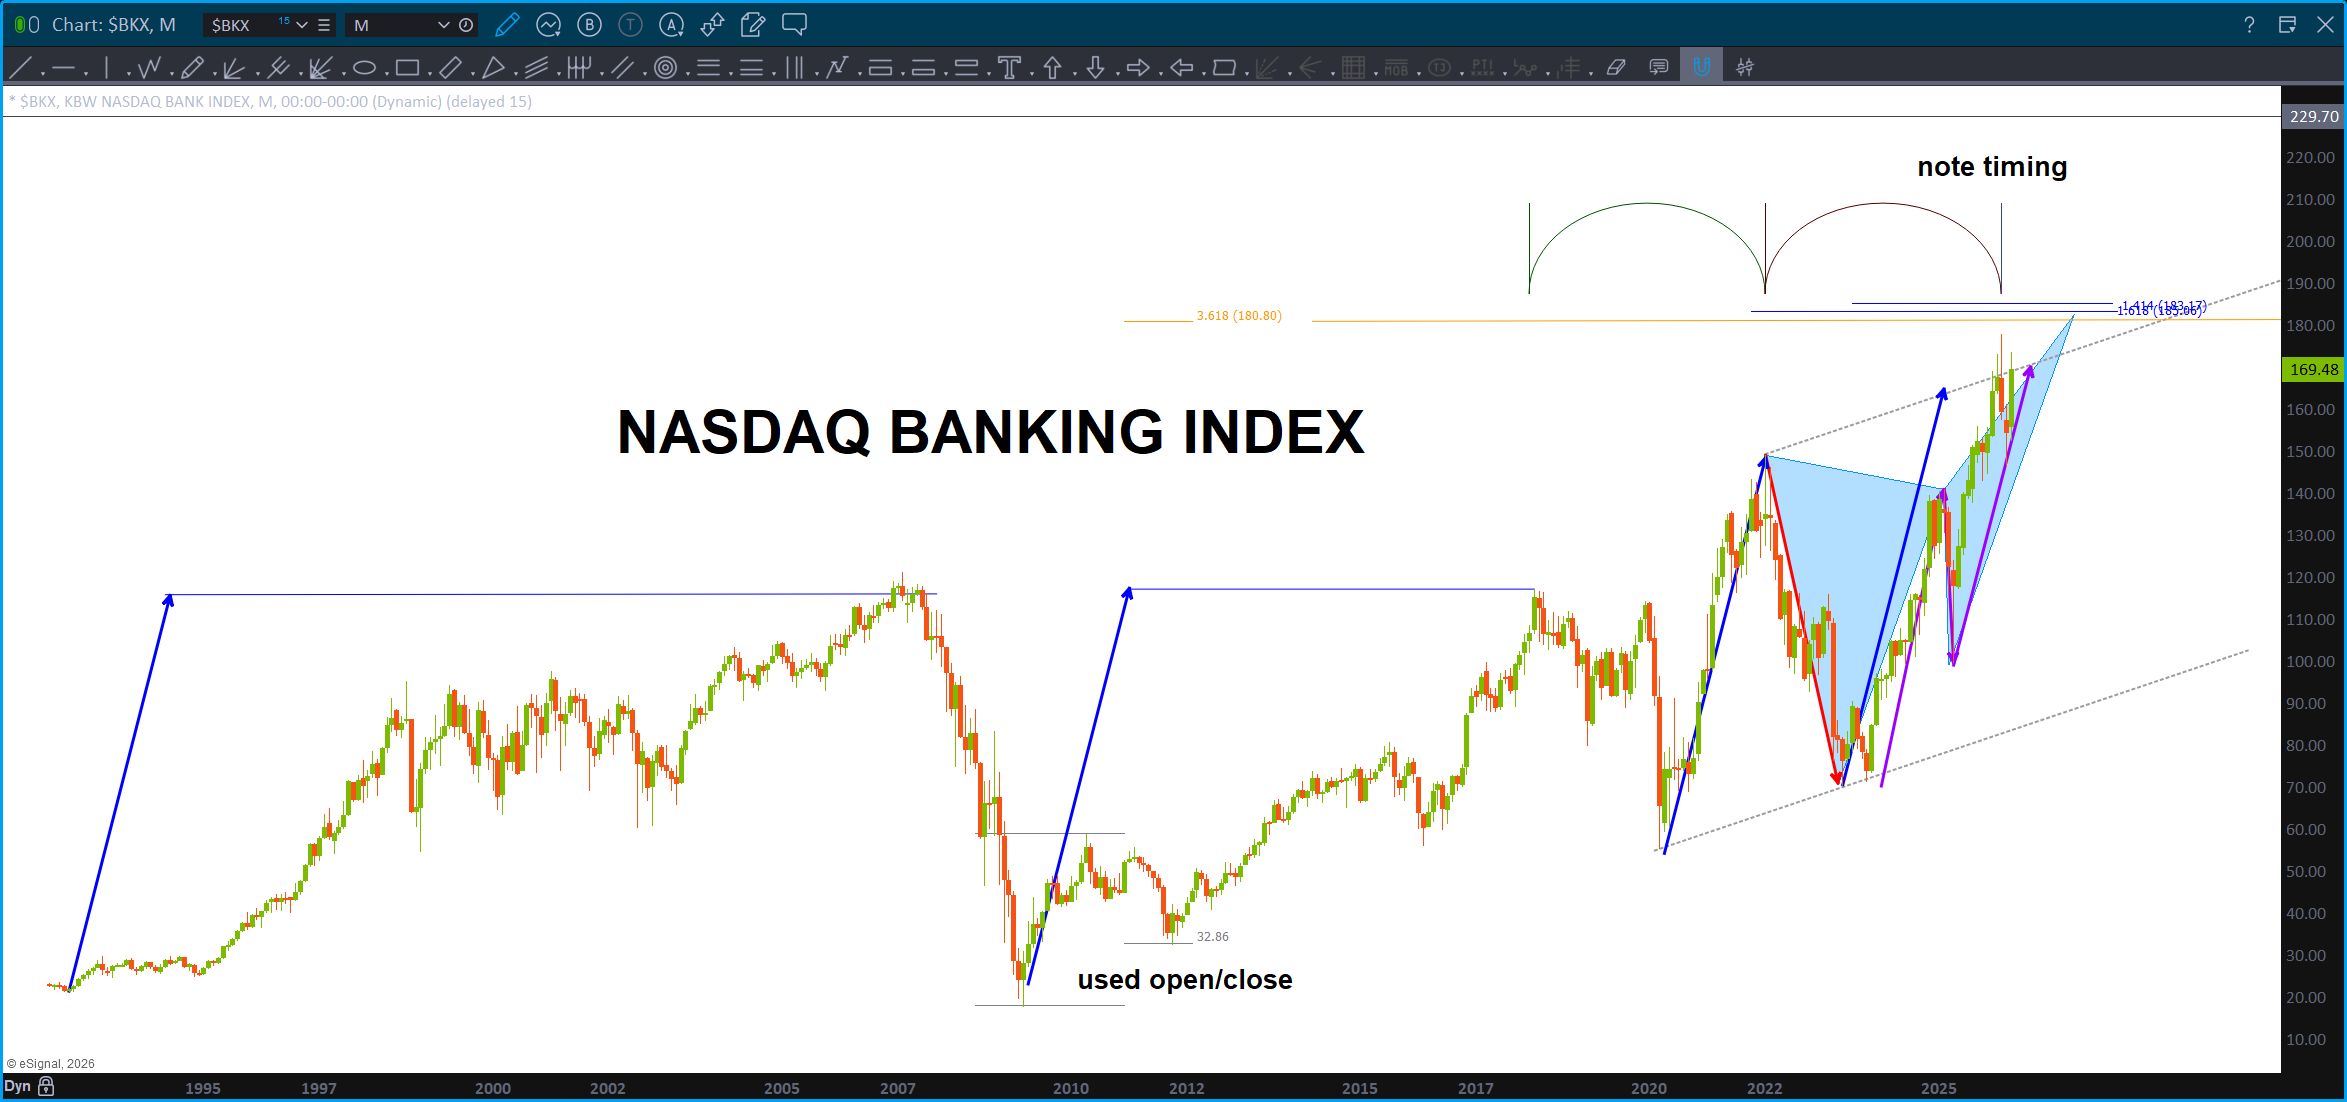
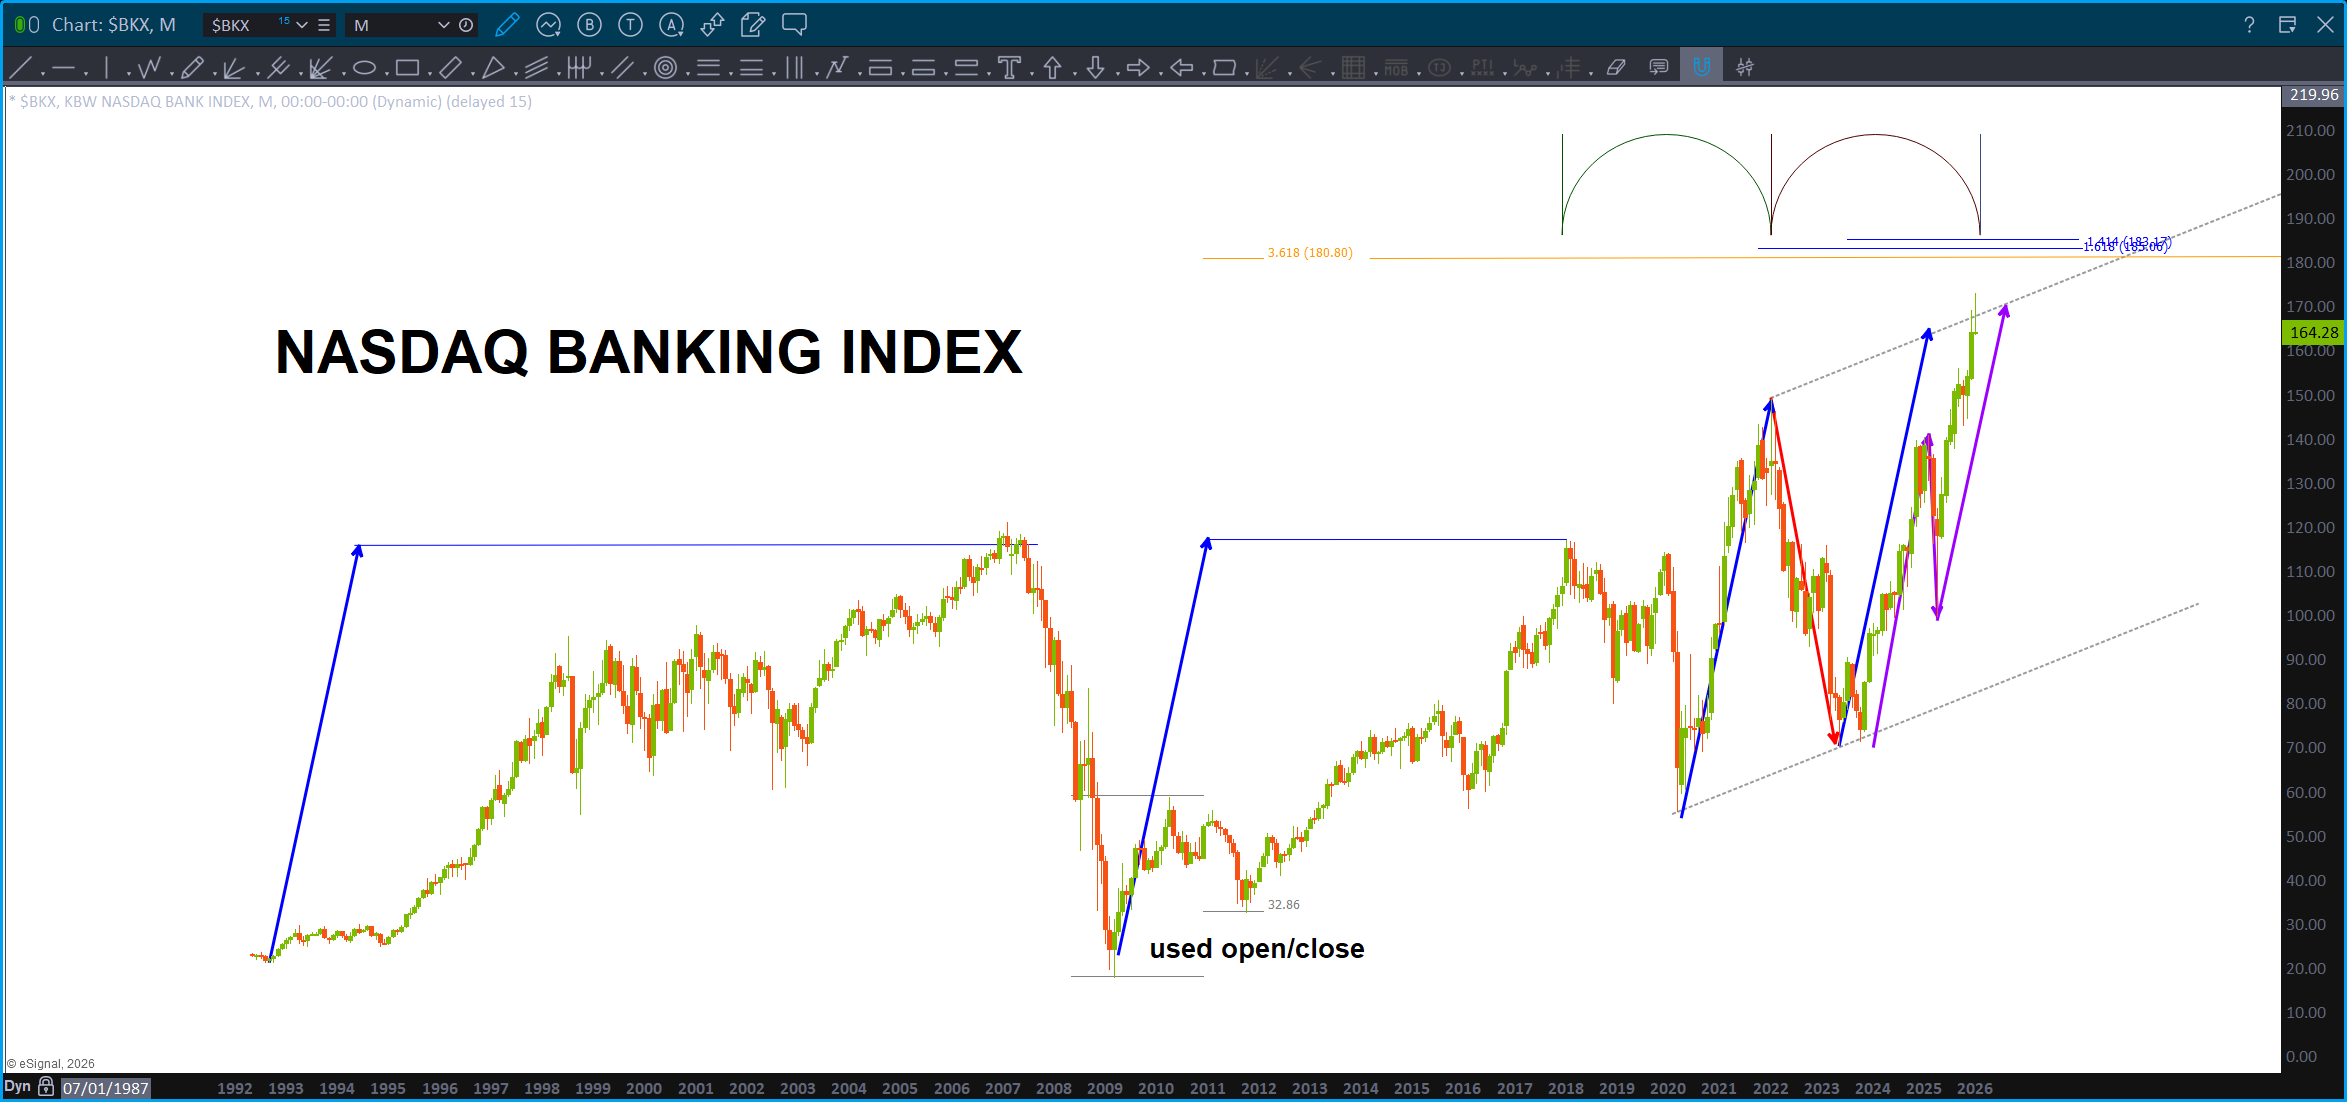
We watch the Banks … you’ve seen me type this and speak this before “just watch the banks .. they lead us up and they lead us down.” Well, they have completed their bullish measured moves and each time after that, the banks/financials corrected and the entire market followed. Here is the KBW NASDAQ Banking Index .. no new highs and largest measured moves in the history of this index: complete.
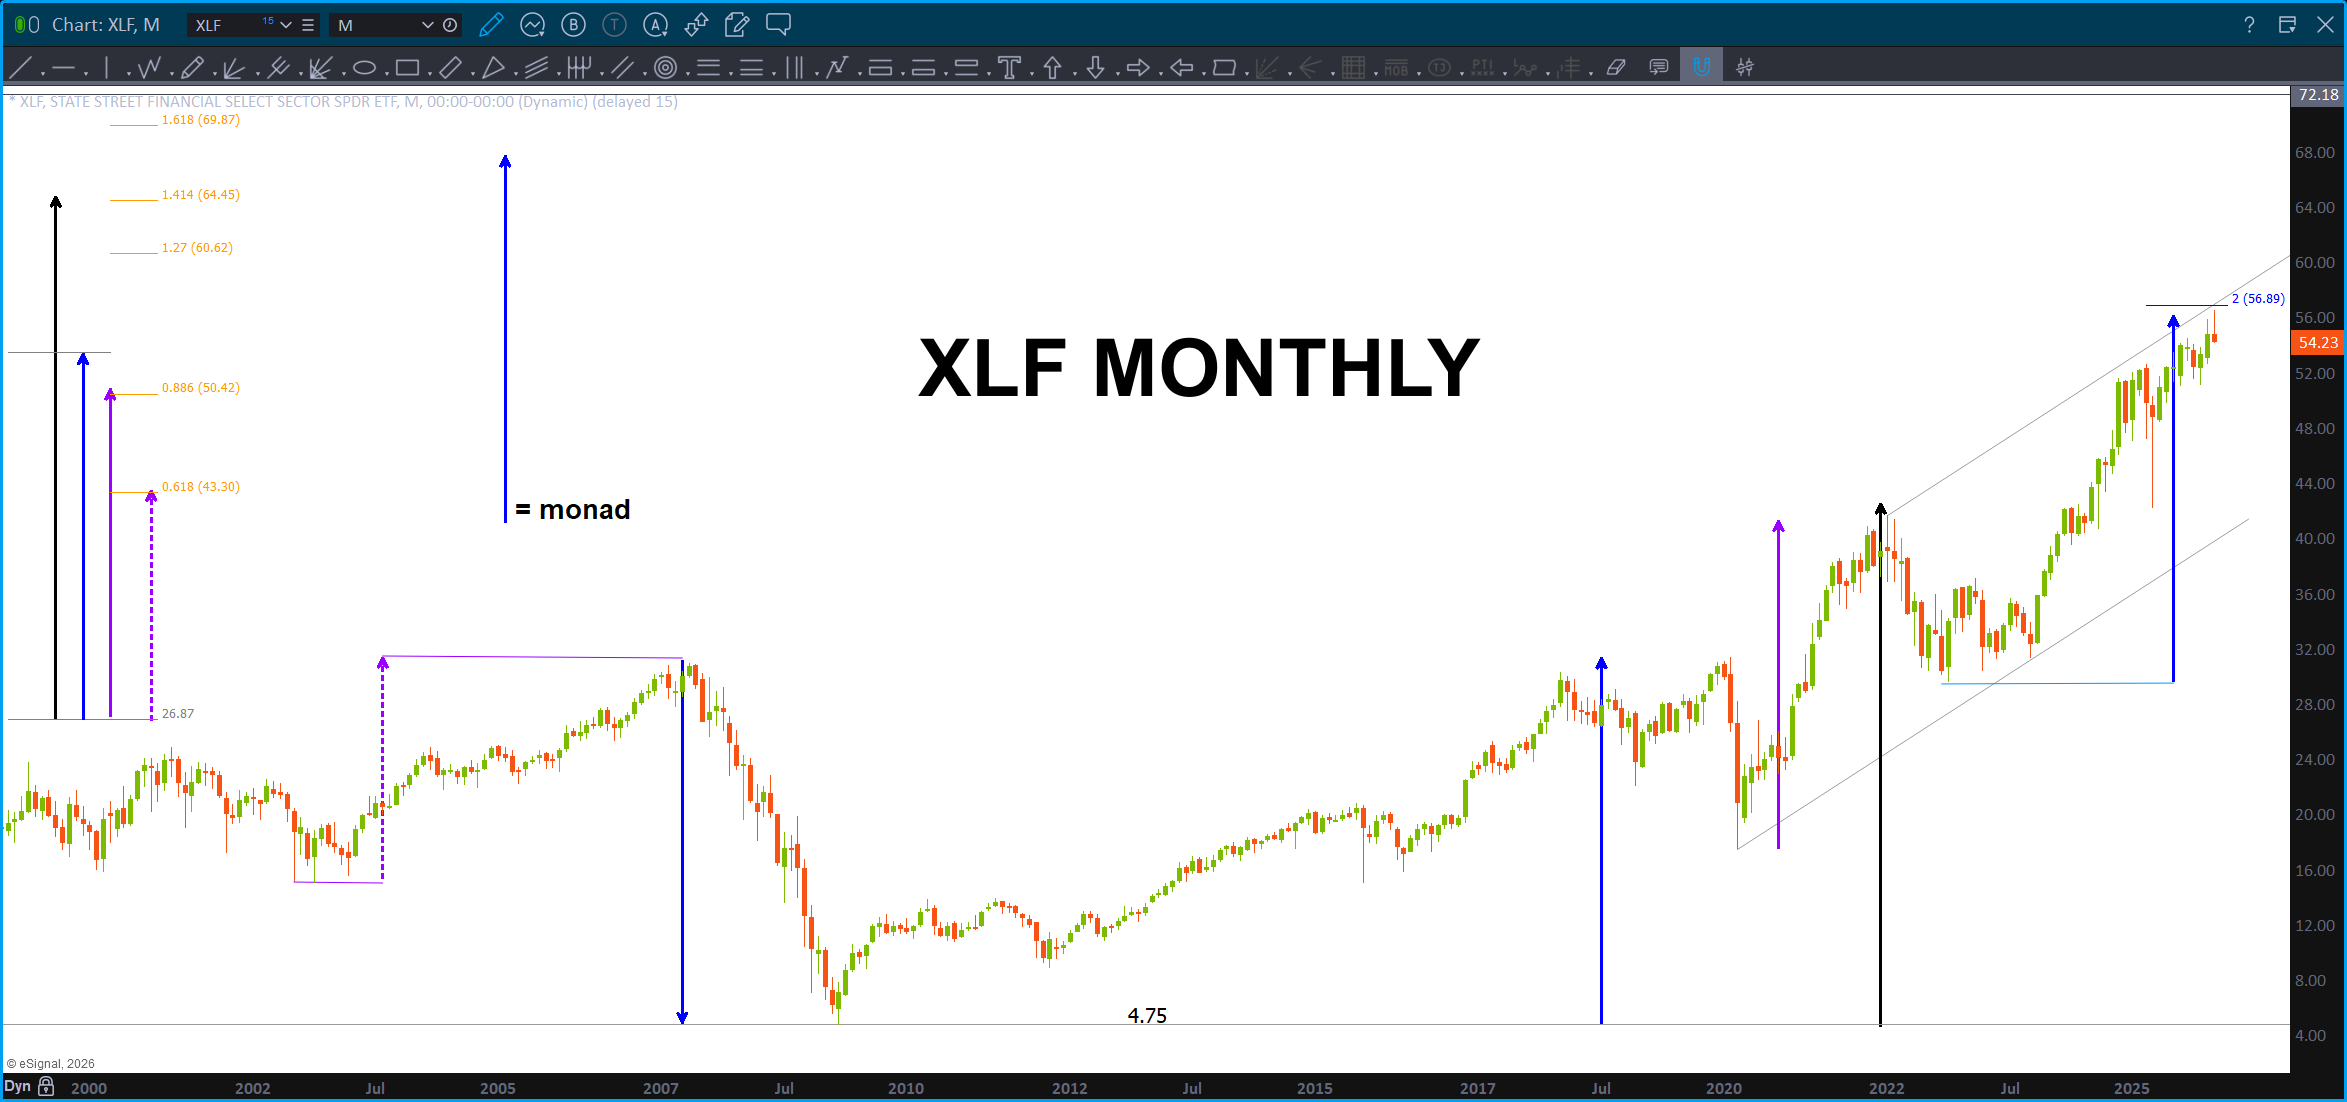
If you have followed me for a while, then you know I love to check out the patterns and measured moves on the XLP/ NYA ratio. Folks, remember, the low in the ratio was a perfect LOG price and time projection. Here’s the latest kicker … it’s completing the same exact pattern as it did in 2007. Yeah, no kidding check it out:
IF we were tremendously bullish, then I would expect this ratio to be falling pretty nicely … it’s making higher lows. And, the red moves up and down are exactly the same. Probability would tell us that the next move is higher in the ratio which tells us – weakness in stocks. 2007 weakness…? I have no clue but ‘should’ be some resistance …
Which leads us to the S&P 500 – folks, it’s simply finishing the next measured move:
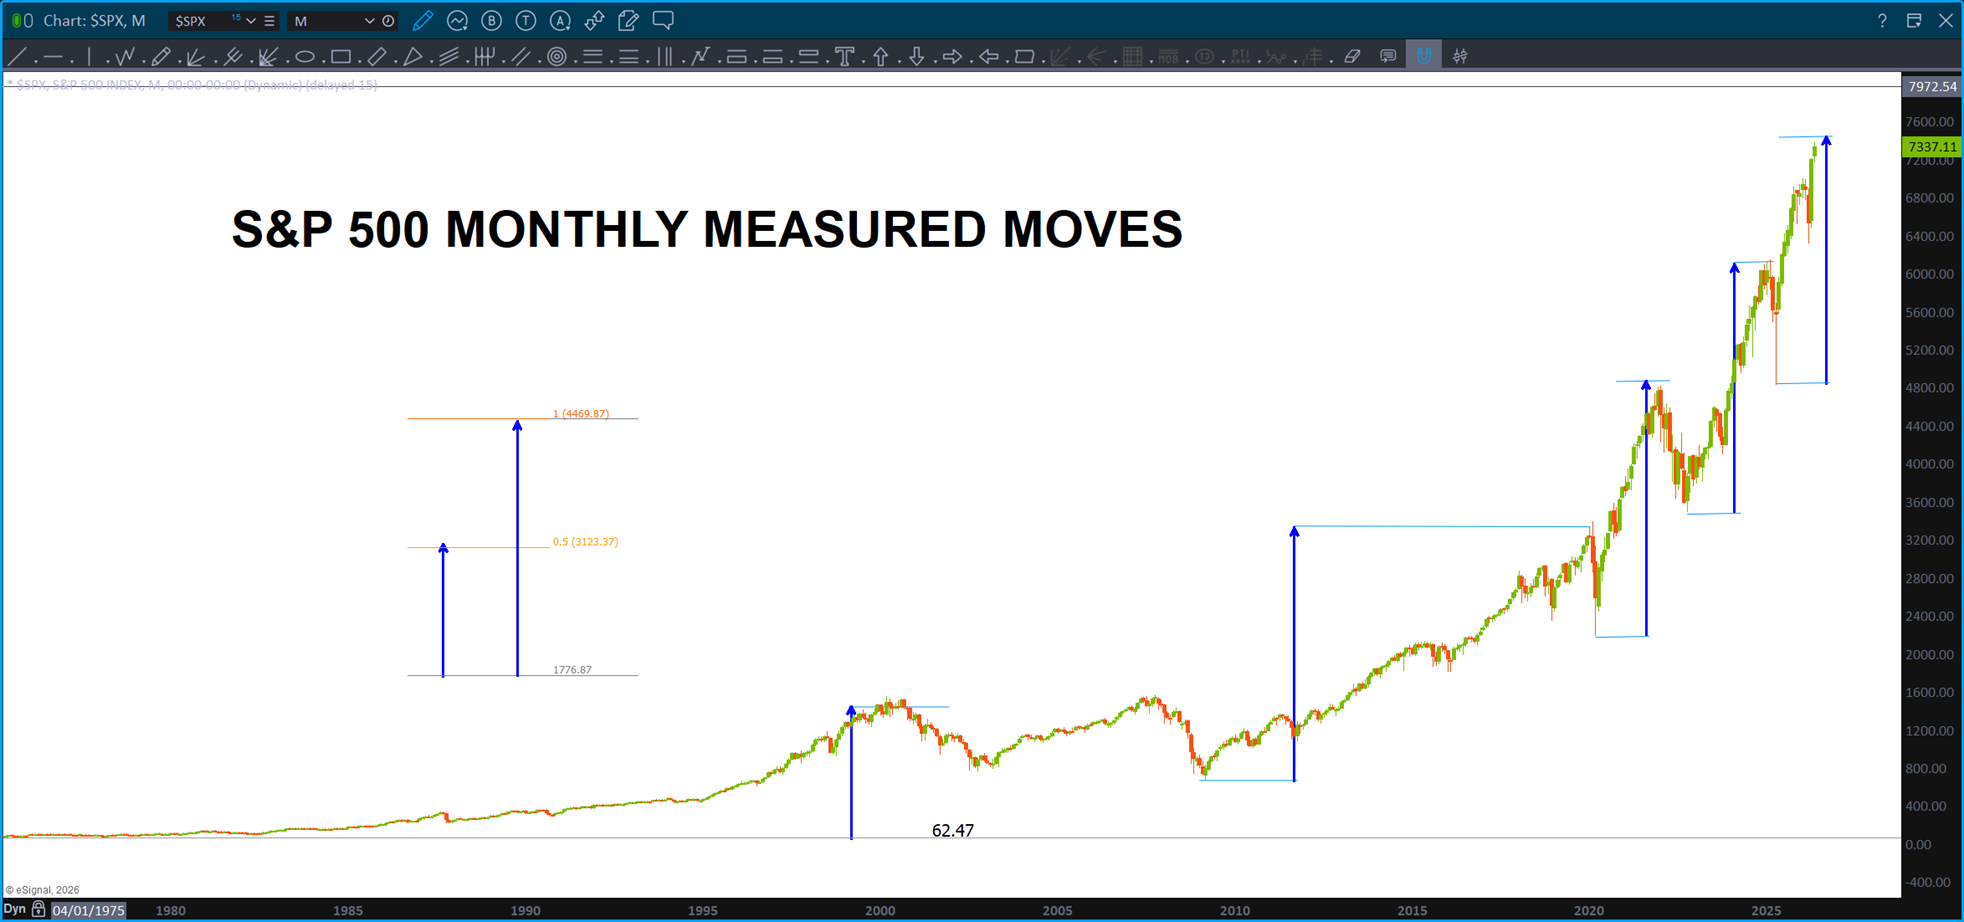
Since the low in 2007 … every major move higher has run into significant resistance when completing a price move equal to the blue measured move. The move from the all time low to the high in 2000 … 0.618 of the blue measured move (or the monad – I’ll stop there)
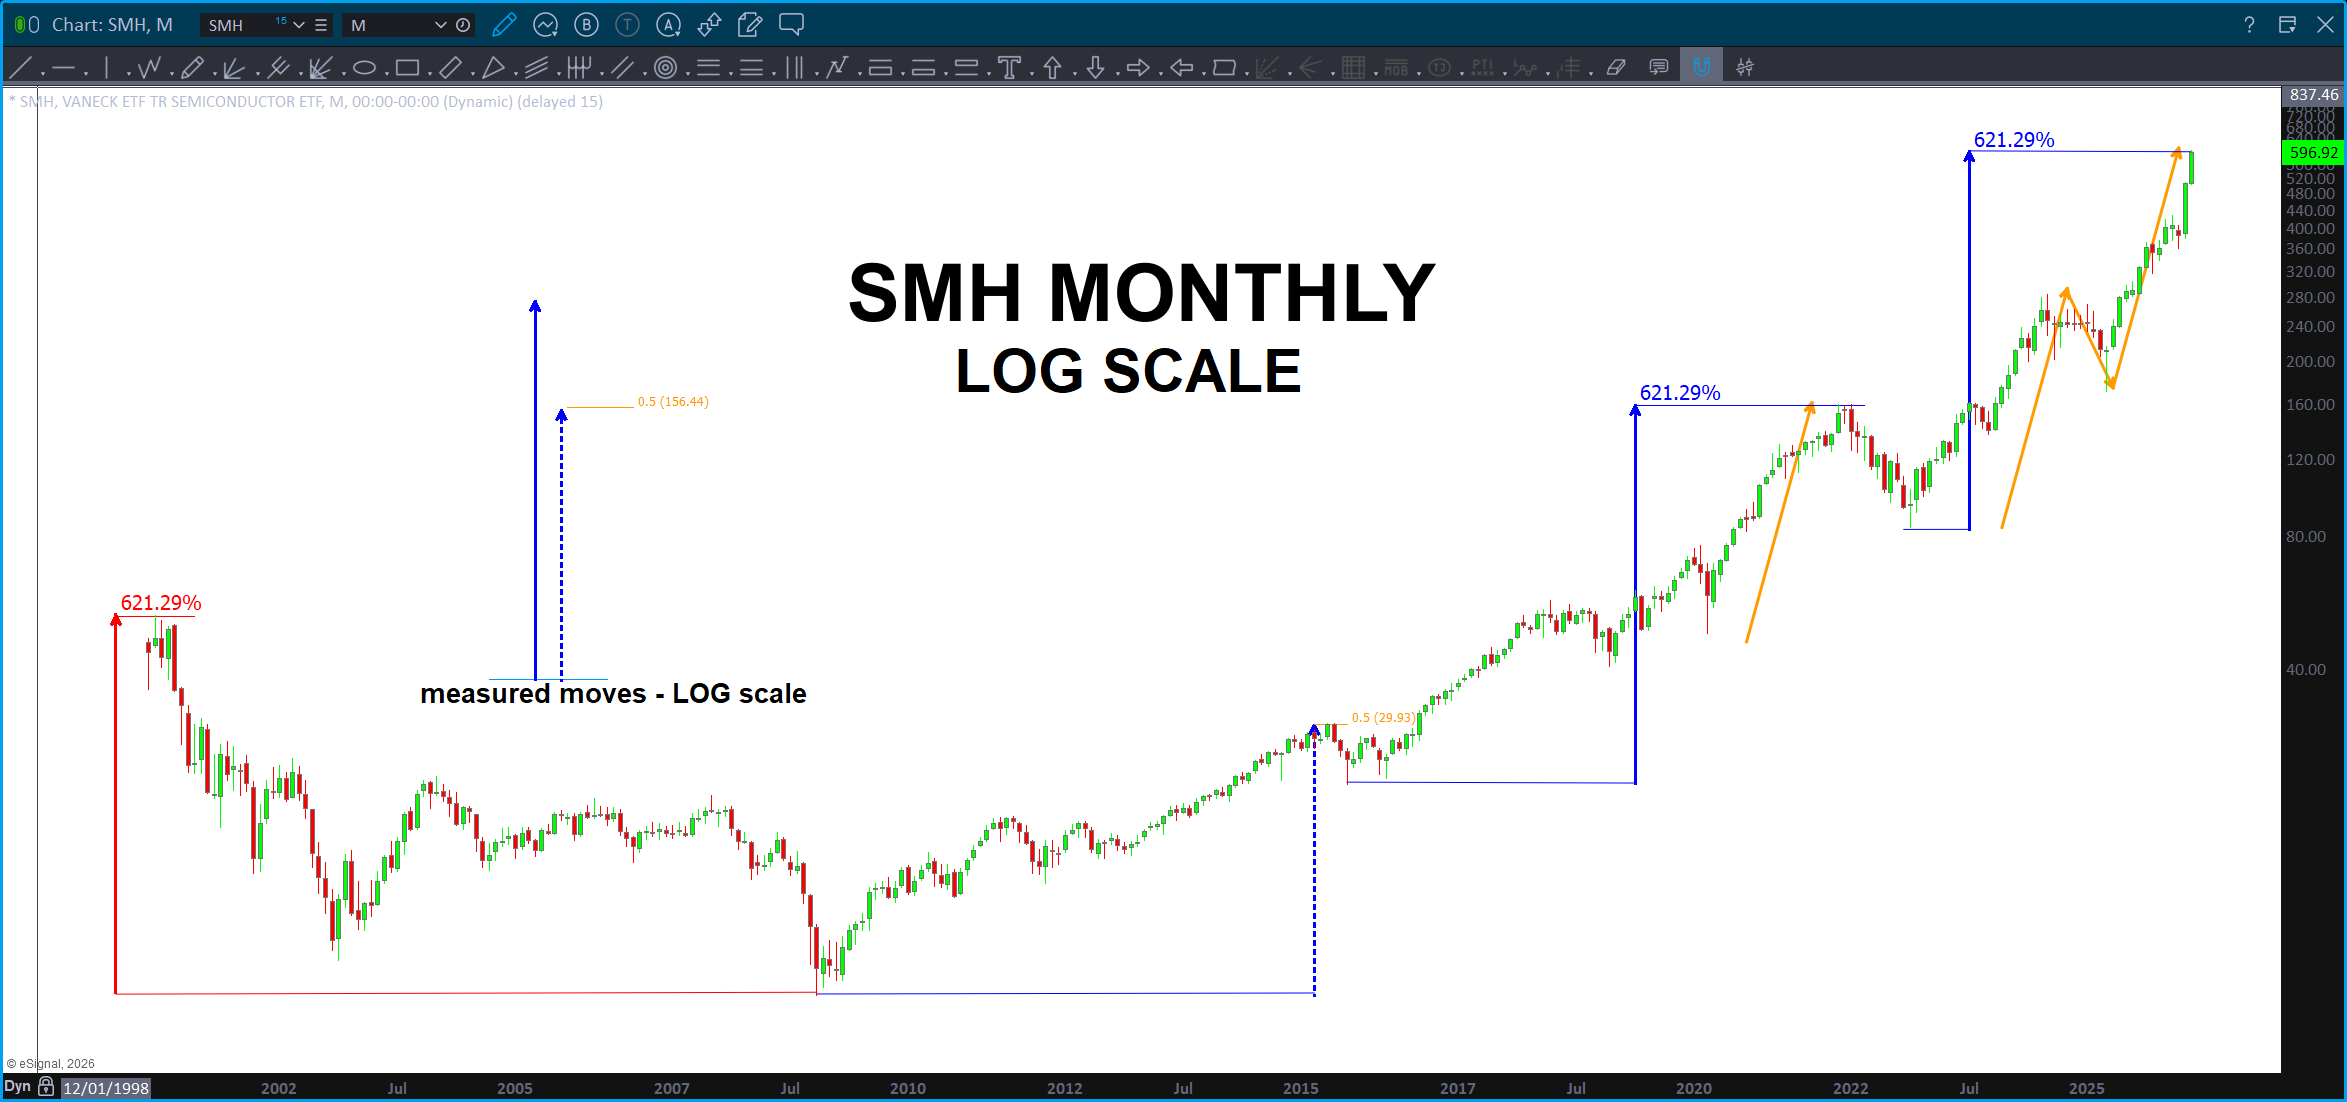
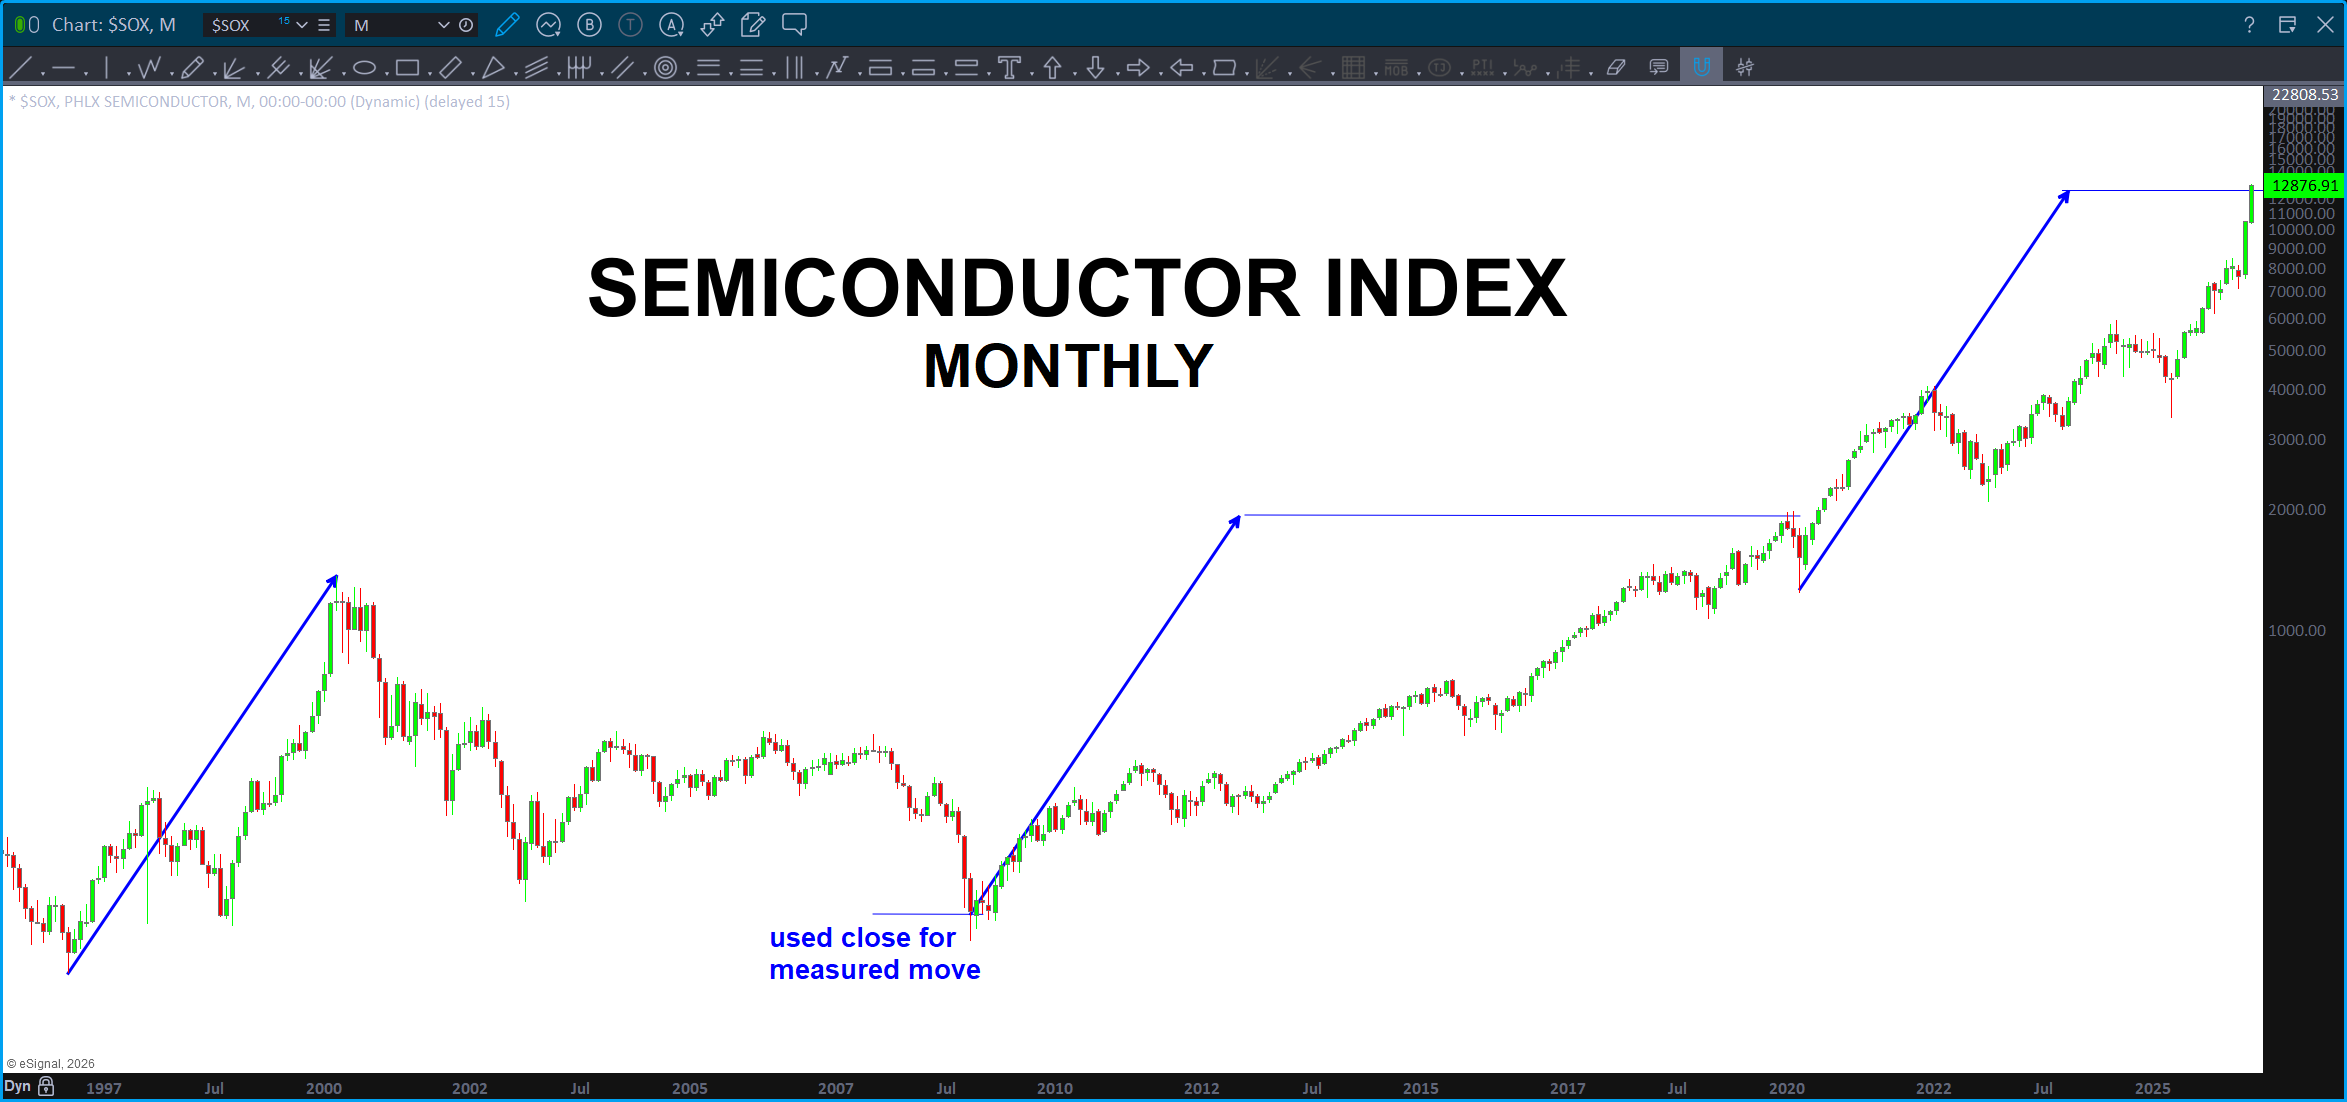
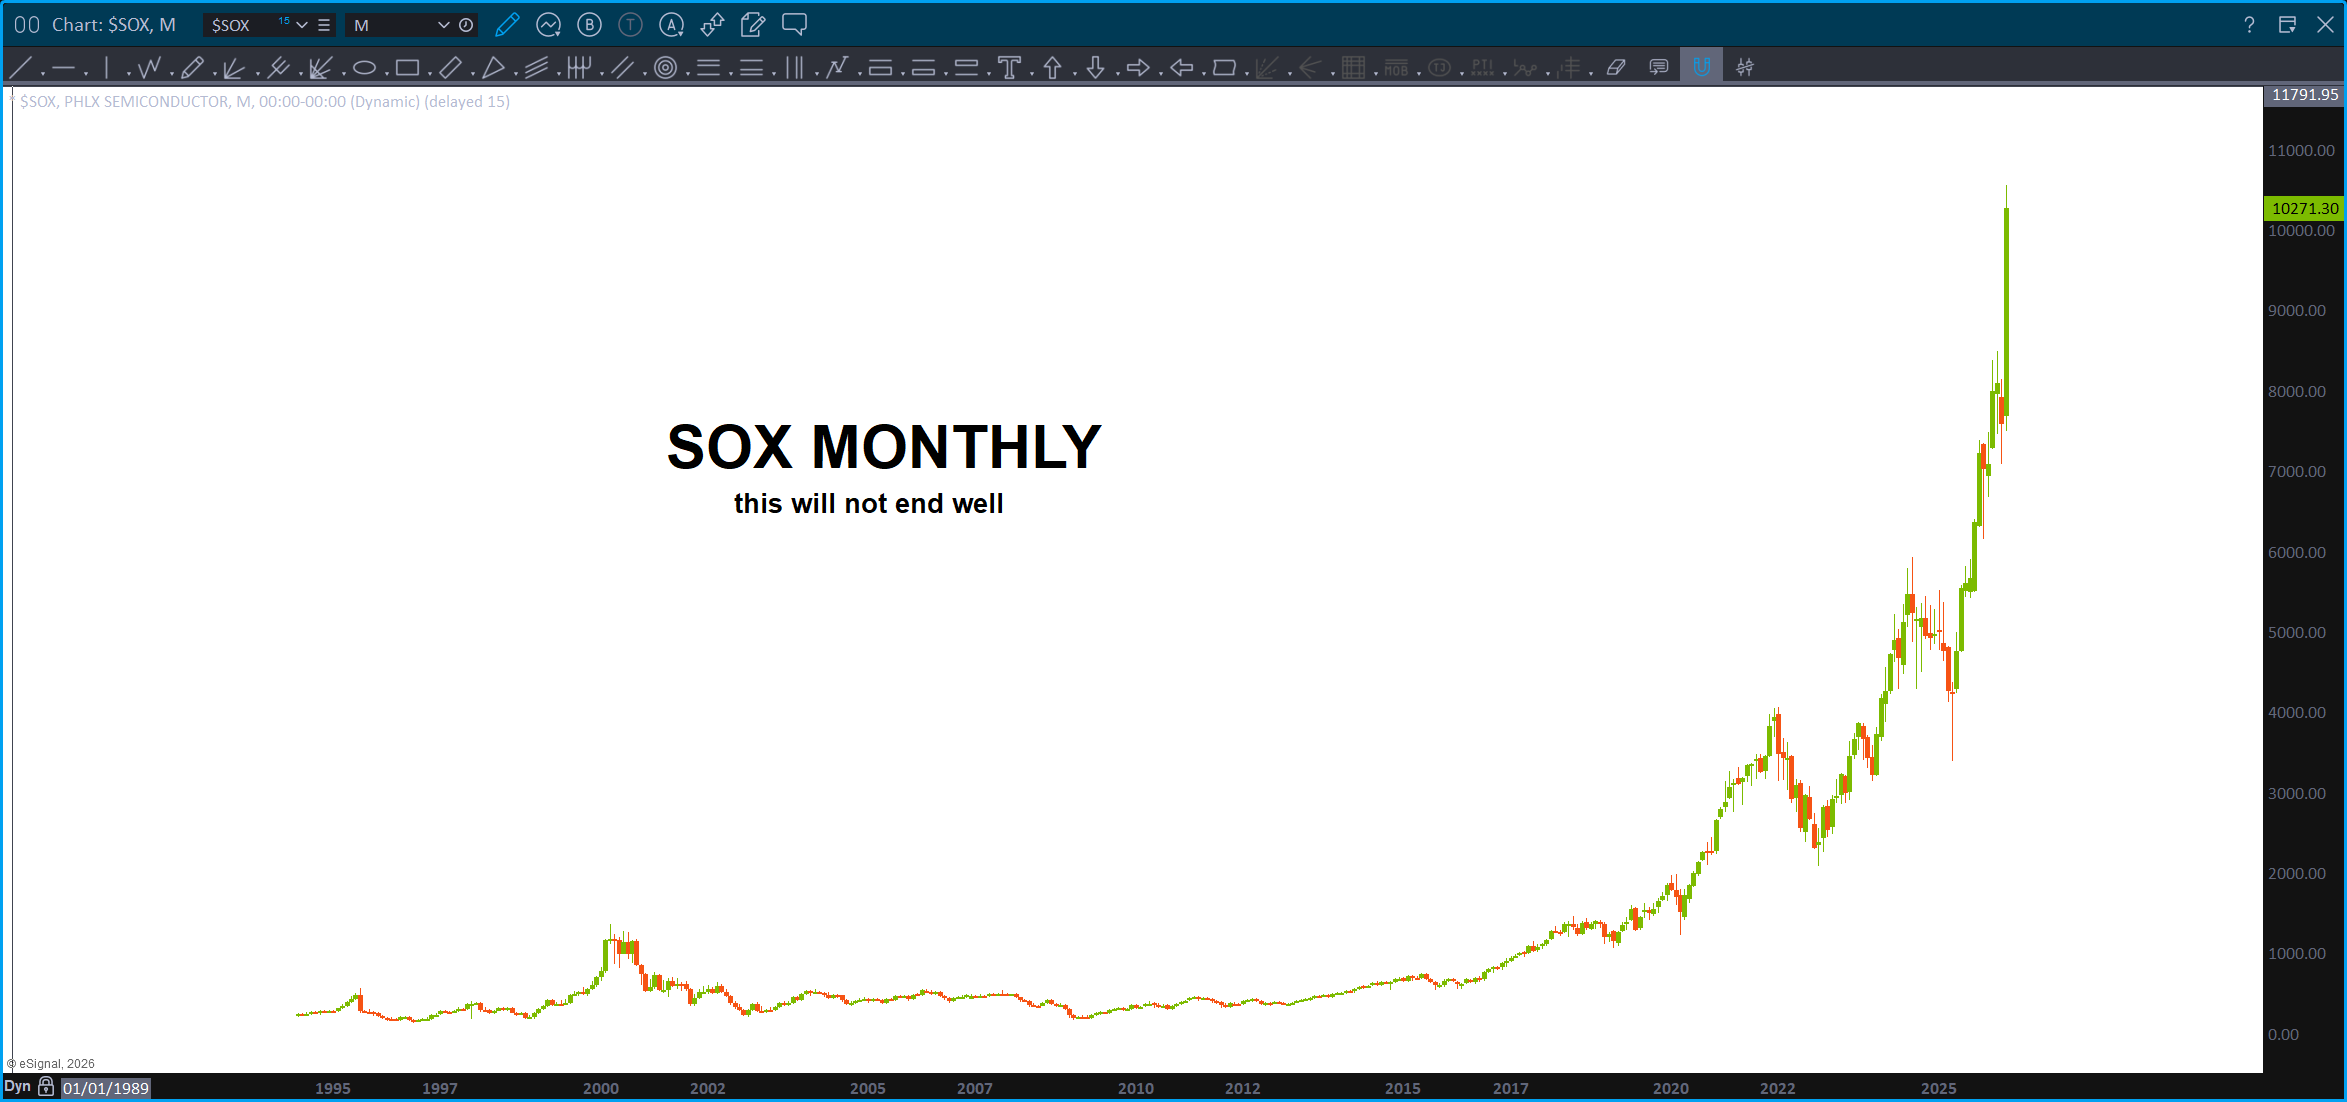
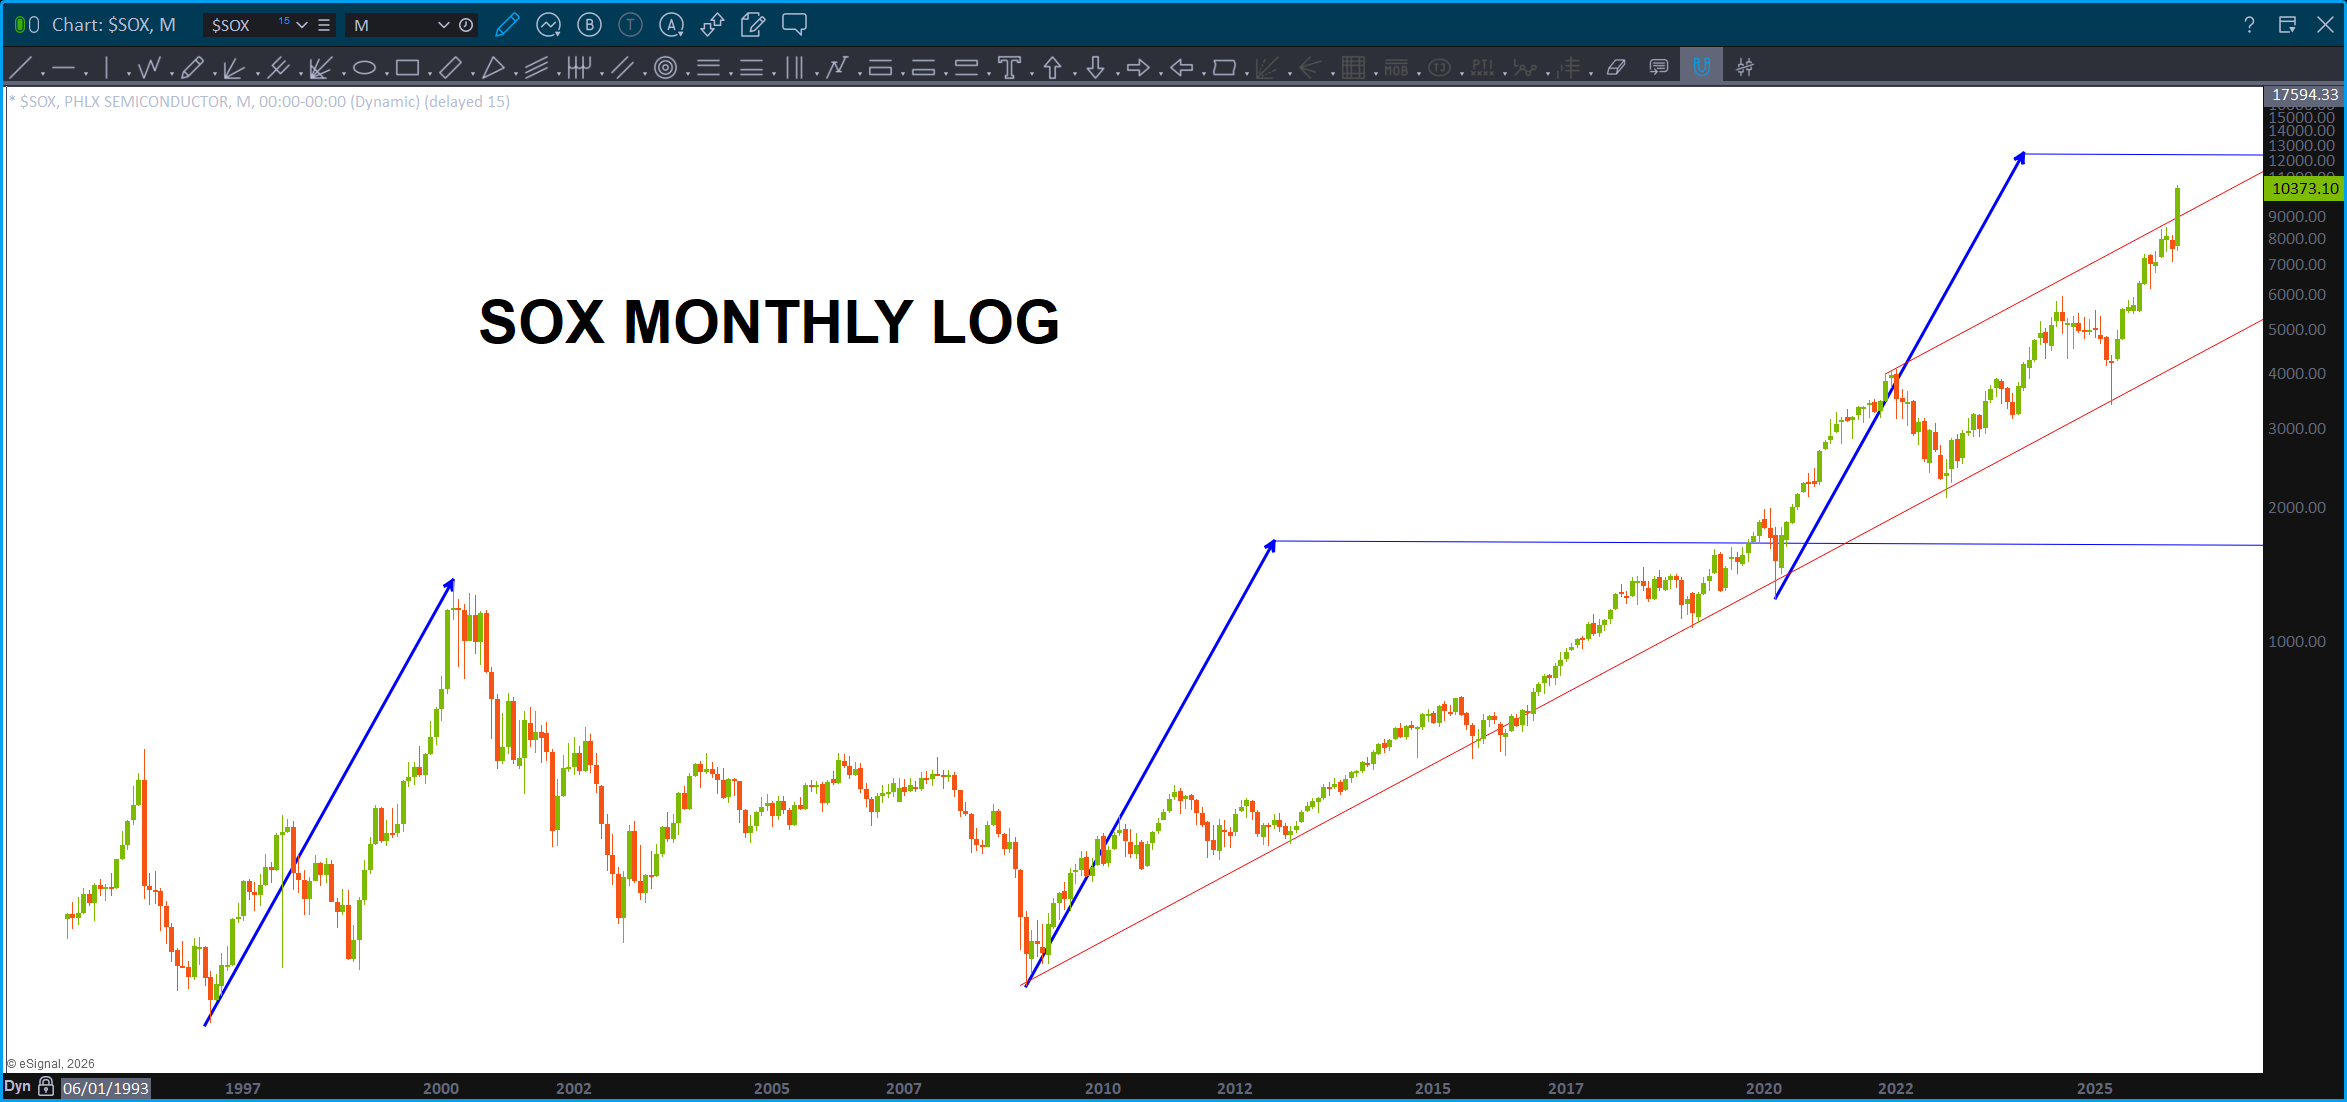
How about the Semi-conductors. Ding Ding measured move arriving. Note, as the buying intensifies the measured moves expand from the initial monad, moving to the next geometric nodal intersection in the platonic space which is naturally corresponding to the gold mean 1.618 and music. Tilt? What …
The frequency of a string is proportional to the square root of its tension, inversely proportional to its length, and inversely proportional to the square root of its linear mass density (mass per unit length).
So, square roots and inverses have a direct relationship to the vibration or frequency of a string … square root of 1.618 = 1.27.
The Golden Mean and music … note, the measured move of the DJ Transports has expanded 1.27 of the Monad. Just like everything in creation vibrates to create geometries found w/in the platonic space attractors, the same thing happens w/in the vibratory energy of fear and greed of the masses. It’s harmonic and fractal based on the golden mean and sacred geometry. It has to be …
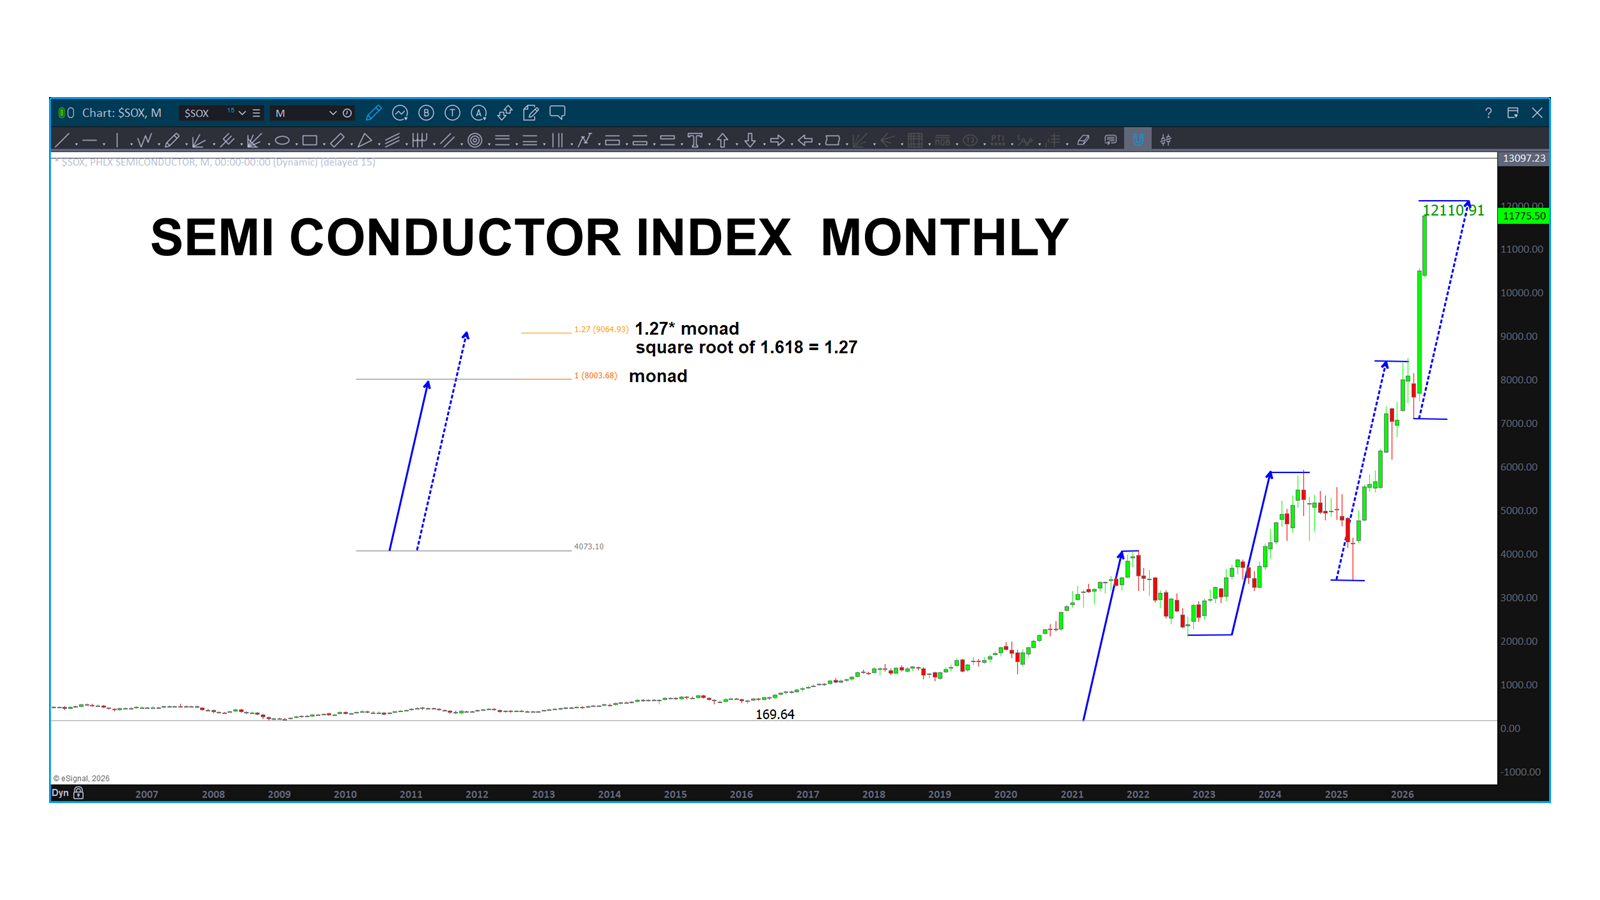
Looks like 12, 110 ‘ish’ should offer resistance …
Last, the NASDAQ … ABCD from the all time low.
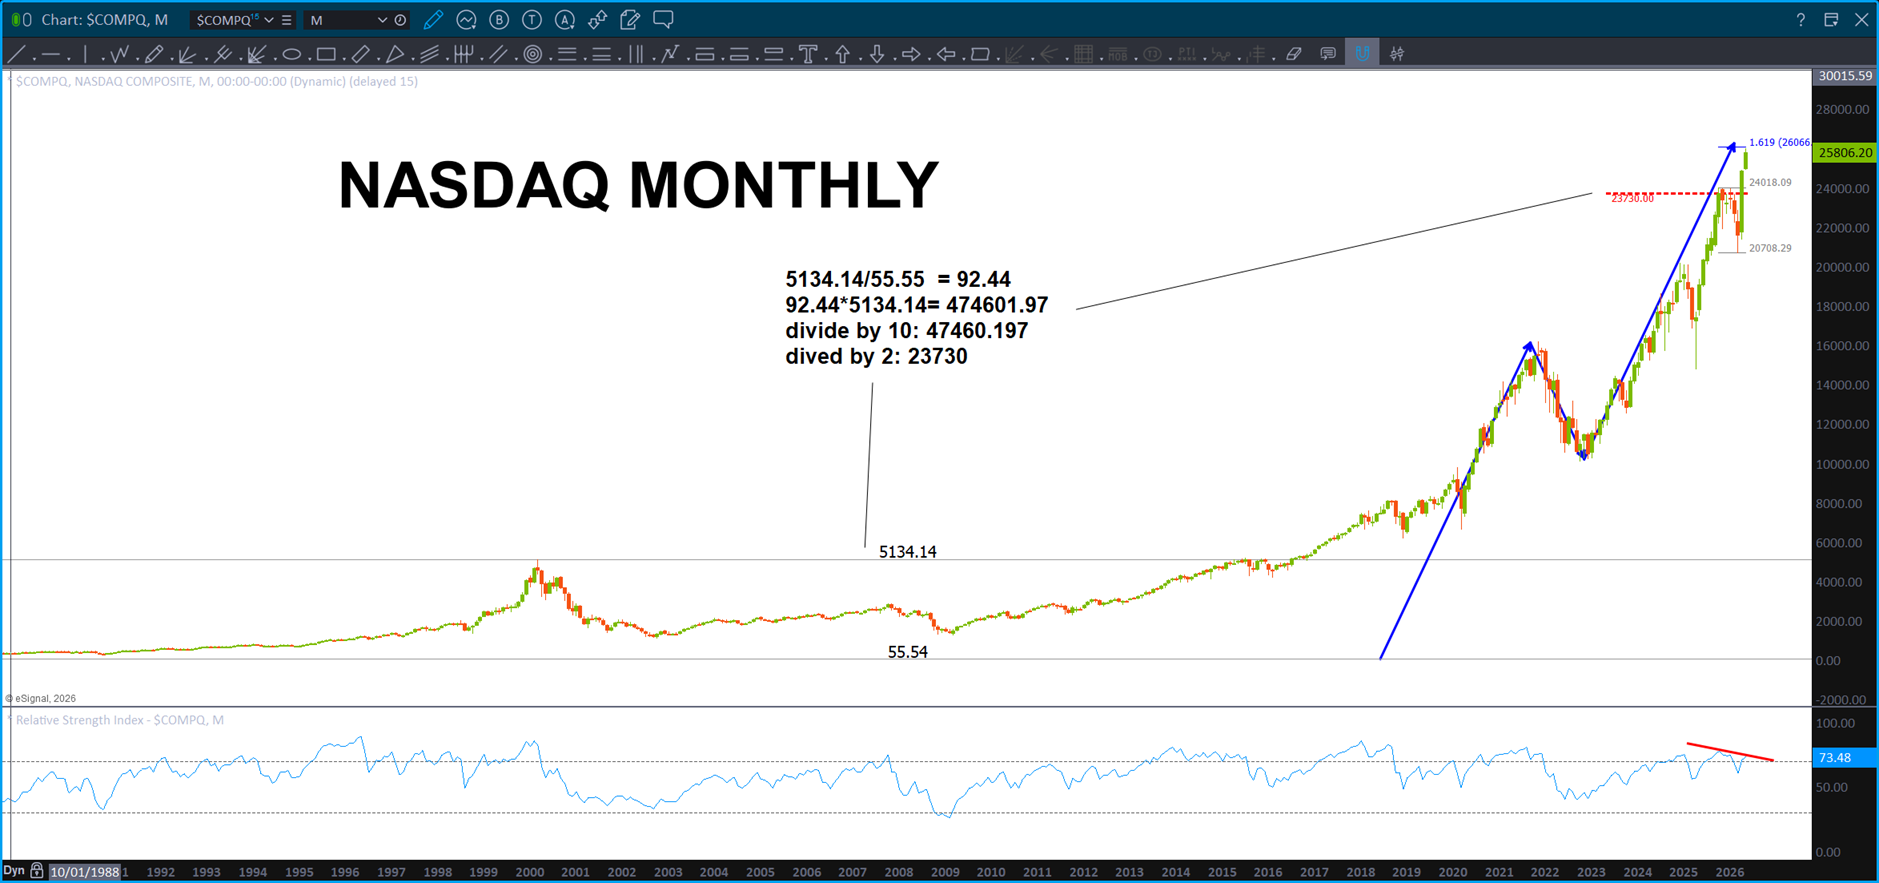
Market has hit resistance and corrects – looking for a double digit CORRECTION for now. If aggressive WAIT fora weekly signal reversal candle or weekly bearish engulfing panel to short.
If long and nicely long, stay long but keep in mind that we have hit and are hitting some MAJOR targets so … put a mental stop in place. I know we all expect and think the market can never go down and, if it does, I’ll just ride it out might not be the best position to take if things REALLY start selling off. So … I’ll be looking to BUY at a MONTHLY measured move level. Why? That is the predominant cycle level we are hitting right now. (hint hint, if you haven’t figure it out, the measured move is ultimately a ‘cycle’ finder because there ARE harmonic cycles present at the end of these longer term month measured moves – hence monthly cycles. 🙂
Market has hit resistance, doesn’t care and parabolically explodes higher. Completely doable … why? Where else is the WORLD going to go … look outside our borders and things are getting quite messy in Asia and Europe. Capital needs to flow somewhere … hello USA.
Here’s the last slide of my deck. I bet he doesn’t show it … I am SO thankful for my time w/ Mr. Alan W. Green. Everything occurring makes sense …he is the one who has opened my eyes to the script being played out right in front of us …
The amazing irony as the USA approaches its 250th birthday and the exact 400 year anniversary of the publishing of The New Atlantis by John Dee. (John Dee being the potential author of Shakespeare and called himself 007 – not kidding) He demanded, before he died, that it be published on July 4th, 1626. 400 years ago … 400 is the number w/ regards to size and distances of the sun and moon which, ultimately, signify the Divine Masculine and the Divine Feminine and that is WHY they are able to make an eclipse and become ONE.
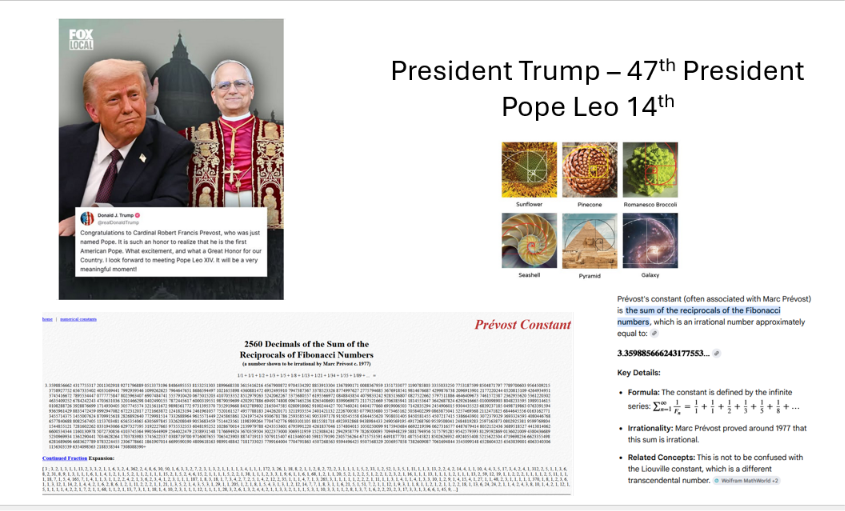
Anyway … what are the chances that the 47th President (Iran has been at war for us for how man years? Oh yeah, that is righ – 47! When was the Roswell UFO crash? July 4th, 1947. Look it up … ) and the current Pope are not only both Americans but their numbers are important. Tilt, again?
Sure, divide 47/14 … you get the Prevost Constant. Pope Leo 14th is … Robert Edward Prevost.
When the 47th President and the 14th Pope emerged simultaneously, their ordinal positions divided to trace the Prévost Constant — the infinite sum of all Fibonacci reciprocals, a number that encodes the totality of nature’s own sequence. In this, the universe whispers that these two men do not merely hold office, but occupy resonant positions in a deeper mathematical order, their tension and opposition the living expression of growth against convergence, expansion against wholeness.

Pay attention to EXTREMES April 29, 2026

Just saying folks …
INTC – really? I mean look at that move !! It blew thru the ABCD but has now hit the EXTREME measured move that took the mania into the tech high of the 2000’s … hmmmmm. I’ve got some extension and projection targets higher as shown BUT the point is, look at that EXTREME move …hmmm.
But wait, there’s more! Anyone seen or heard about the Dow Jones Transportation Average?
and, well look at that, here comes the price of gasoline! What an EXTREME move …
So, from a socio-economic perspective I just wonder, what the underlying vibration is to cause such EXTREME behavior. Not sure anyone remembers but just a few weeks ago we had a planetary parade and a major alignment of many of our planets … I’ll let you draw your own conclusions from that statement.
Perhaps, to put in my good friend, Ponch’s parlance, perhaps some sort of ‘outside behavior’ was given a snapshot in time to reorient us into extremes.
We’ve seen these patterns before my friends. You know it and you feel it.
If you are long and have been running w/ the bulls I’d stay w/ it … there is a probable (flip the coin) chance this puppy could explode in a parabolic lift off.
If you are trying to chase it and get in … i wouldn’t enter here. People who have been long will have an opportunity to evaluate a stop loss and control losses IF this is a big pullback. Getting in now, COULD be like getting in right at or near the top. Sorry, might need to wait this out and go look at Bonds or some commodity plays,. (Silver and Gold are going to make new highs again .. I”m watching that one closely, just haven’t been posting about it. Just not yet is what I’m thinking ..we’ll know in a week or two. This will – more than likely be a BIG MOVE just due to the geopolitical nature around us.
For those looking to short, just have to be patient. Just waiting on a GOOD LONG TERM sell pattern. And that’s the point. A LOT of the long term patterns to short the market have failed. So, don’t be surprised if this market propels higher. Just have to wait.
And, one last example. KABOOM and off we go … show me – one time – where a take off like this has not led to a spectacular crash. Folks, it’s taking off parabolic so, again, if your riding this wave stay on it – it could go for a year or more w/ this chaos and emotion BUT be quick to bail because it’s close to some targets. Else, just wait … off she goes!
Markets – April 27, 2026

BLUF: I am still in a defensive mindset and will remain so until a SELL PATTERN is triggered on the XLP/NYA or the low that was made a few weeks ago is taken out to the downside.
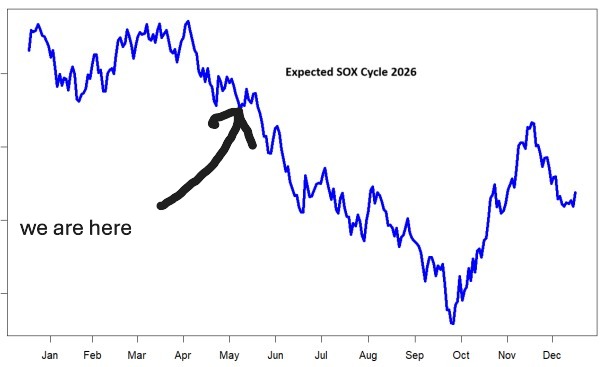
The technology sector continues to launch into the upper limits of a historic run. My good friend, Larry P (www.tradingtutor.com) put out his weekly newsletter and yesterday he wrote:
“The Sox index has been up 18 days in a row. The odds of this
happening are over 300 to 1. The S&P 500 broke all records this
week by going up for 15 days in a row. That’s the most since
records began in 1897. In the last 126 years, it’s only happened
four times.”
He also put out this chart around the ‘expected’ cycles for the rest of the year:
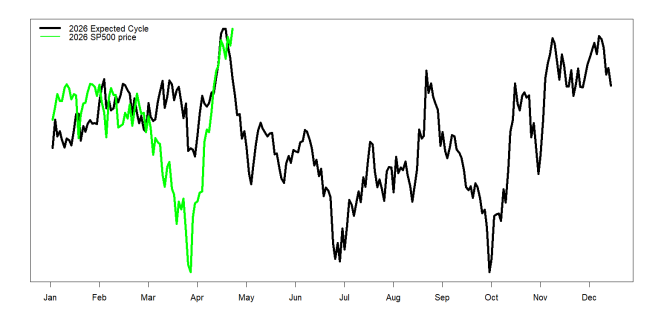
Here’s the expected cycle for the S&P 500:
So, when we look at the NASDAQ what do we see:
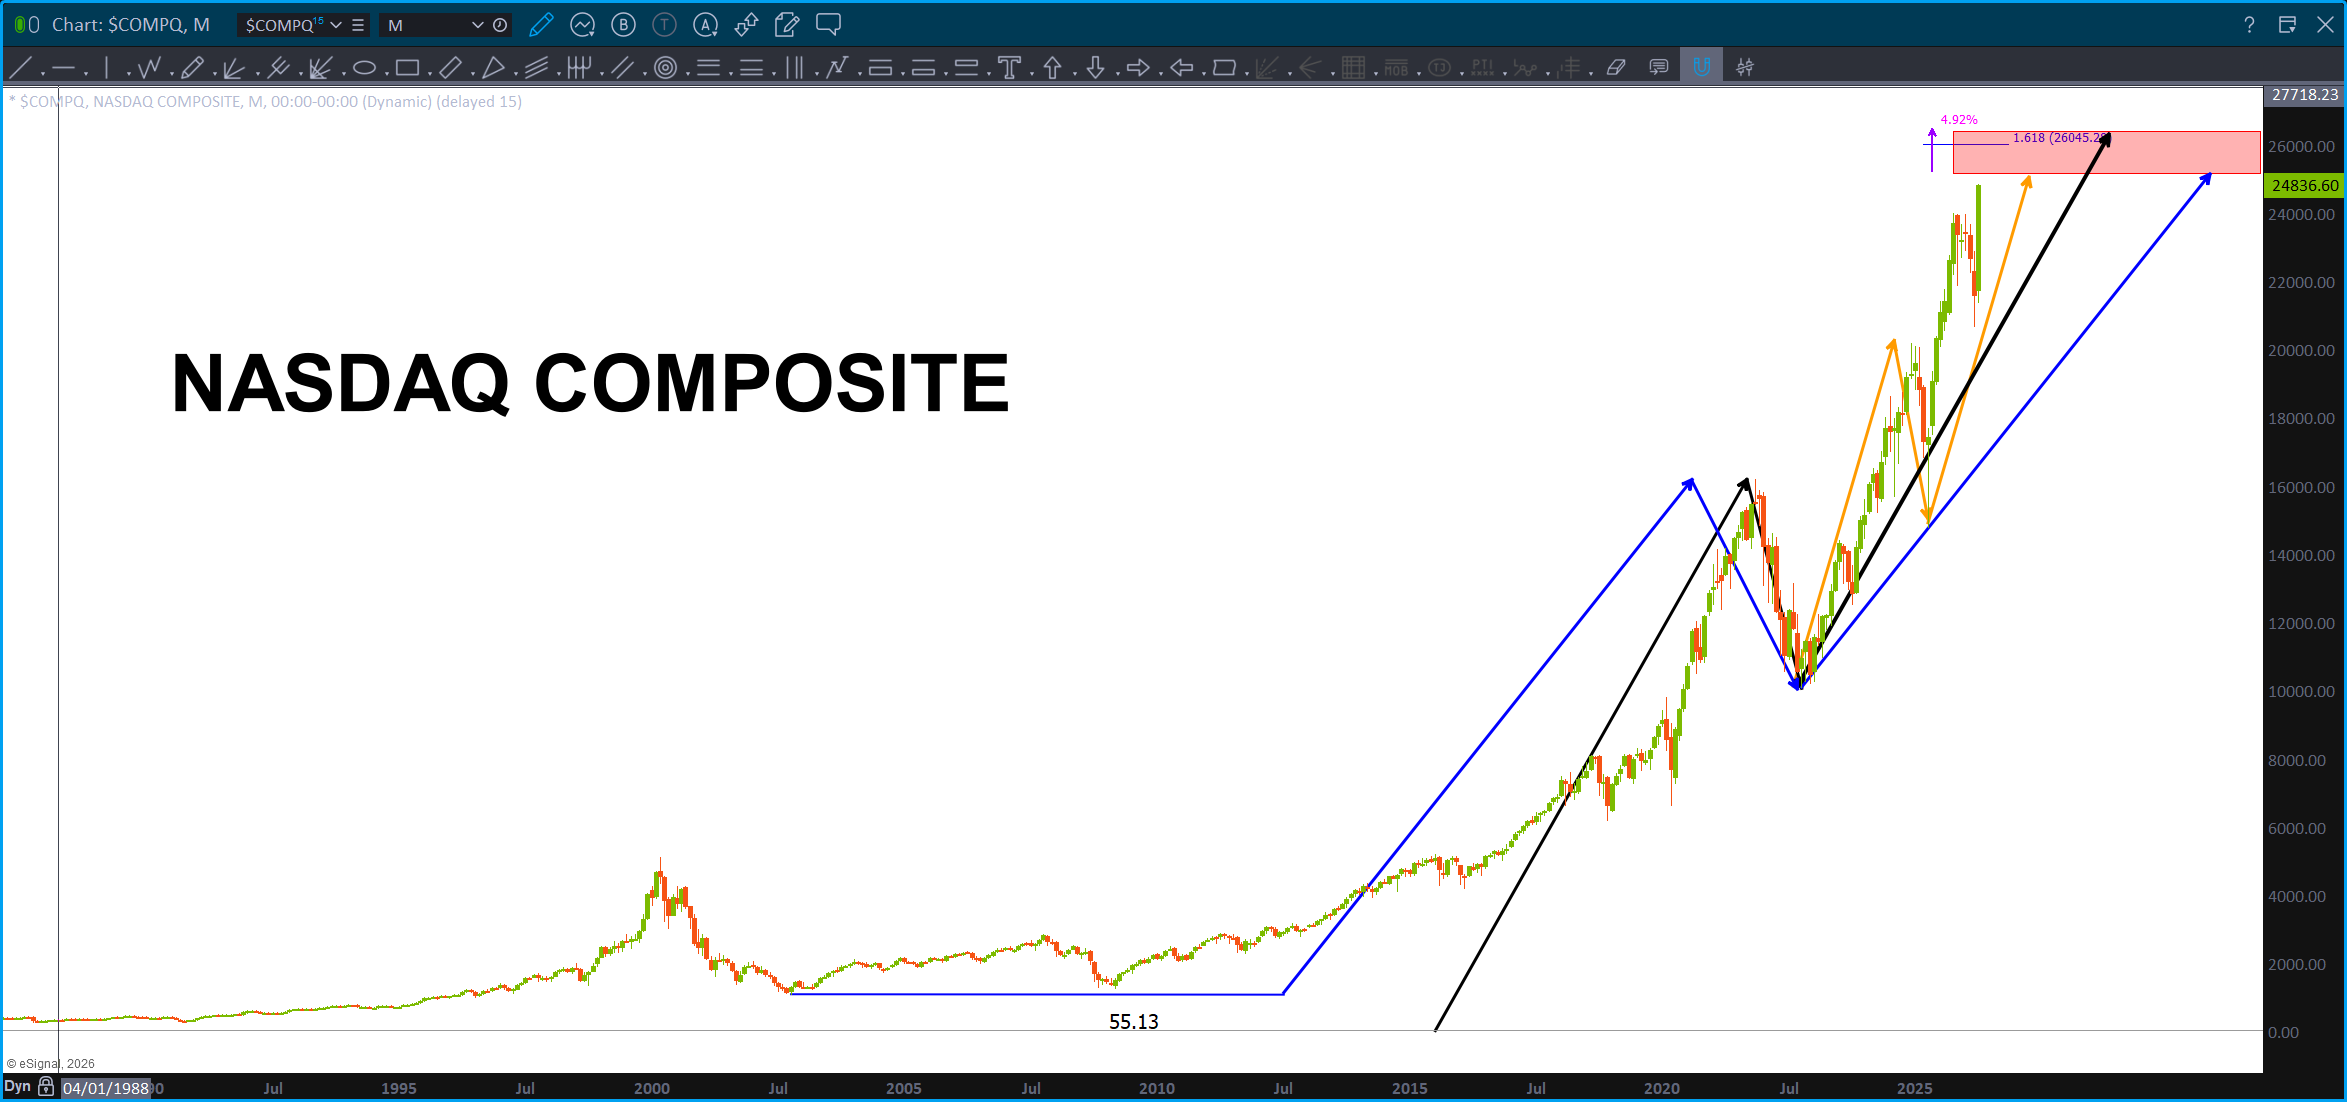
From the all time low in/around 55 we project w/ the ‘black’ line and we have a target zone just a little higher. Additionally, we project w/ the ‘orange’ line and the ‘blue’ line from the 2002 low we get the same target zone. The entire band is around 4% so w/ the cycle shown on the SemiConductor Index and the targets on the NASDAQ, I expect significant resistance.
Most of the targets derived have been resistance but nothing has stopped it for a big correction.
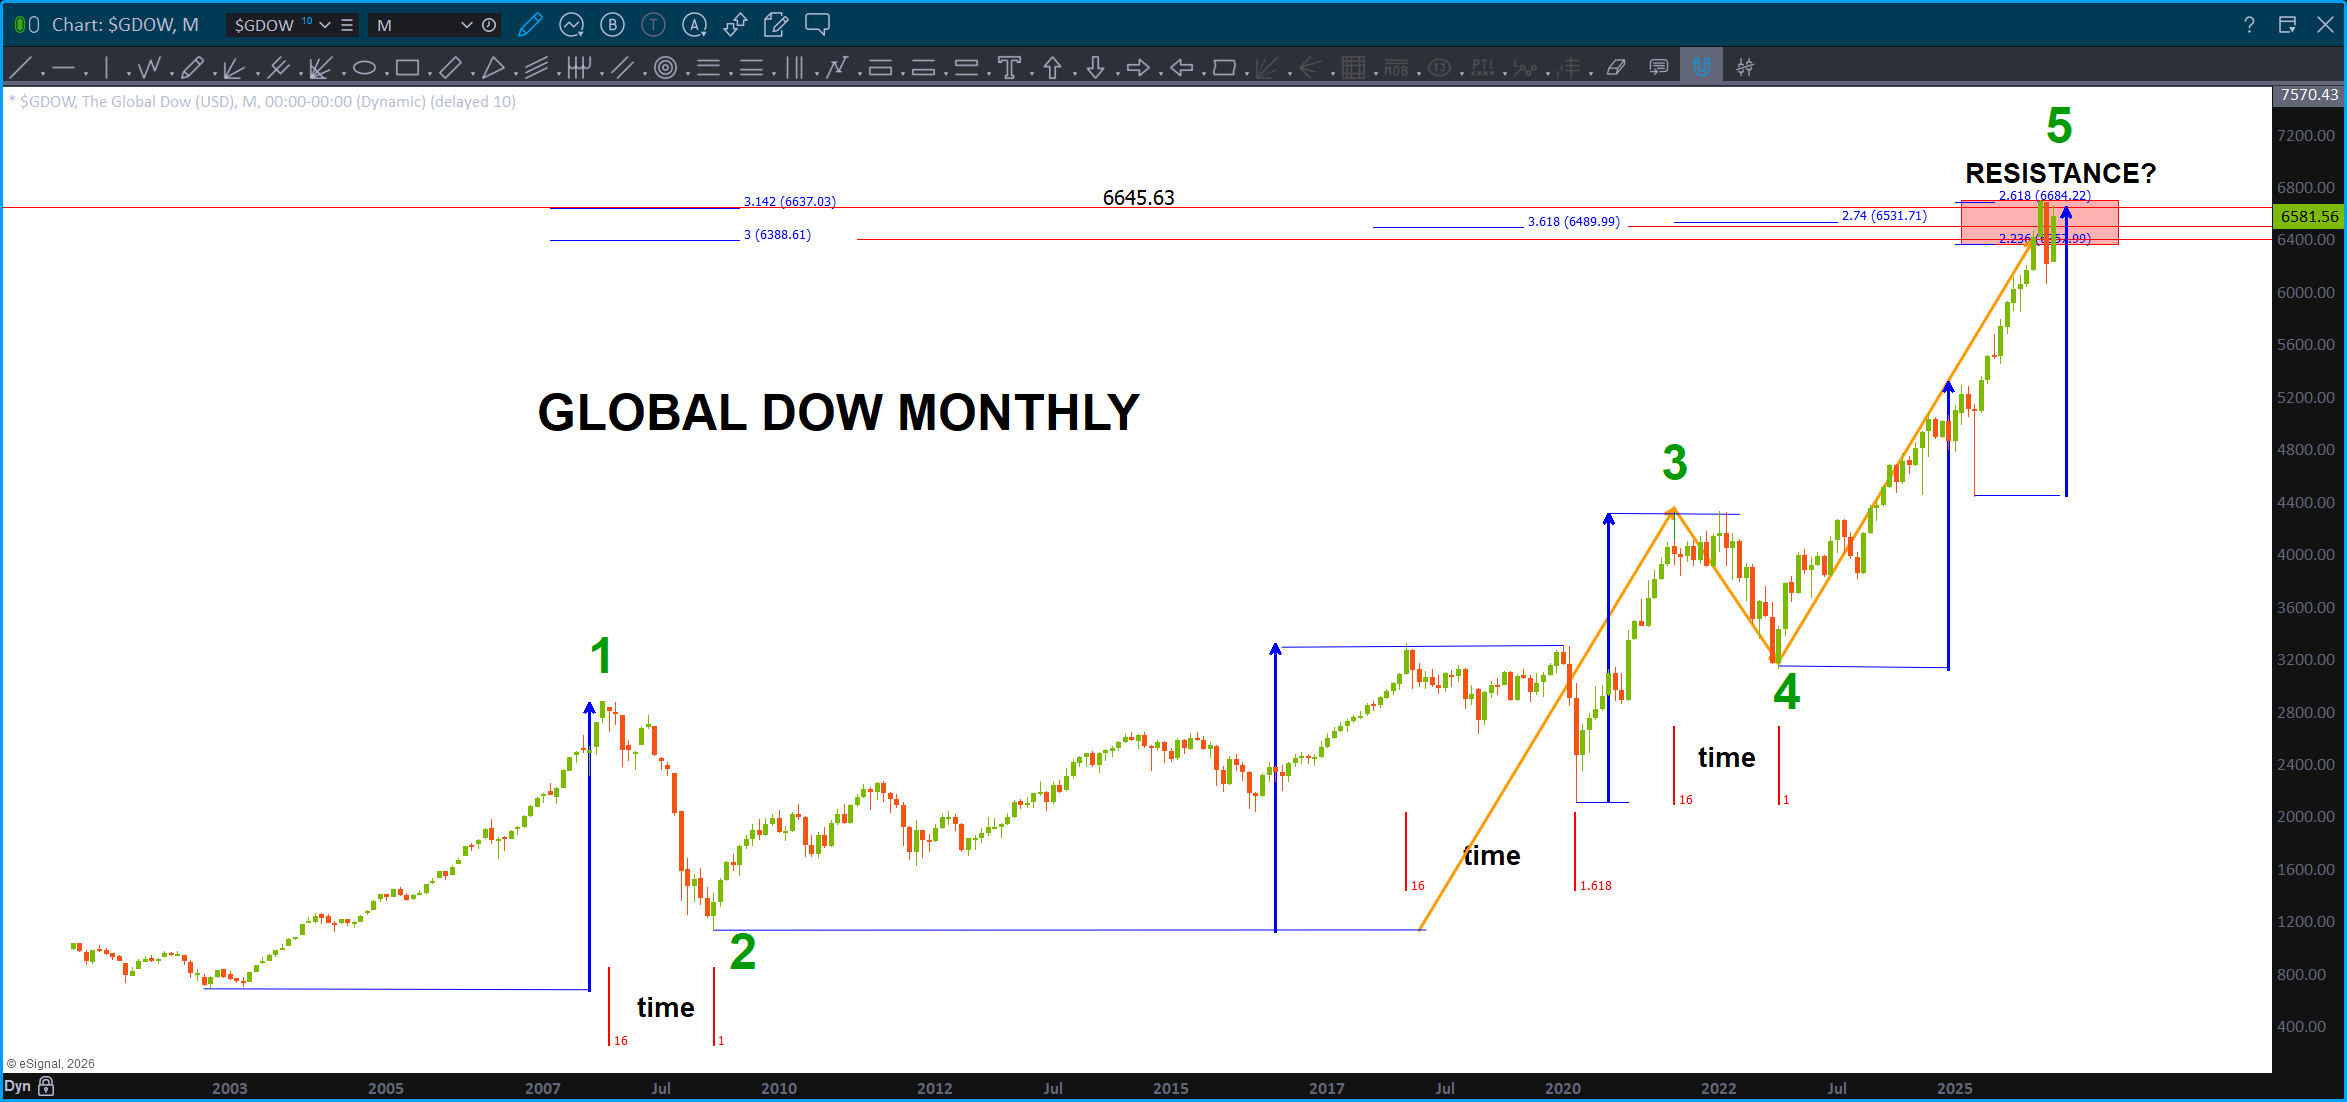
Above is the Global Dow … measured moves hit, perfectly. Take note, each time we have completed a measured move in PRICE (blue arrows) the market has corrected, at a minimum 16 months. Over a year folks …this has happened EVERY year for the past 25 years. If you look at the one measured move (between waves 4 and 5) you will see a very sharp correction after the initial top and then blast off into the latest resistance. Is this going to happen again? Believe we will see, soon.
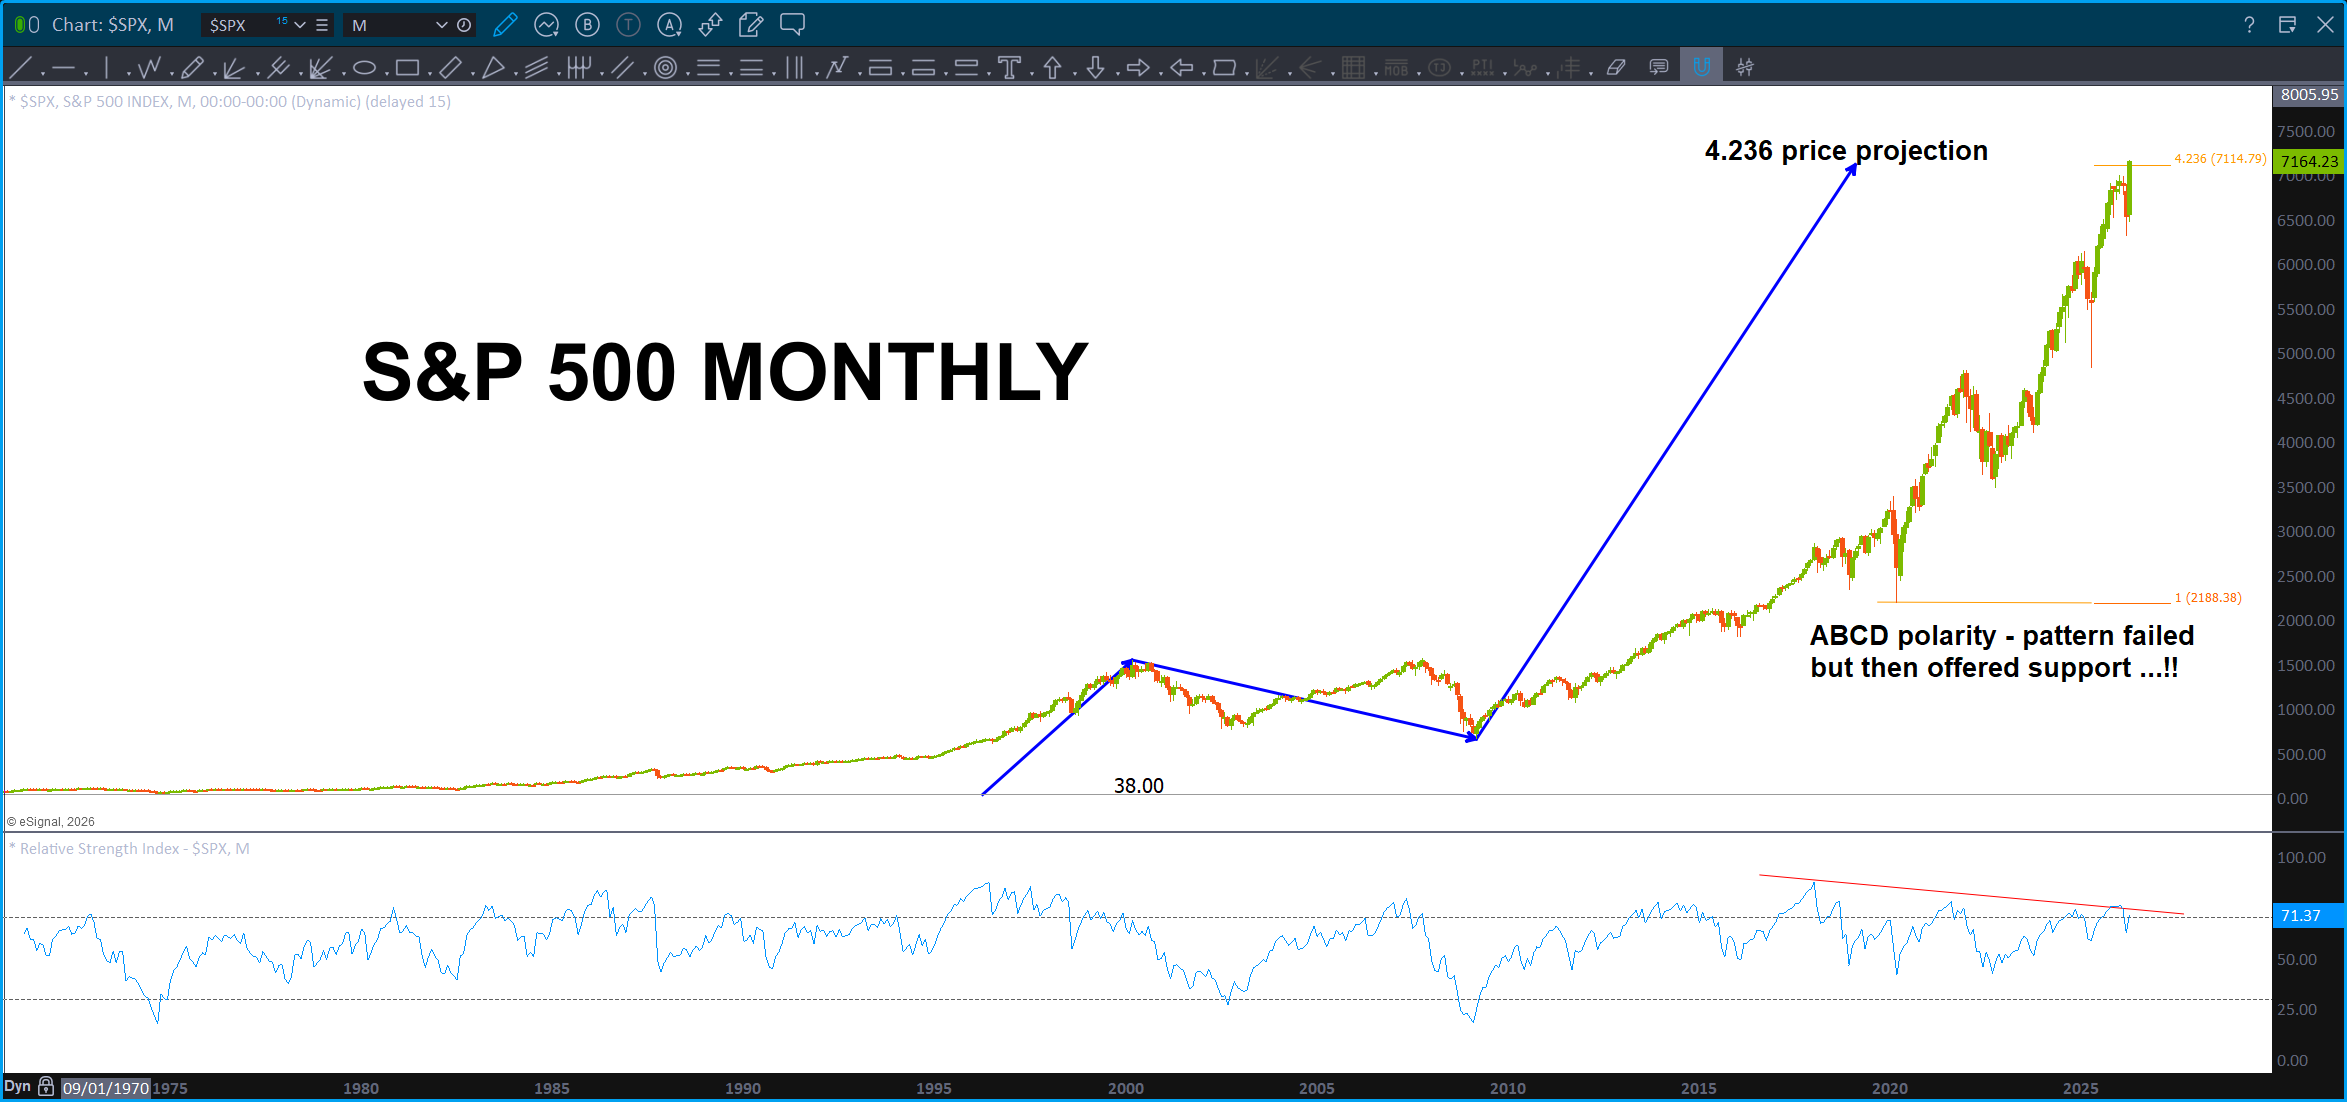
S&P 500, above, hitting 4.236 price projection from initial seed vector – all time low to high in 2007. Note, the gap left behind on the daily is, supposedly, one of the largest gaps ever.
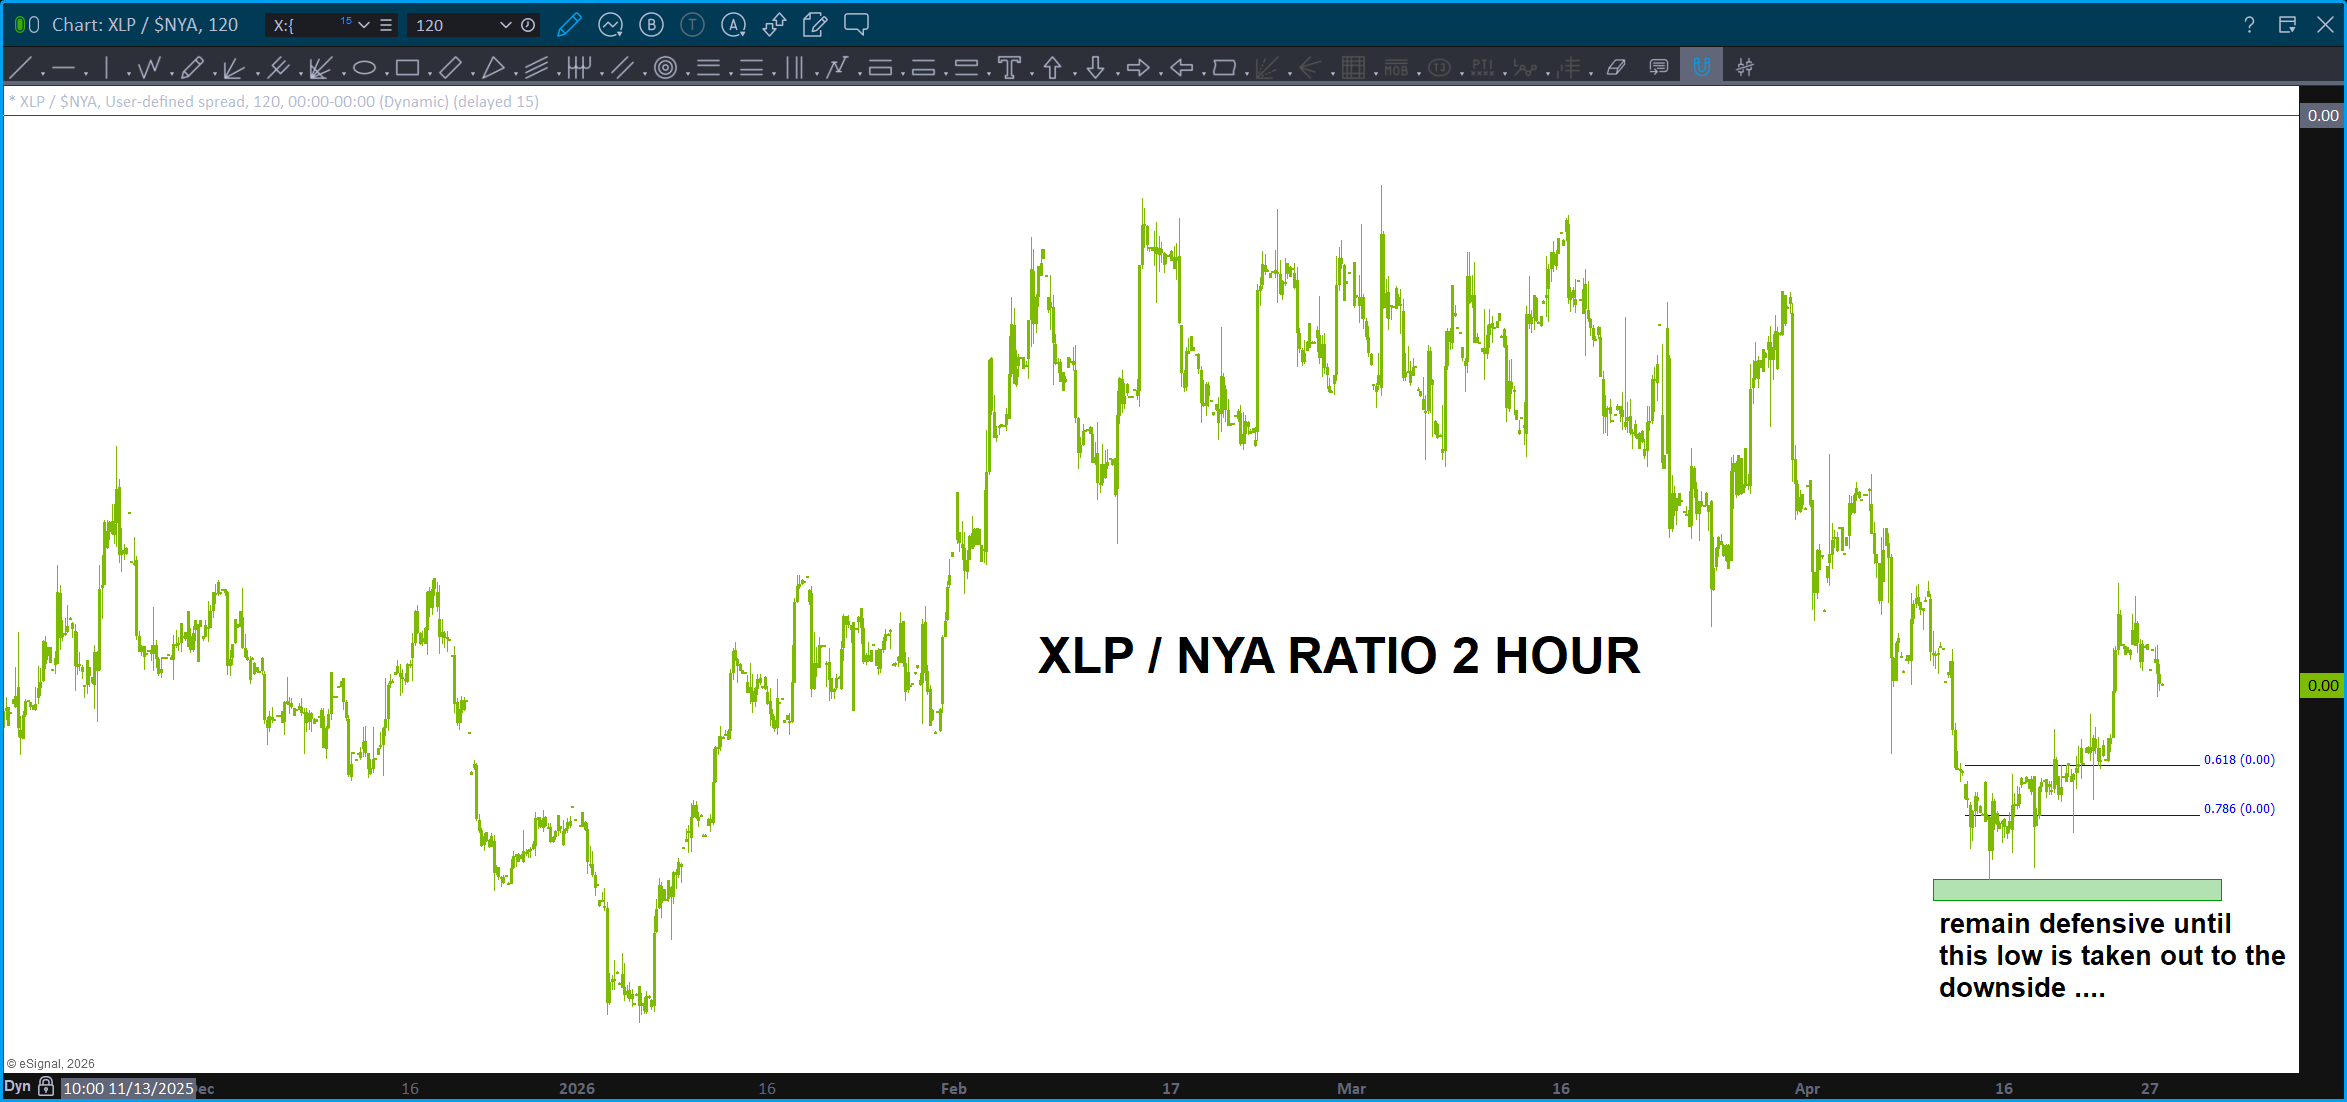
Here’s our trusty ratio .. take note, it has NOT made new lows even though some indices continue to climb the wall of worry … overall, I would be defensive w/ stocks and not chase this market … until we take out the low on the ratio (green shaded area) be careful.
The DJ Transports took off to smack right into a 50 year trend channel (log) and has immediately reversing …
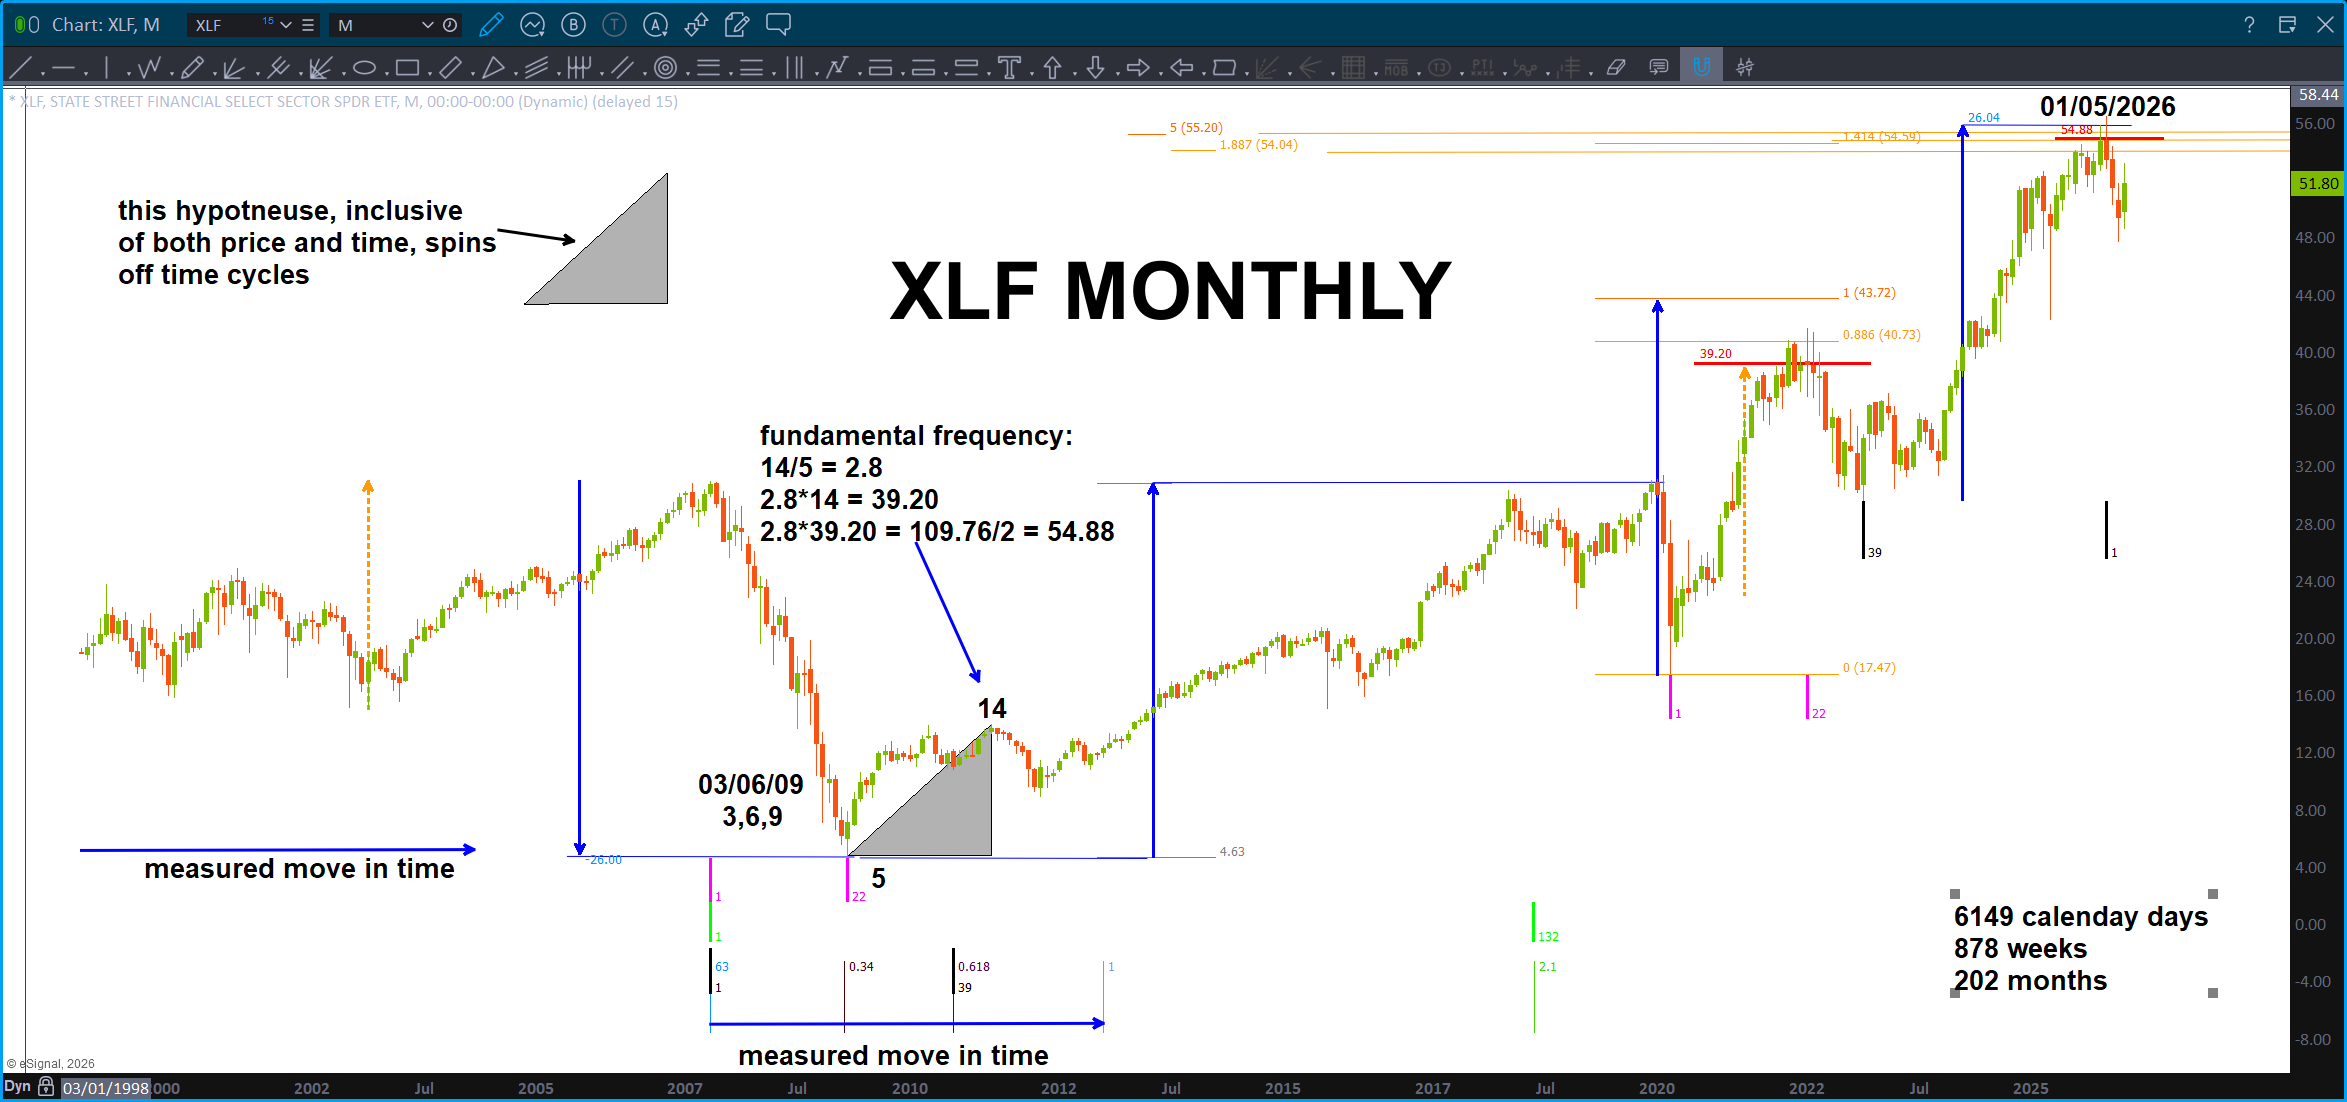
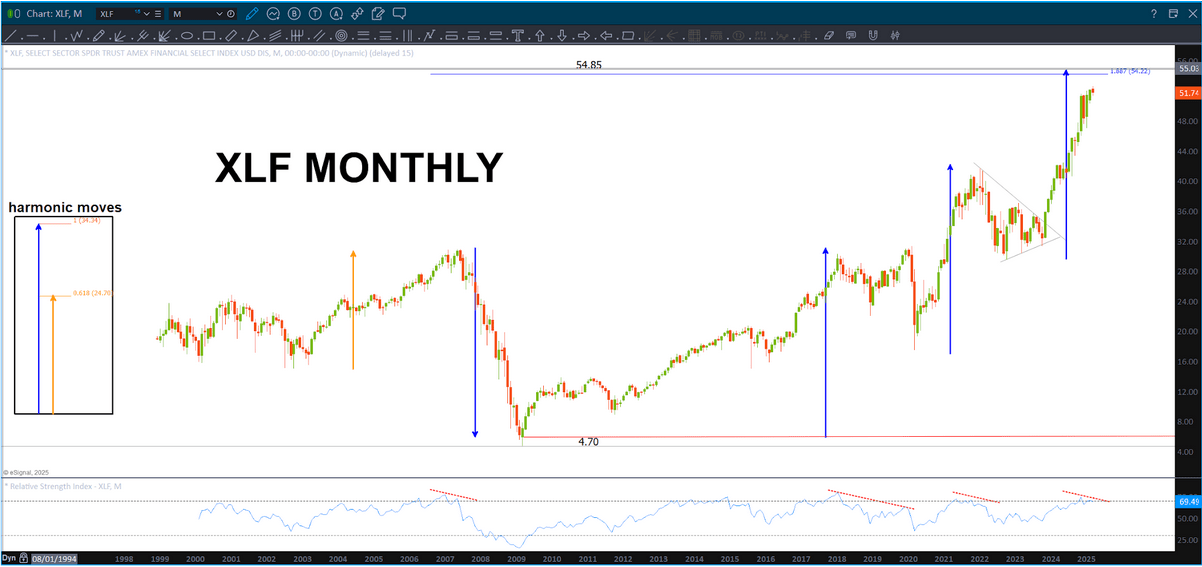
As we have discussed, many times here, the Banks/Financials lead us UP and lead us DOWN. Right now, the XLF has NOT made new highs.
NASDAQ Banking Index … no new highs.
In the fixed income world, our opinion has not changed. One more thrust lower out of the multi year triangle and then major support at the .618 retracement from the 1981 low.
The rally cries for the demise of the dollar and all that … not seeing it as long as we stay above the 93.50 zone shown below, I’m a dollar bull.
The semi-conductor industry has been exploding …
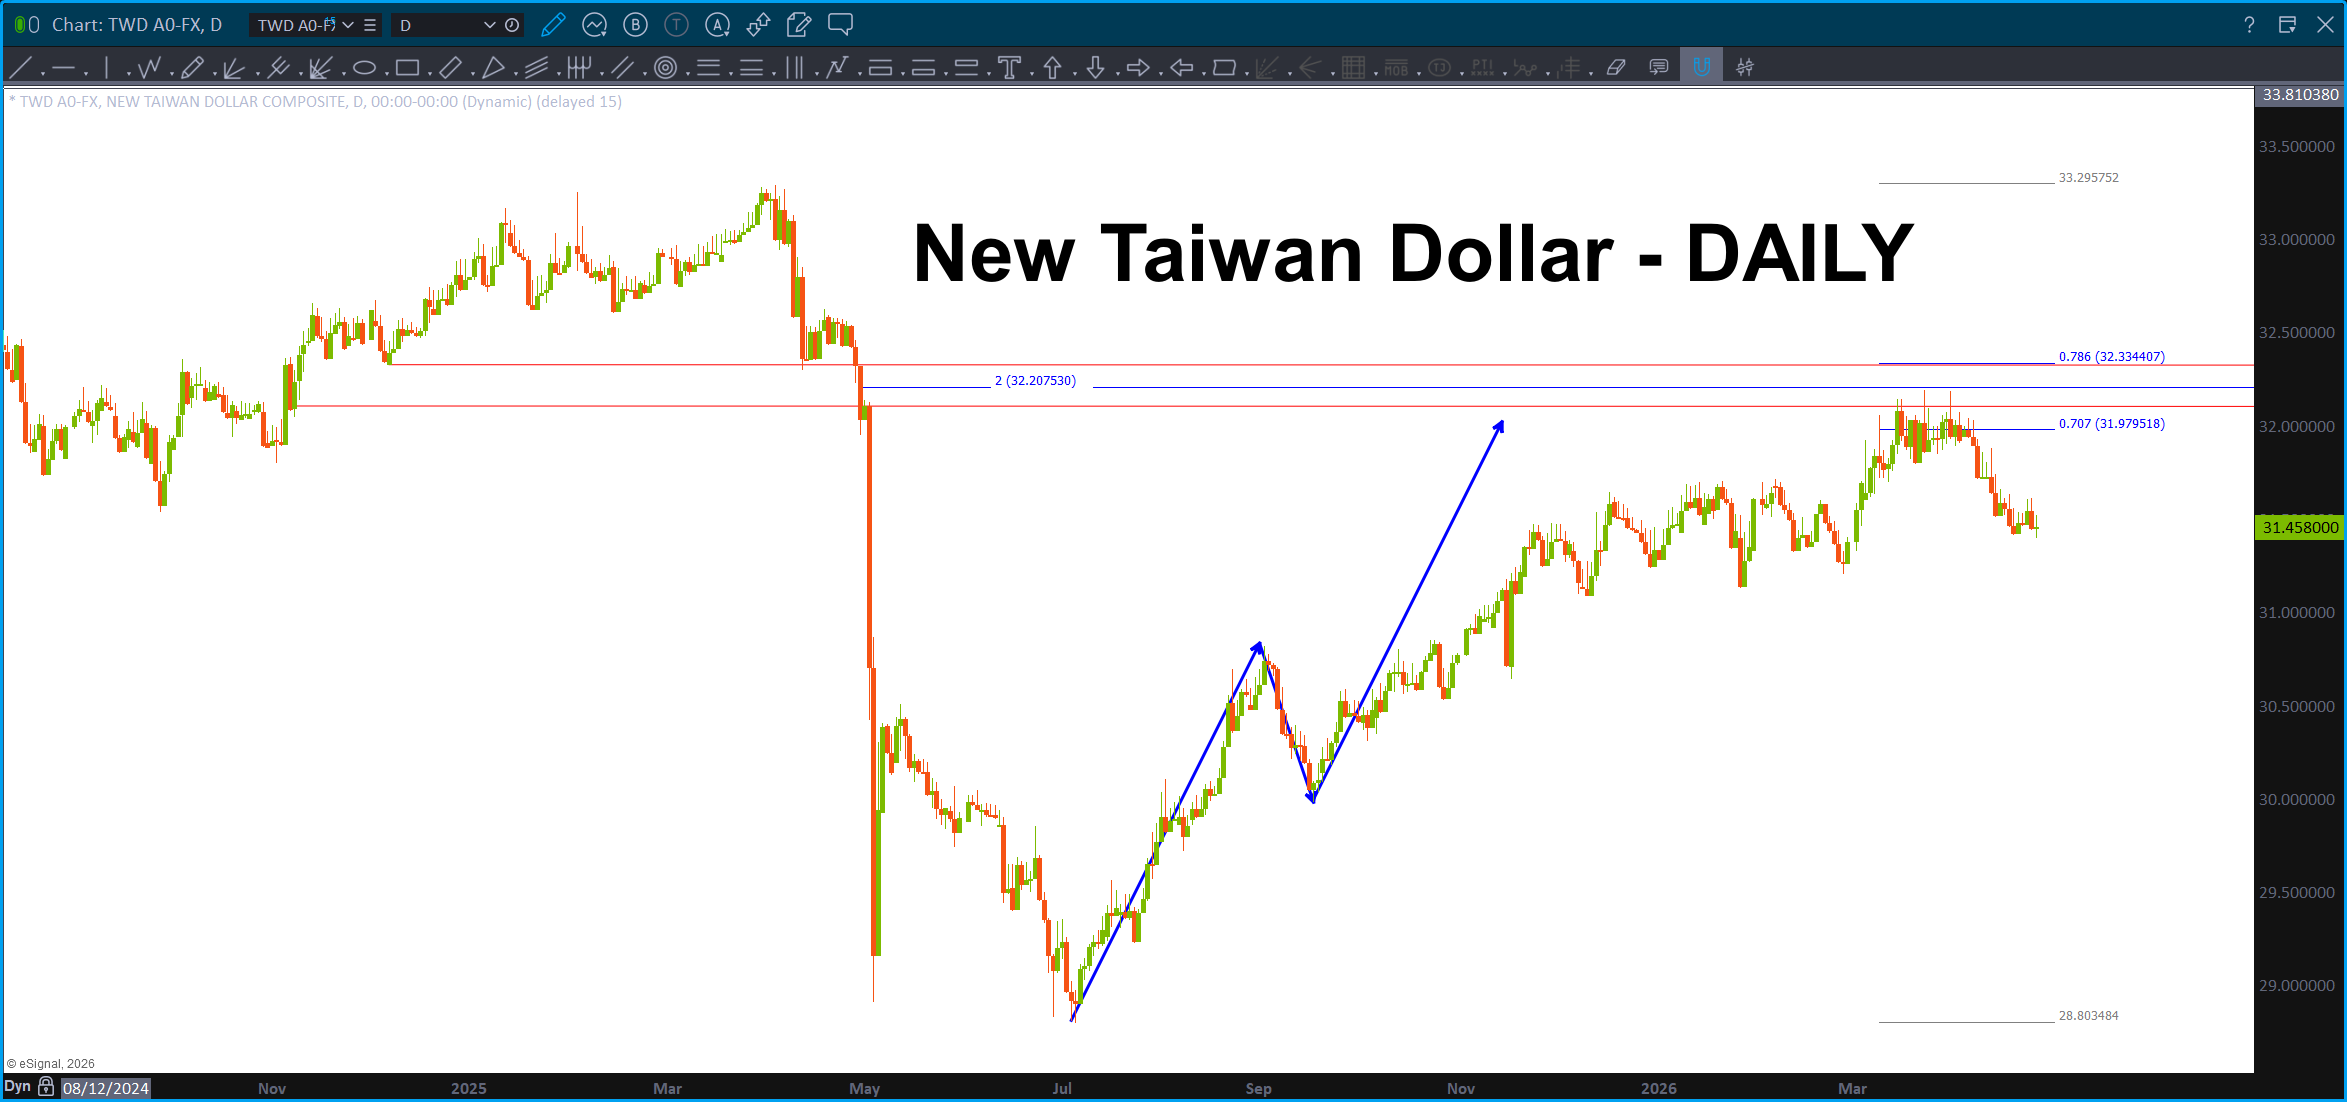
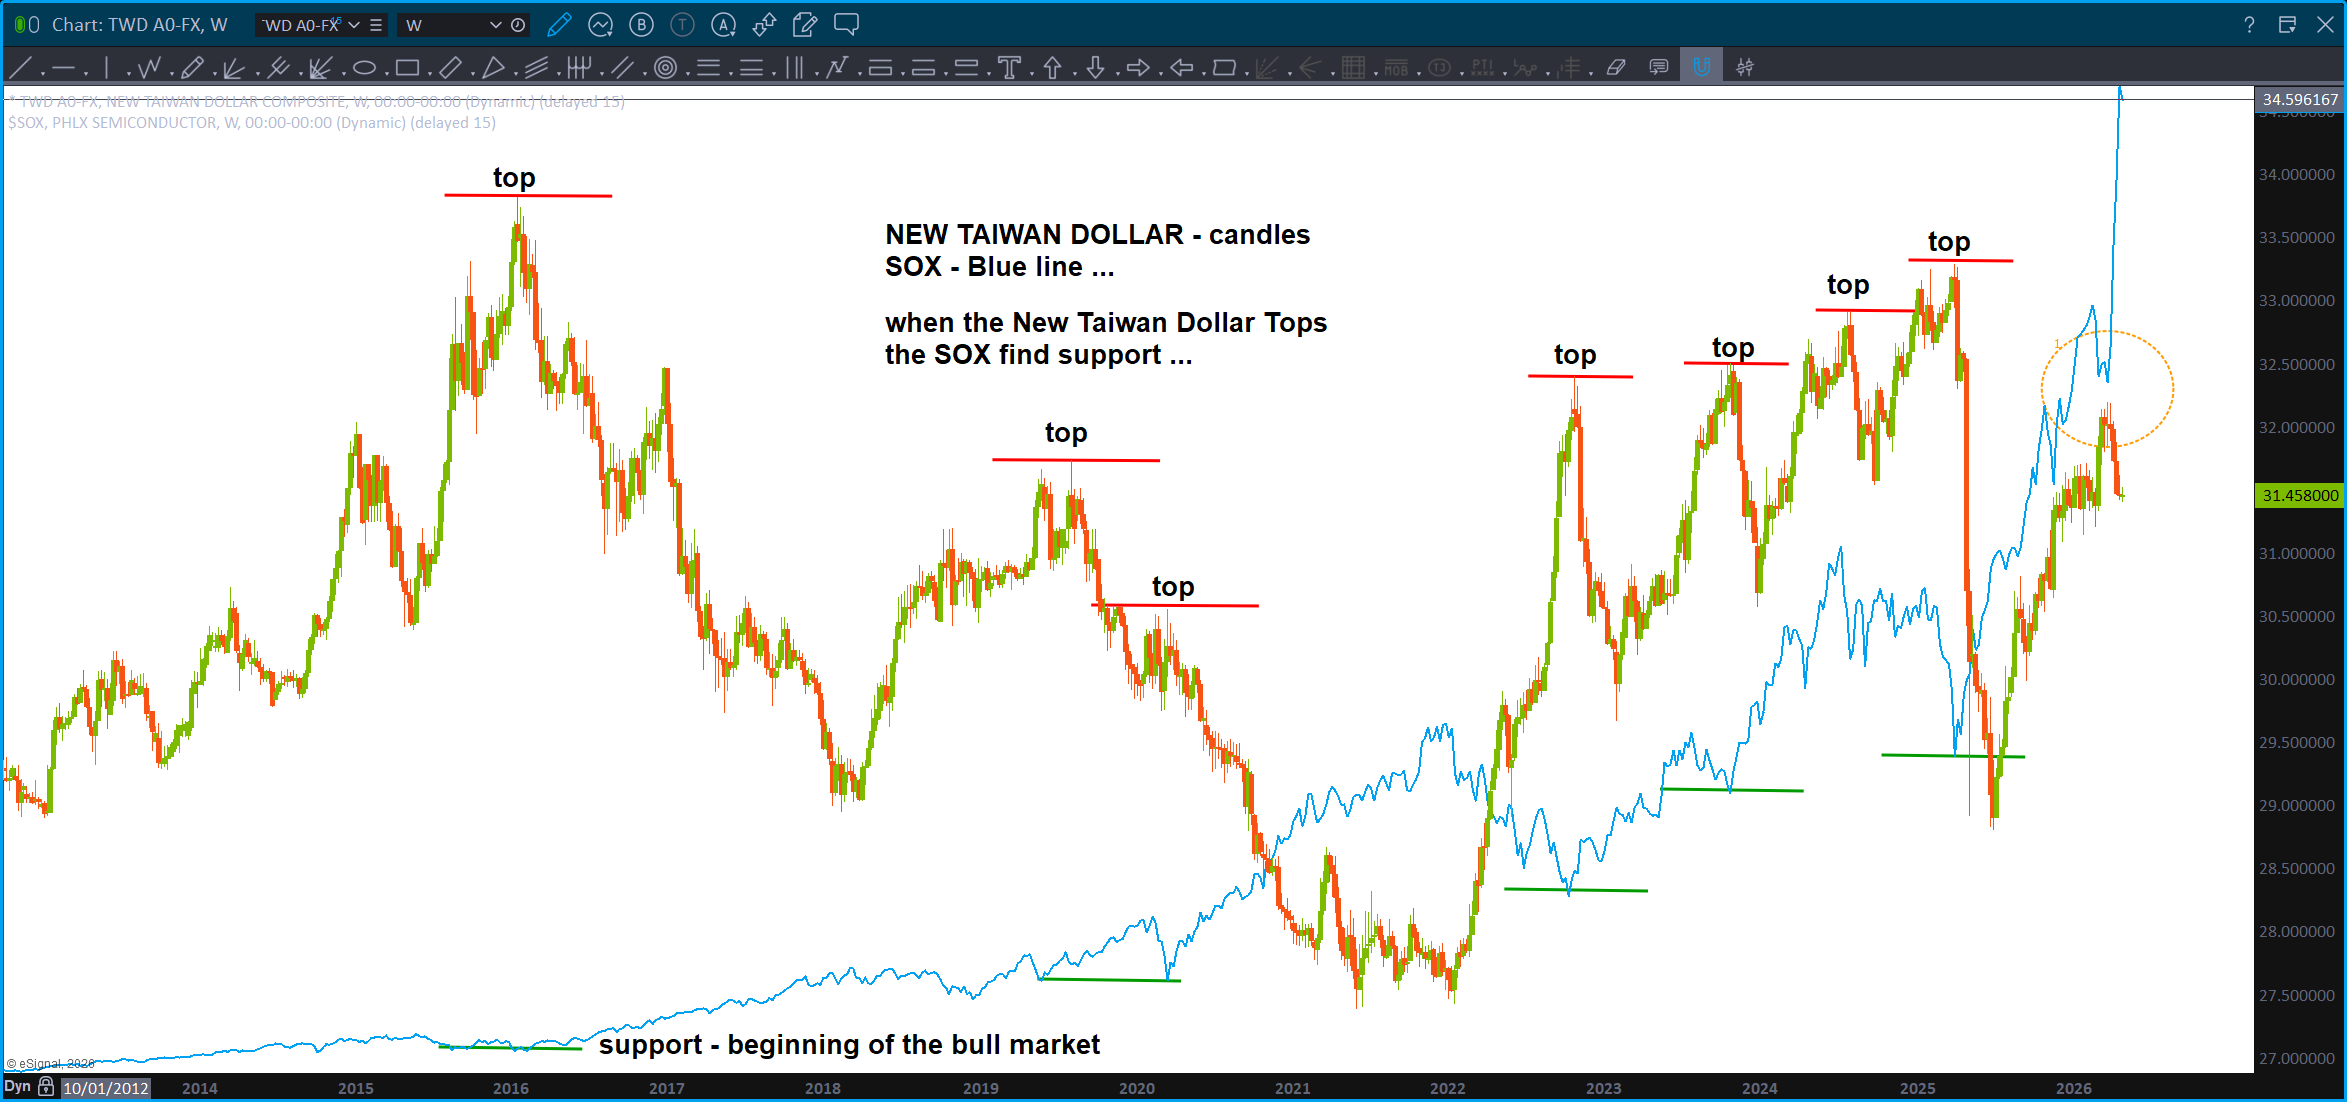
We need to pay attention to Taiwan. The New Taiwan Dollar has shown some correlation to the Philadelphia SOX index:
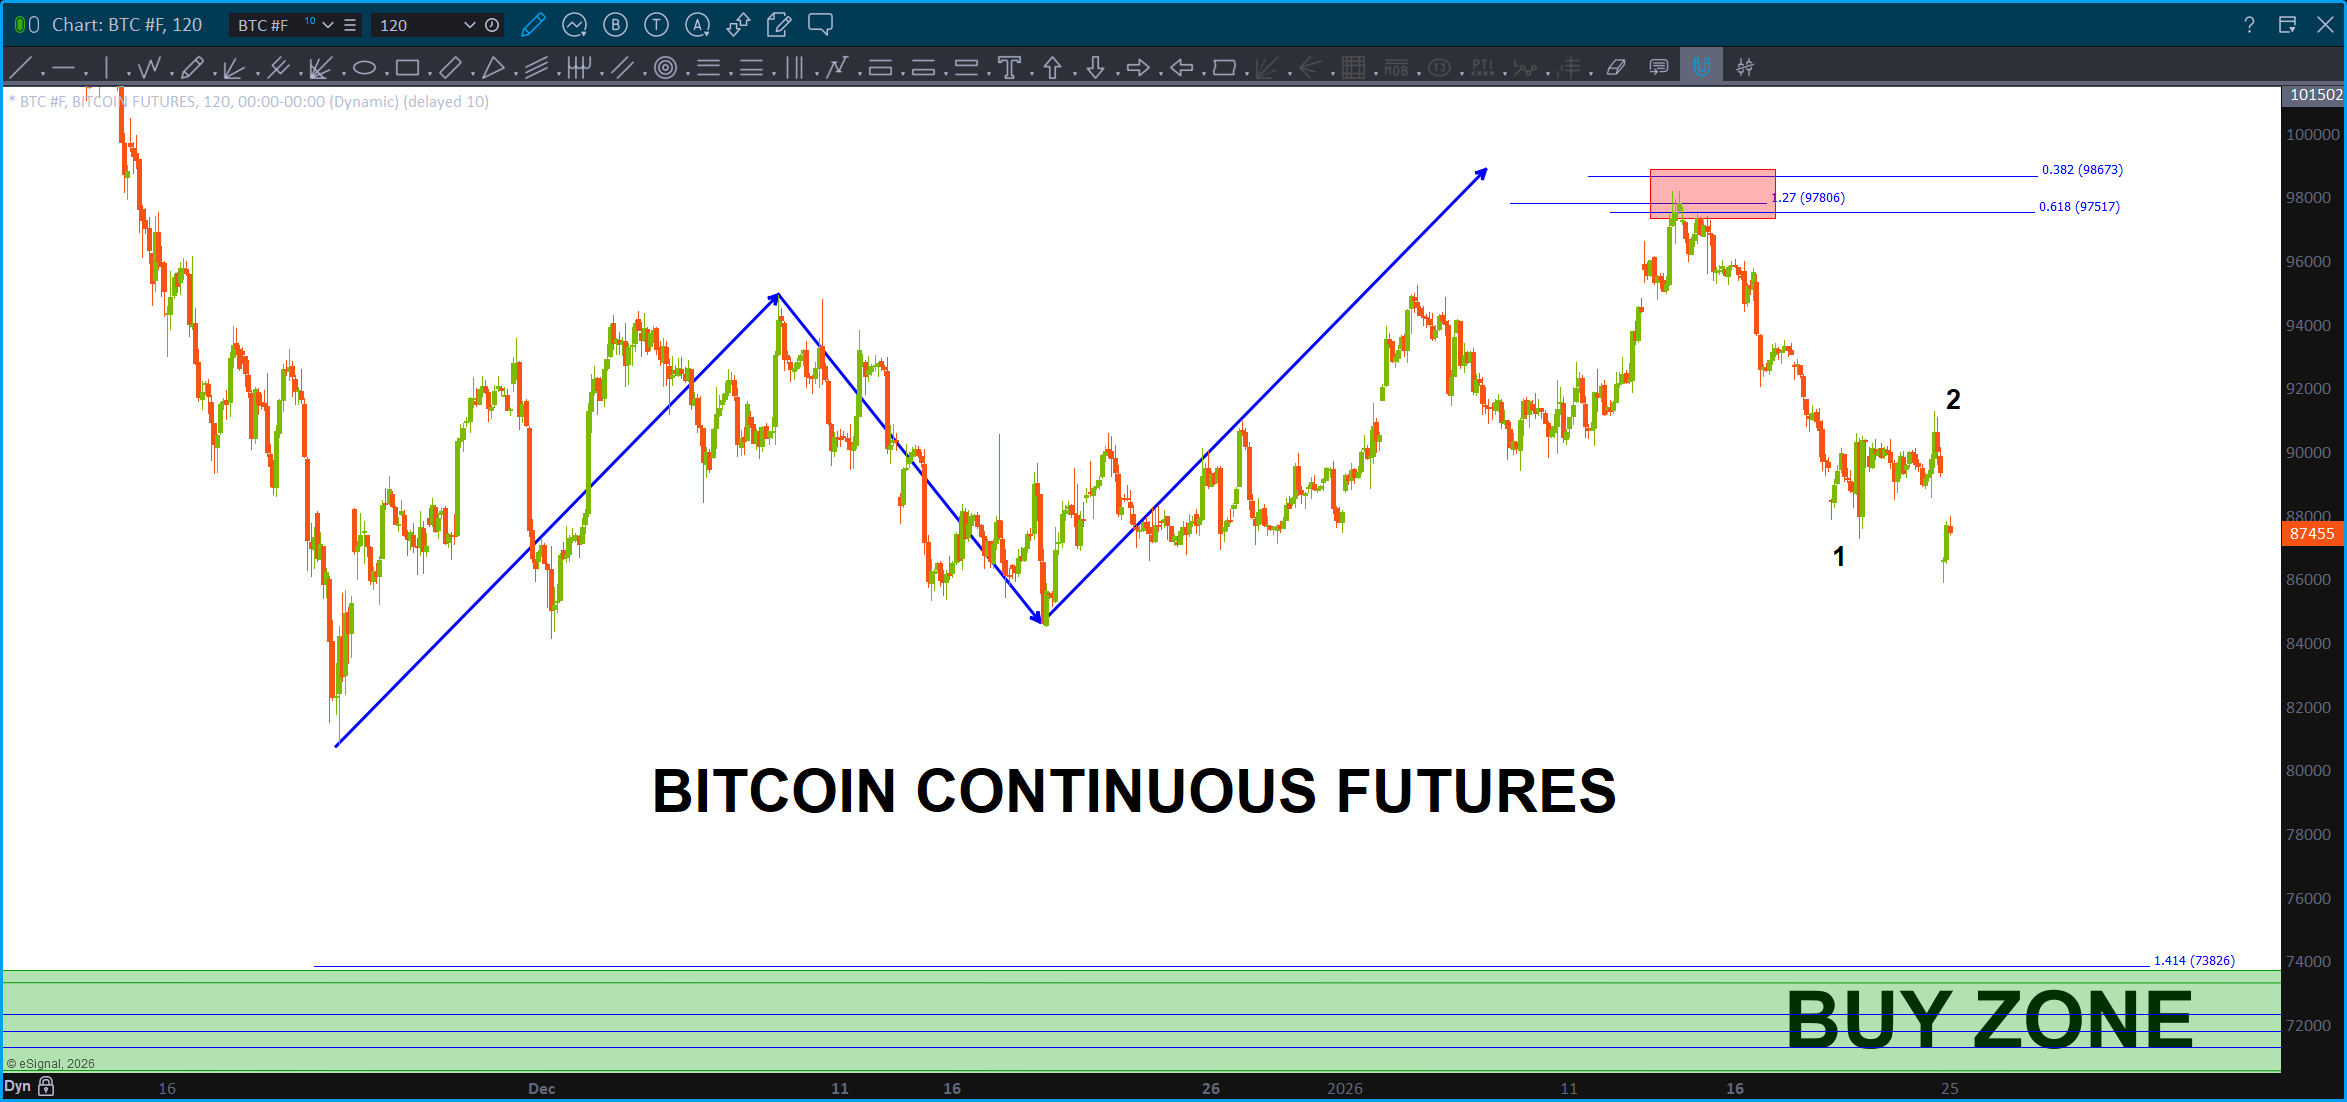
As for the alternative digital currencies, I’m still looking for lower. Folks, again, if my count is correct we have FINISHED a 5 wave sequence, which I’m calling wave 1 and we are correcting in wave 2. If you are a bull for Bitcoin, I would still wait.
Folks, Gasonline prices aren’t going down anytime soon ….they shot out of the wedge and BOOM off to the races. Can’t see this slowing down for now.
Crude Oil – April 8, 2026

Apologize for being absent for so long during this volatile time. Honestly, moved into a new start up doing amazing things and, while I’ve certainly had my one eye on the market every day, I really haven’t been paying attention to it because, well, even though a TON of long term targets were hit and the volatility is pretty wild, it really HASN’T broken down …yet. I say yet, not as a fatalist, not at all. But just from the fact that our brothers and sisters in Egypt are w/out power – right now. Yup, they cut it. Look it up … Over in Asia, fuel shortages and rationing and minimal work days. The supply chain has been severely disrupted folks and, once again, if you are in the US we are sitting pretty – for now – due to our energy independence and a host of other things. And, trust me, that’s just me looking at it objectively. This is going create a rougher patch than the ‘glancing flesh wounds’ that are hitting peeps here and there … in the immortal words of the Dude “well, that’s your opinion man …” Yup and that is all it is …
So, w/ all the emotion flowing around I thought I’d take a look at Crude. Haven’t looked at it for a LONG time. Why? Mostly, because I didn’t know what to do w/ that -40 ish price. Yeah, no kidding … but, tonight, I just went “screw it, that was a price, so it counts.” Certainly appears to work …
What’s pretty amazing? In the height of, one would say, emotions like those who remember living thru 9-11, this conflict with Iran ranks up there in the “big deal” world. Guess what, the ratio’s and patterns are present throughout the conflict! Don’t believe me? See below … fractals peeps, it’s all fractals.
Ultimately, we will realize that the ‘seed’ is EVERYTHING. That initial measured move vector from an IPO or a big low or high contains the ‘DNA’ for that security. It has to be that way … just like the entire universe, that DNA creates a harmonic musical representation of the vibrational interactions of anything or anyone interested in said security at the quantum level which then creates the summation vibration of those emotions represented in price and time. Guess what, nature does the same thing …
So, after letting the emotional vibration play out in both fear and euphoria …they have left us THE seed to now manage risk in this insane environment. You see what happened there …? While you go thru the same emotions as those actually trying to trade these insanely volatile moods, you contribute to the footprint that is being left on the charts but you have the discipline to wait. So, you wait for the emotions – for this particularly security of Crude Oil Continuous Futures – to form the measured moves which are now your graphical representation of – get this – the vibration associated w/ crude oil and this current conflict. Yup …
Now, ALL futures moves in this emotional environment will be harmonic to the footprints left behind by the masses. Below is our first attempt to harness that information:
Credit Markets – March 05, 2026

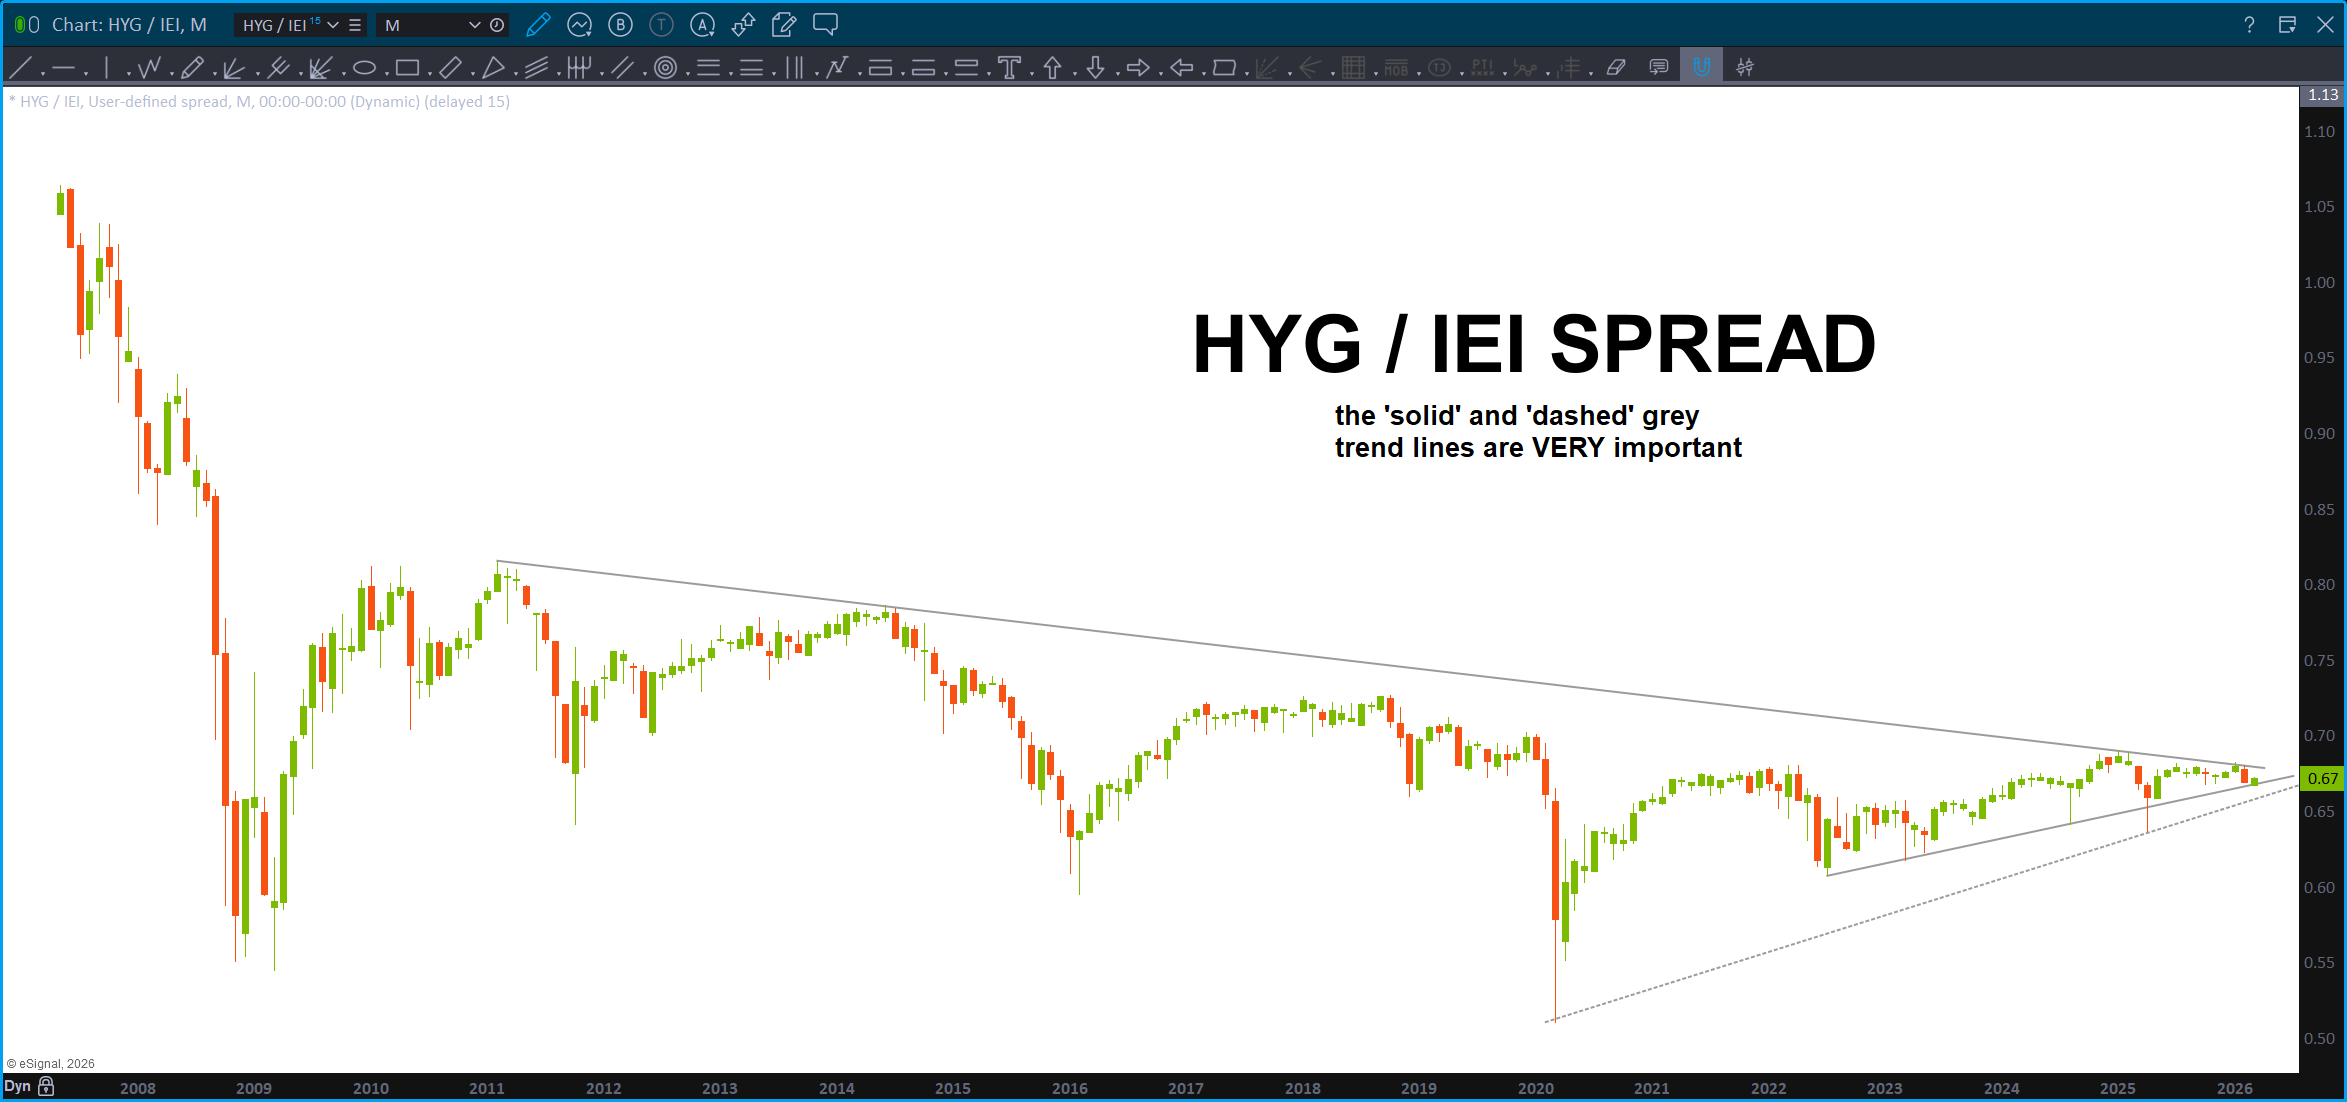
Picture this chart as a simple comparison between risky junk bonds (HYG) and safe government bonds (IEI), but shown as a “spread” or difference that highlights how much extra reward investors demand for taking on risk. When the line on the chart heads down, especially along those important grey trend lines, it means junk bonds are losing value faster than safe ones—investors are getting nervous and preferring security over high returns. Right now, with interest rates appearing to rise (making borrowing more expensive for companies), this downward trend could signal bigger problems in the credit markets, where businesses rely on loans to operate. Higher rates squeeze companies with lots of debt, and if they struggle to pay, it might lead to more defaults, just like we’ve seen in past economic rough patches.
Recent news from early 2026 is buzzing with worries about the private credit market, a massive $2-3 trillion area where non-bank lenders provide loans to businesses. For instance, experts fear the private credit bubble is about to pop due to rising investor withdrawals and firms like Blue Owl selling off loans to meet demands. Private credit stocks are signaling more pain ahead, with market volatility adding to the stress. Concerns are growing over the market’s rapid expansion and risks, especially in a higher-rate environment exposing weaknesses. Blue Owl’s recent stumble is reviving fears of a Bear Stearns-like moment, with default rates jumping. Investors are anxious about cracks in private credit, driven by AI pressures on sectors like software and broader economic uncertainty. If rising rates keep pushing this spread lower, it could mean tougher times for the economy, so watch how companies manage their debts
I will be watching the two ‘grey’ trendlines … a daily close below the lowest trend line (dashed) will definitely make the hairs on the back of my head stand up.


January 25, 2026

Spent the weekend pre-reading the upcoming novel by Alan Green – America Codes. Appollo to Artemis. Trump and Pope Leo XIV Prophesied in The Declaration of Independence.
You read that correctly.
I am changed from reading this novel … the perfection of this 3D Holographic Matrix of Consciousness is beyond description. It’s truly perfect … anyone following this blog will have to read this book. It will change you … Egypt, Shakespeare and the Declaration of Independence all interconnected in ways that will transcend your mind.
How about this … it HAD to be 1776. There is only one year that would have worked when we look at the locus of the moon and sun distances from the earth and calculate the speed of light (Remember folks GOD said “Let there be light …!” Genesis 1:3 or Genesis 1:111 perhaps …
That’s our first vibration … and when the last word “light” was spoken, that became the first radius. From there … we connect it thru time/space by the eternal cycle represented by the circle. We can’t divide perfection so we double it … the two intersecting circles become the Vesica Piscis (“bladder of the fish”) which creates the initial VECTORS for the square roots of 2, 3, 4, 5 … the 7 days of creation in Genesis? That’s the first 7 circles which create the seed of life. We now have the ratio’s present to create everything w/in this 3d world that we need. Creation occurs by the finishing of Metatron’s Cube. Metatron, the Arch Angel responsible for ALL of the geometry across all dimensions of existence was, at one time, a mere mortal like us …remember John 14:12?
Well, who was Archangel Metatron? … that would be Enoch. A descendant of Adam and the Great Grandfather of Noah. Yeah … he’s also the main figure in the BOOK OF ENOCH. (recommend you go and read it folks … it’s still in the Ethiopian Bible but was struck from the King James during the council of Nicea in 325. Why? ;)) The book of Enoch is where John Dee downloaded the Enochian tables and that was the encryption method used to encrypt ALL of Shakespeare. Yup … Shakespeare was baptized 4/26/1654. 426 whose mirror image is 624. John Dee faked his death on June 24th. There are 624 characters in the Enochian Table.
Folks you might want to brush up on your mythology and learn about this dude …

To the markets …
Bitcoin …our target level in the low 70’s still stands as the zone to BUY. Big question is, and I REALLY don’t know, new highs or a corrective bounce. If you think El Coin is going much higher then roll w/ it but it you think we have another leg down then this is a scalp BUY.
Or, BUY here and see if the ‘first’ SELL PATTERN works or not … ? Reasonable …

Folks … have to be aware and watch what is going on in the Land of the Rising Sun …
Silver is ROLLING … I like this count so expecting some resistance here/little higher BUT we are buying any pullback. Month or so pullback …? If long, stay long.
Folks … here’s the deal w/ Silver. A LOT of the Banks are SHORT SILVER so … it’s pretty cool to see all the pattern prices being hit on the banks as this is all happening. Check this one out on JPM:
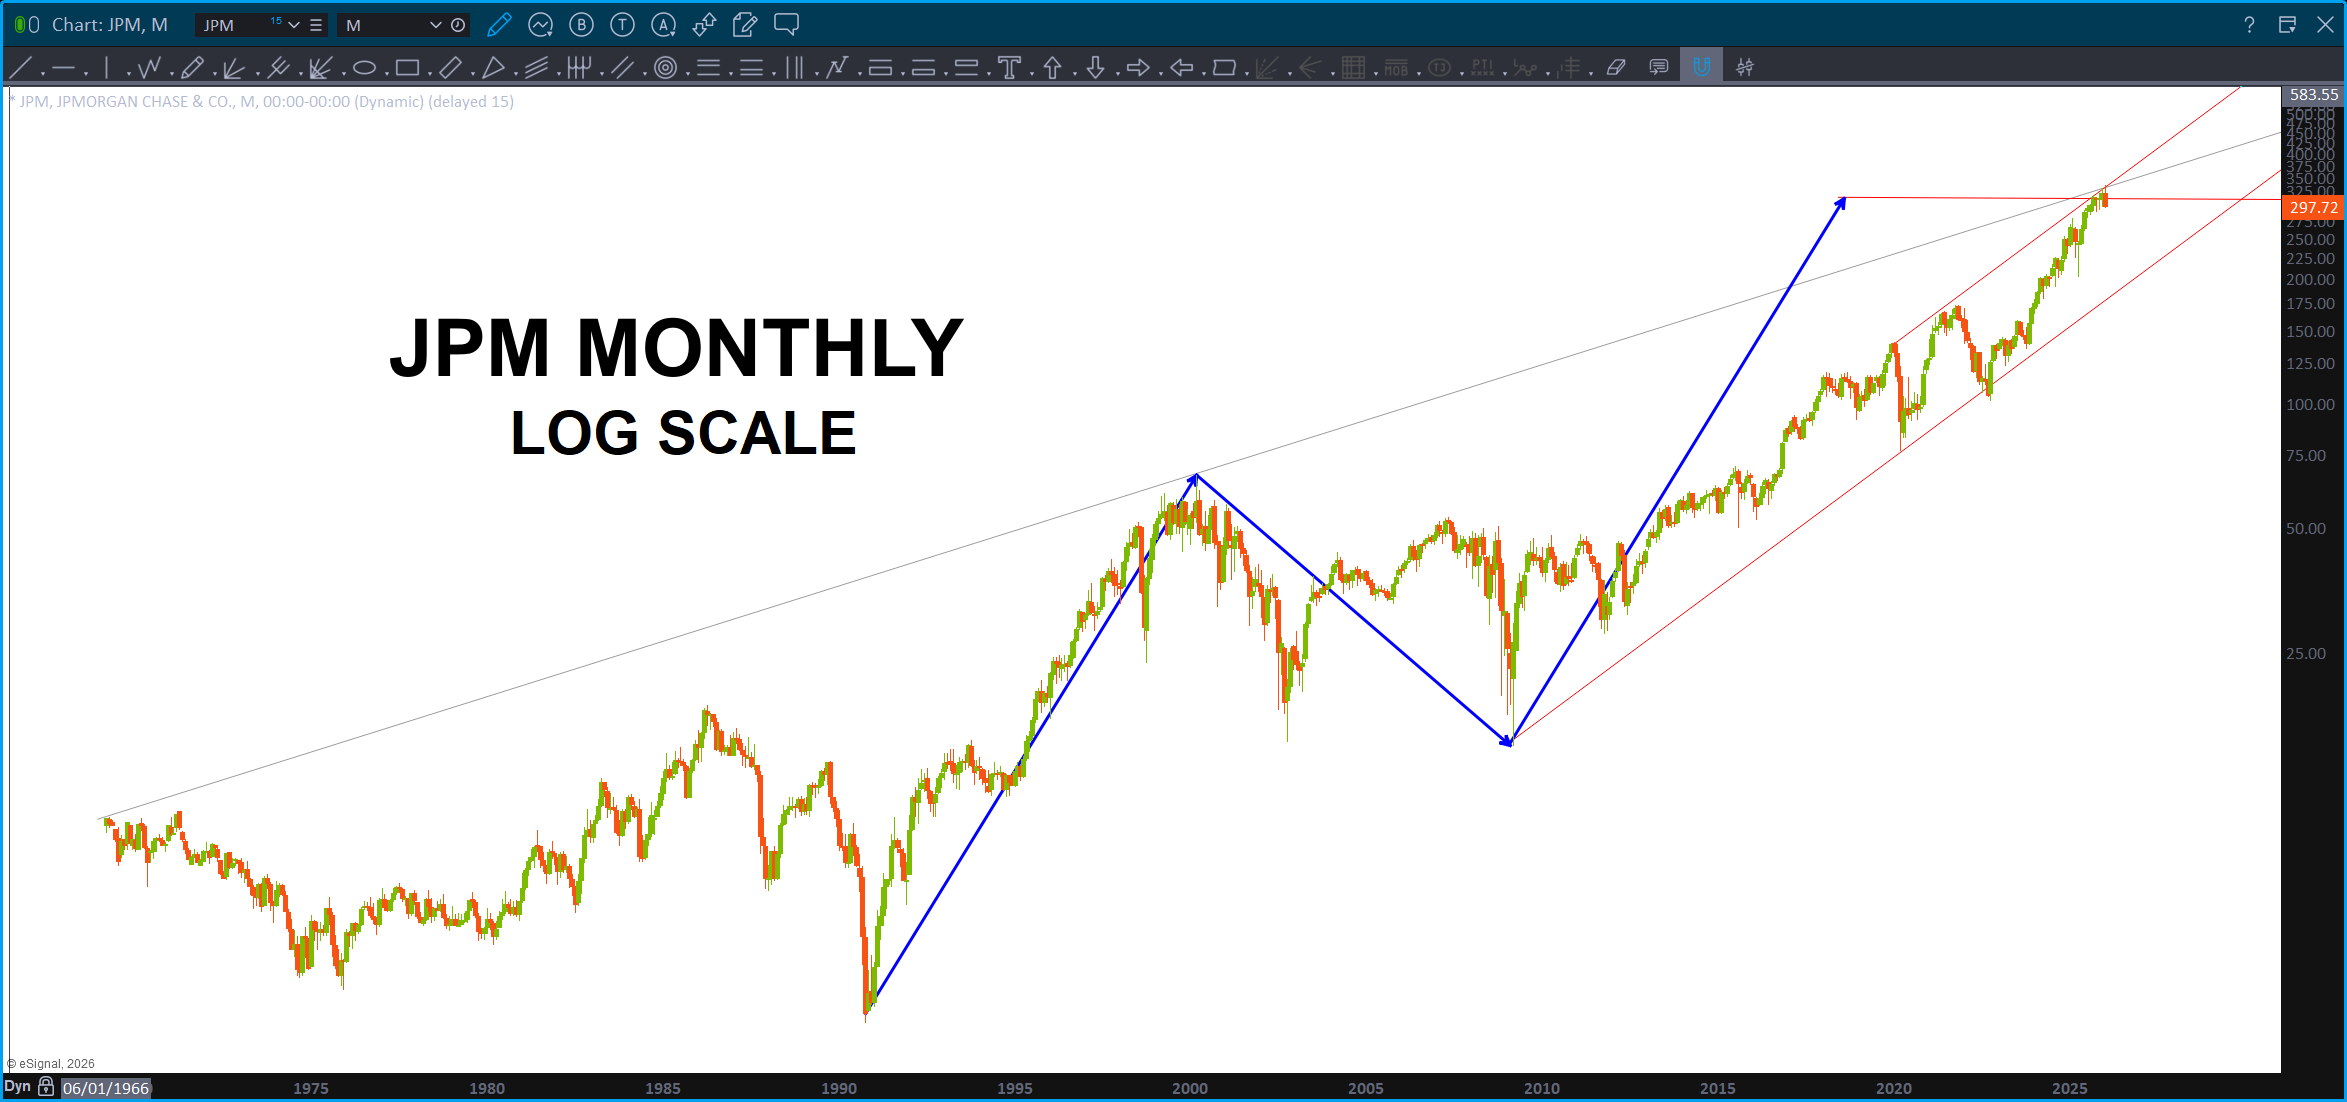
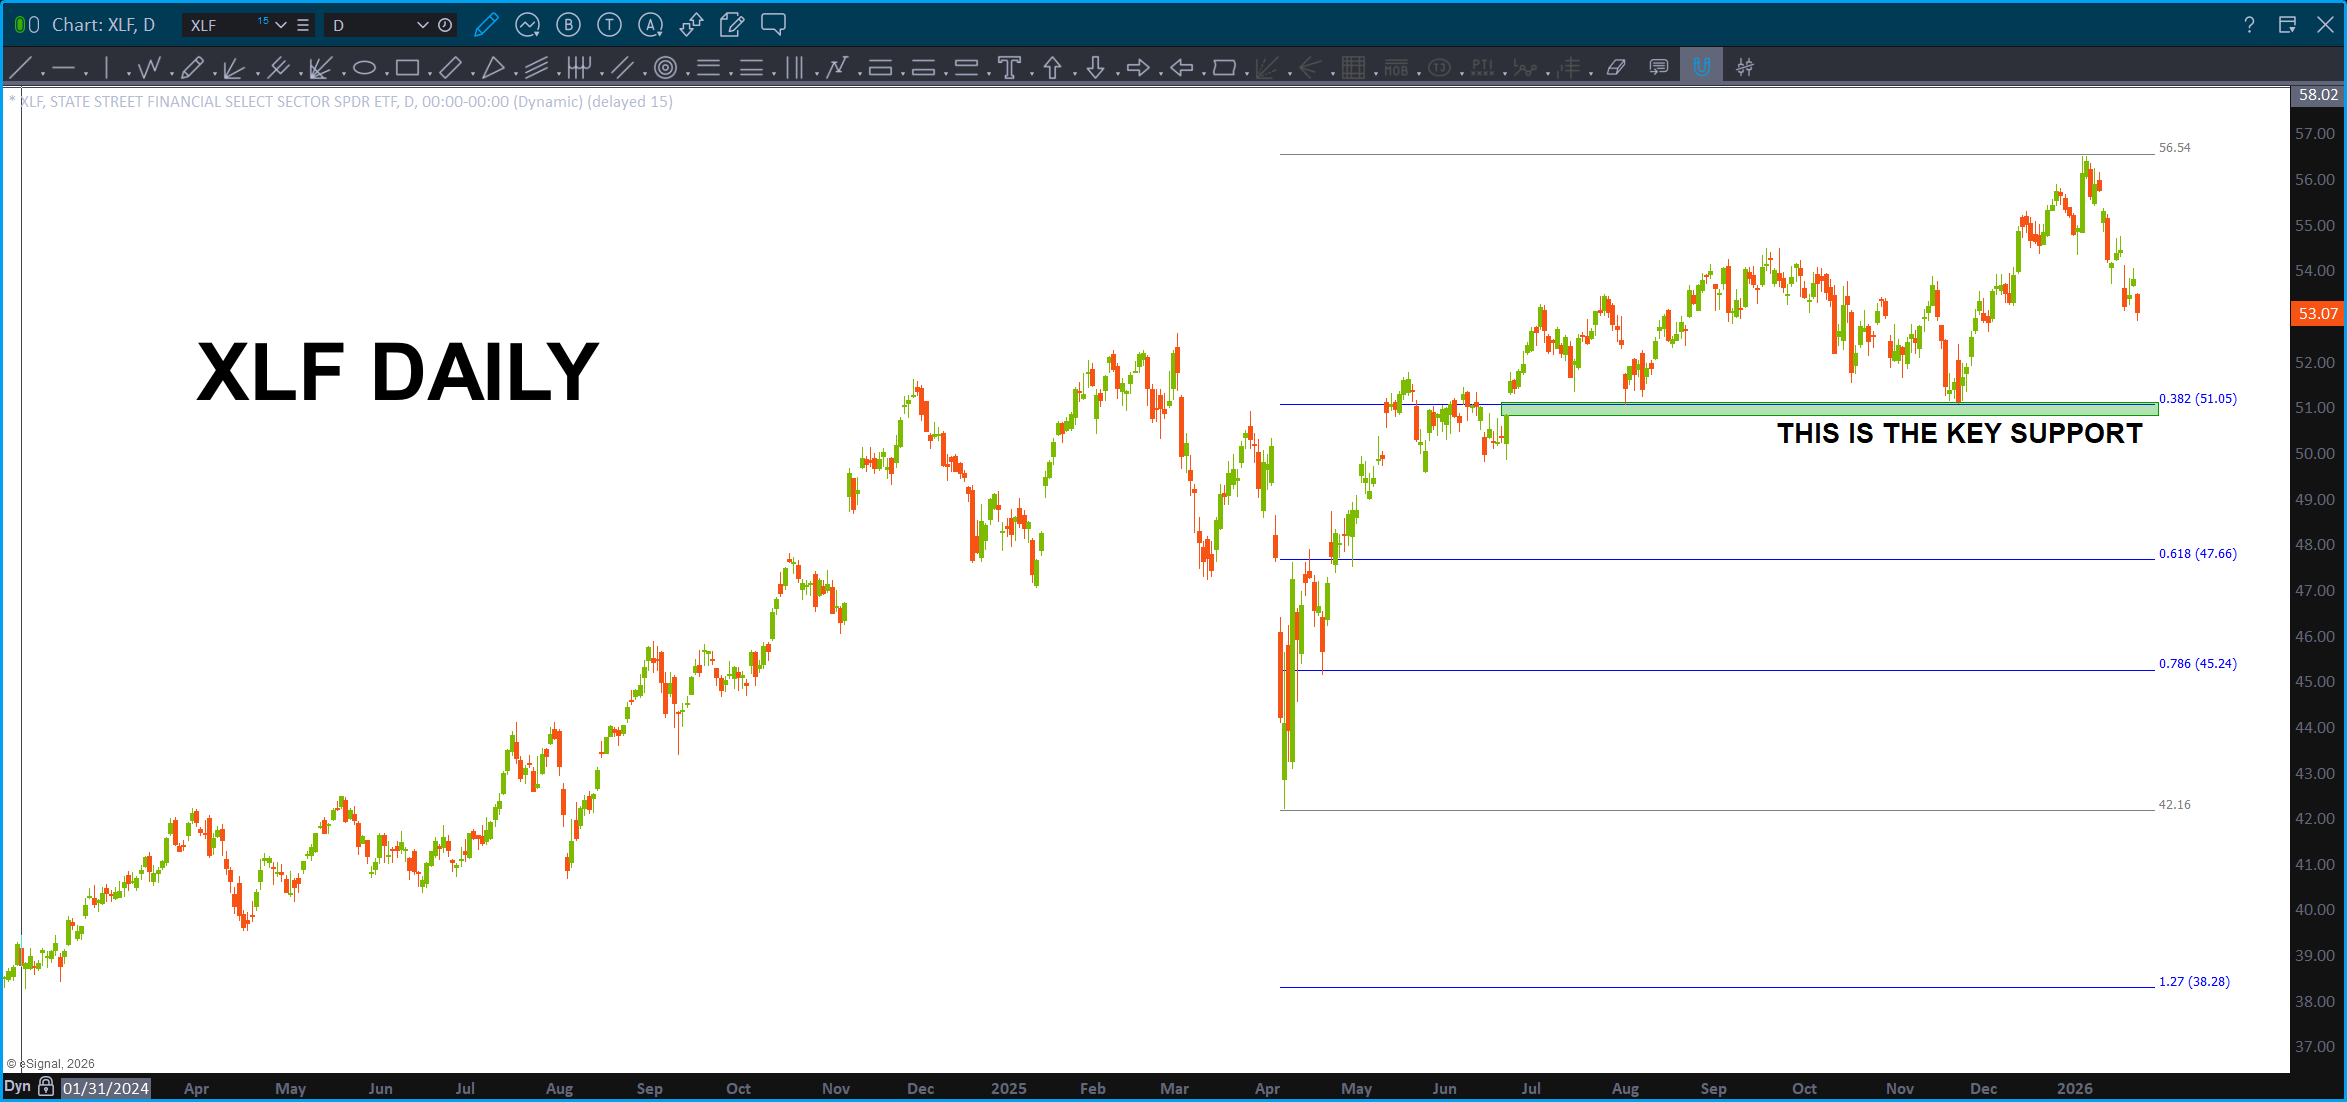
You can see the key level for the banks – and- truth be told – the entire market to be honest by the “this is the key support” – guess we’ll have to wait and see.
Figured I put this one out there … the Global Dow. What am I missing … sure looks like in the life of this index, there hasn’t been one move higher than the blue measured move.
New Car or Toilet Paper? January 14, 2026

Ratio analysis, you gotta love it …
Last night we showed you a bunch of charts. The most important, at least for me, was the chart of the XLP/NYA ratio. Been blogging about this target zone for a WHILE. Was getting really sick of it to be honest :), and, remember, the PROJECTION lies right on the .786 so ‘ technically’ it hasn’t been hit but, I’m making the call based on the PRICE and TIME confluence (price being percentage same).
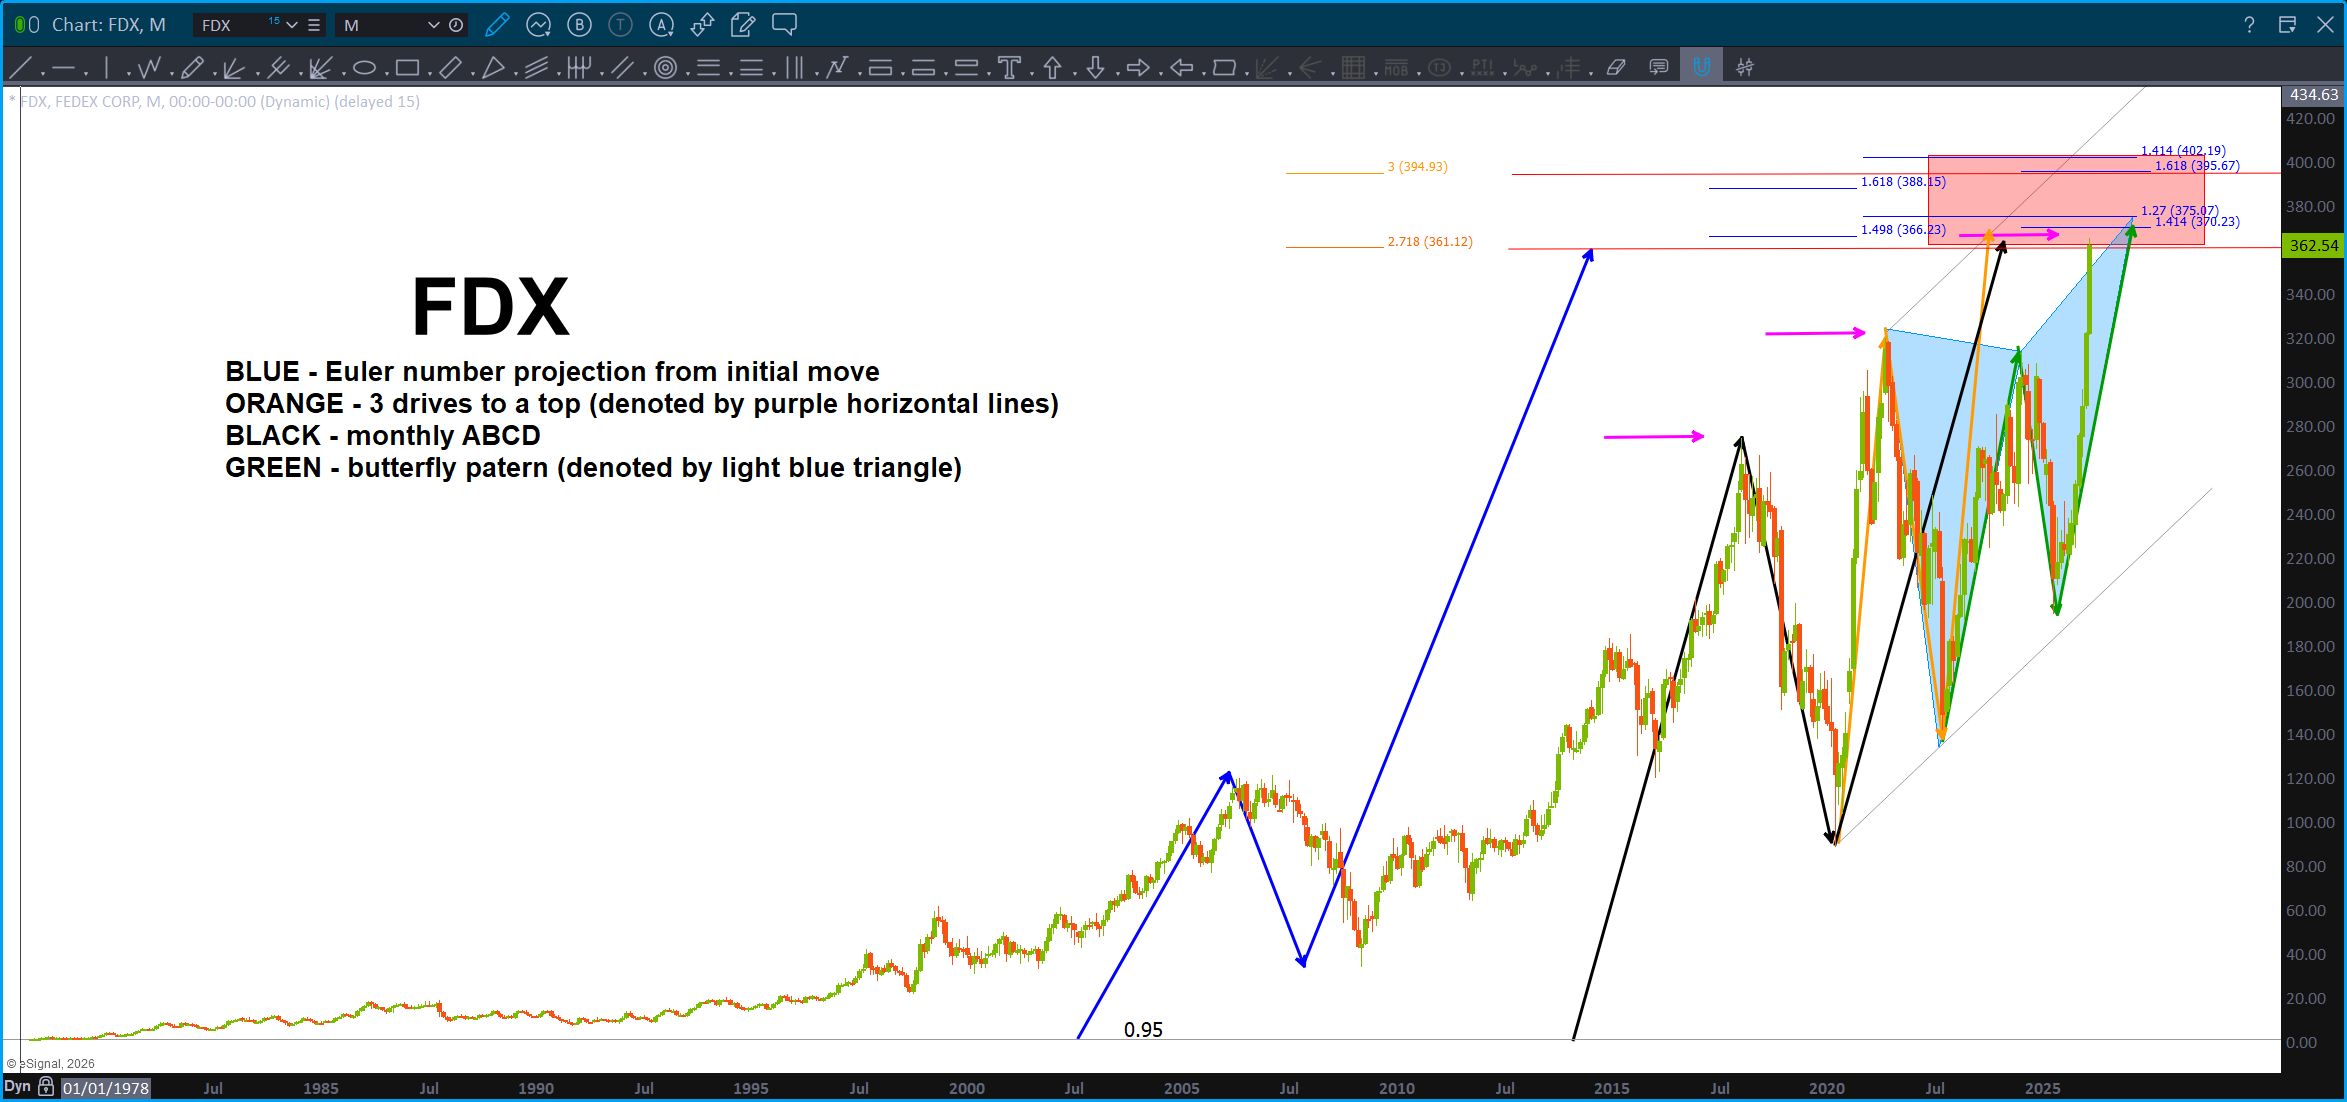
Here’s another one popular among technicians. Discretionary / Staples.
Discretionary – I’m going out and buying my NEW CAR! Let’s go the bull is on ….! woot …
Staples – everyone needs TP, propane, toothpaste, etc. The ‘staples’ of life. Ain’t nothing discretionary about that!
So, when the chart is going UP UP and AWAY life is good …when it’s going down, not so much. Not surprised to see it has been going down the past couple days/weeks (kind of makes sense) but what I did not expect was the PATTERNS that are completing to be present like they are. Especially in light of the beautiful BUY pattern present on the XLP/NYA, the financials topping at their measured moves and the YEN did not go above the pattern we were discussing last night. Well, ok then …
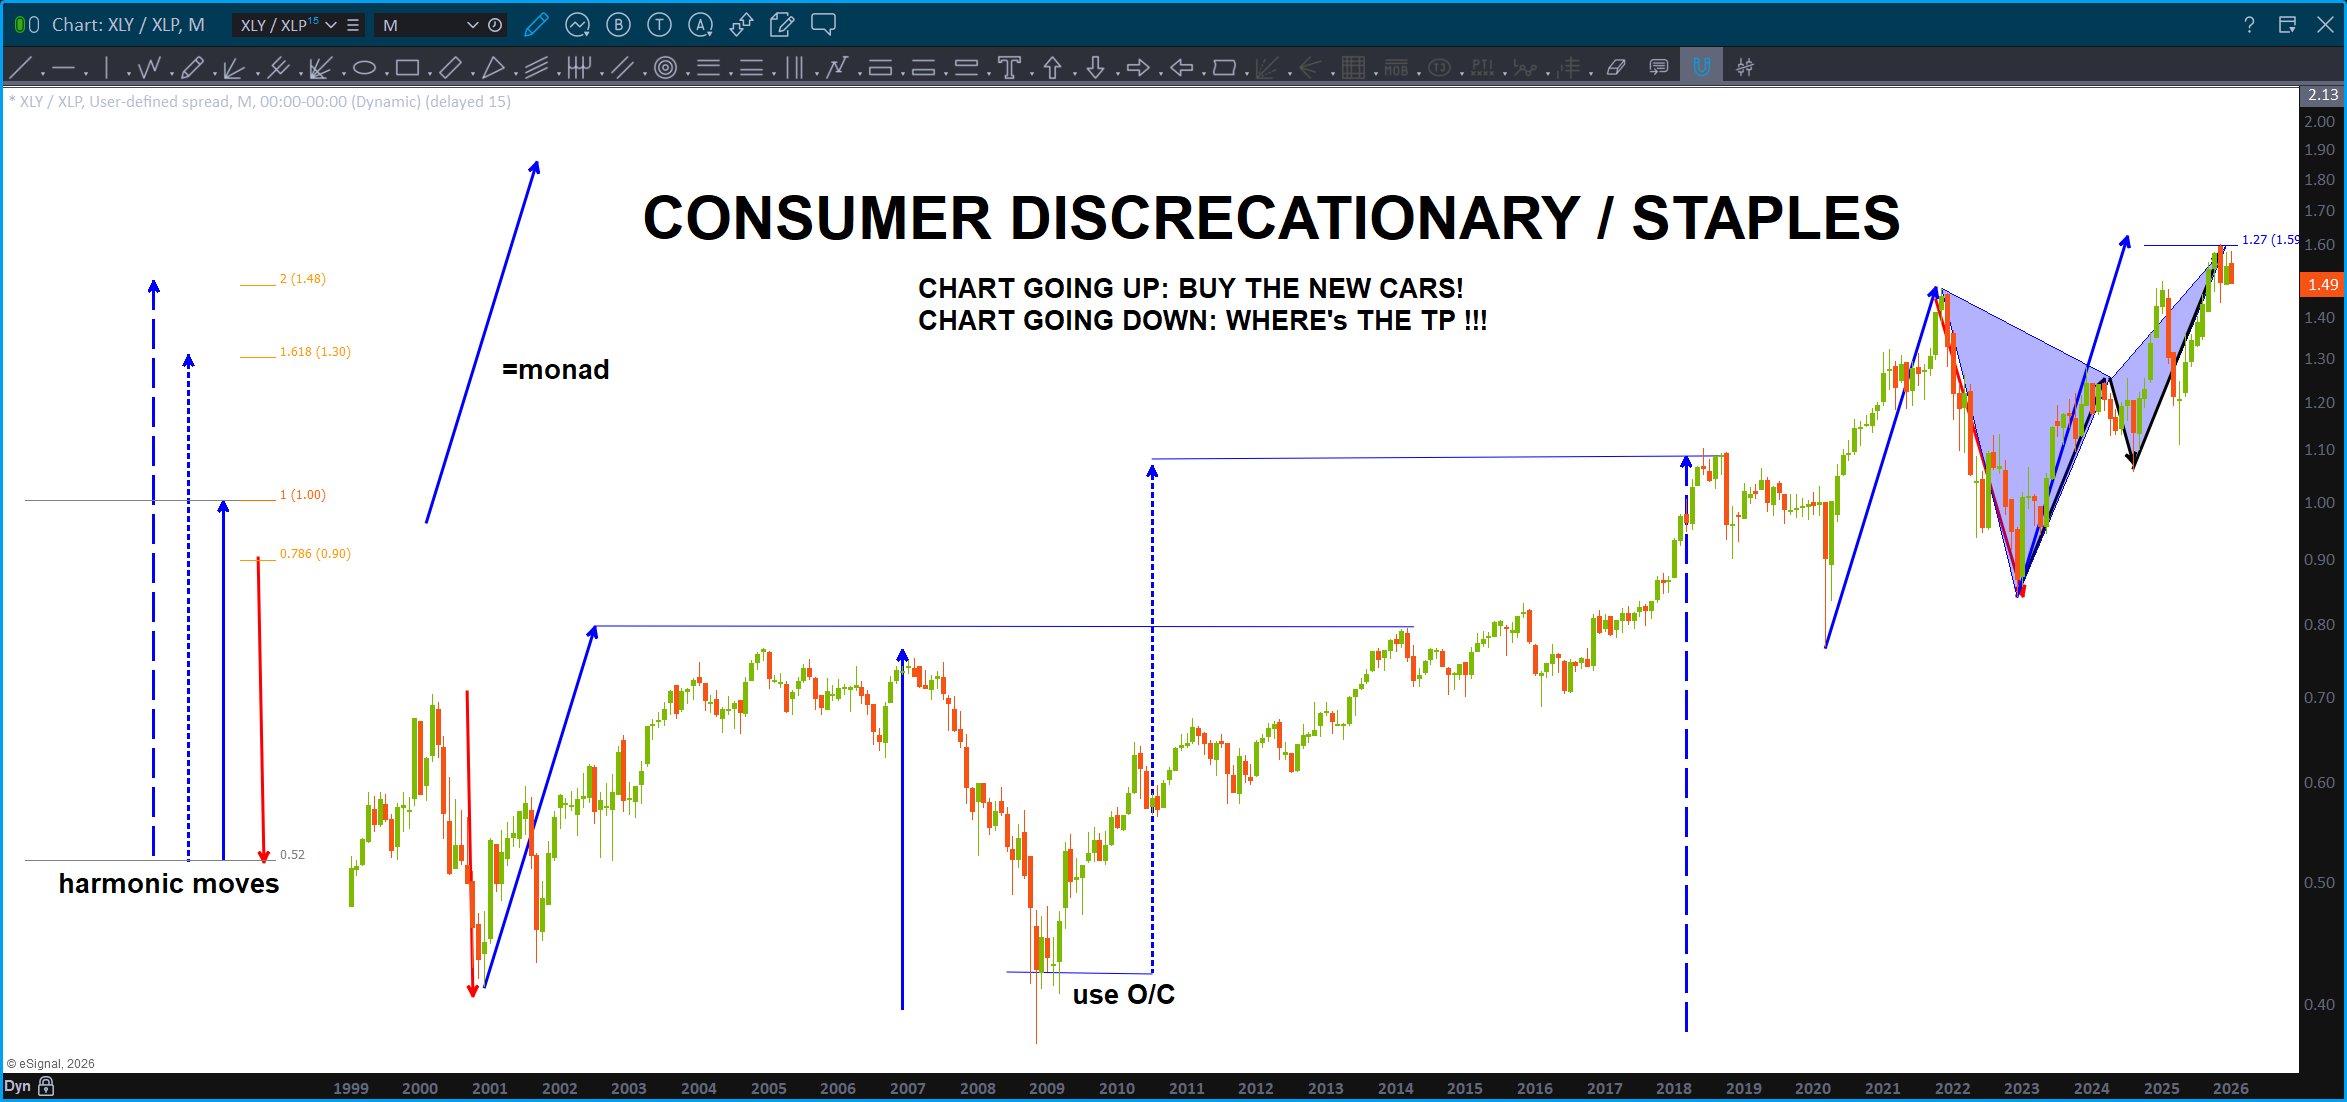
Folks, we have an ABCD (monthly) and a BUTTERFLY (perfect CD leg in price and time) along w/ a three drives to a top pattern. WOWZA …in normal terms, it appears that people aren’t going to be buying their new cars anymore because this ration has smacked into HUGE resistance.
Last, look at the harmony w/ the ‘monad’ to the left of the screen. All the moves are harmonic to the solid blue arrow. Just stop and try to comprehend, what is going on here … this chart is bouncing around – somehow – with harmonic fractals to the measured move that nailed the top. Even look at the ‘red’ corrections – yup, the same.
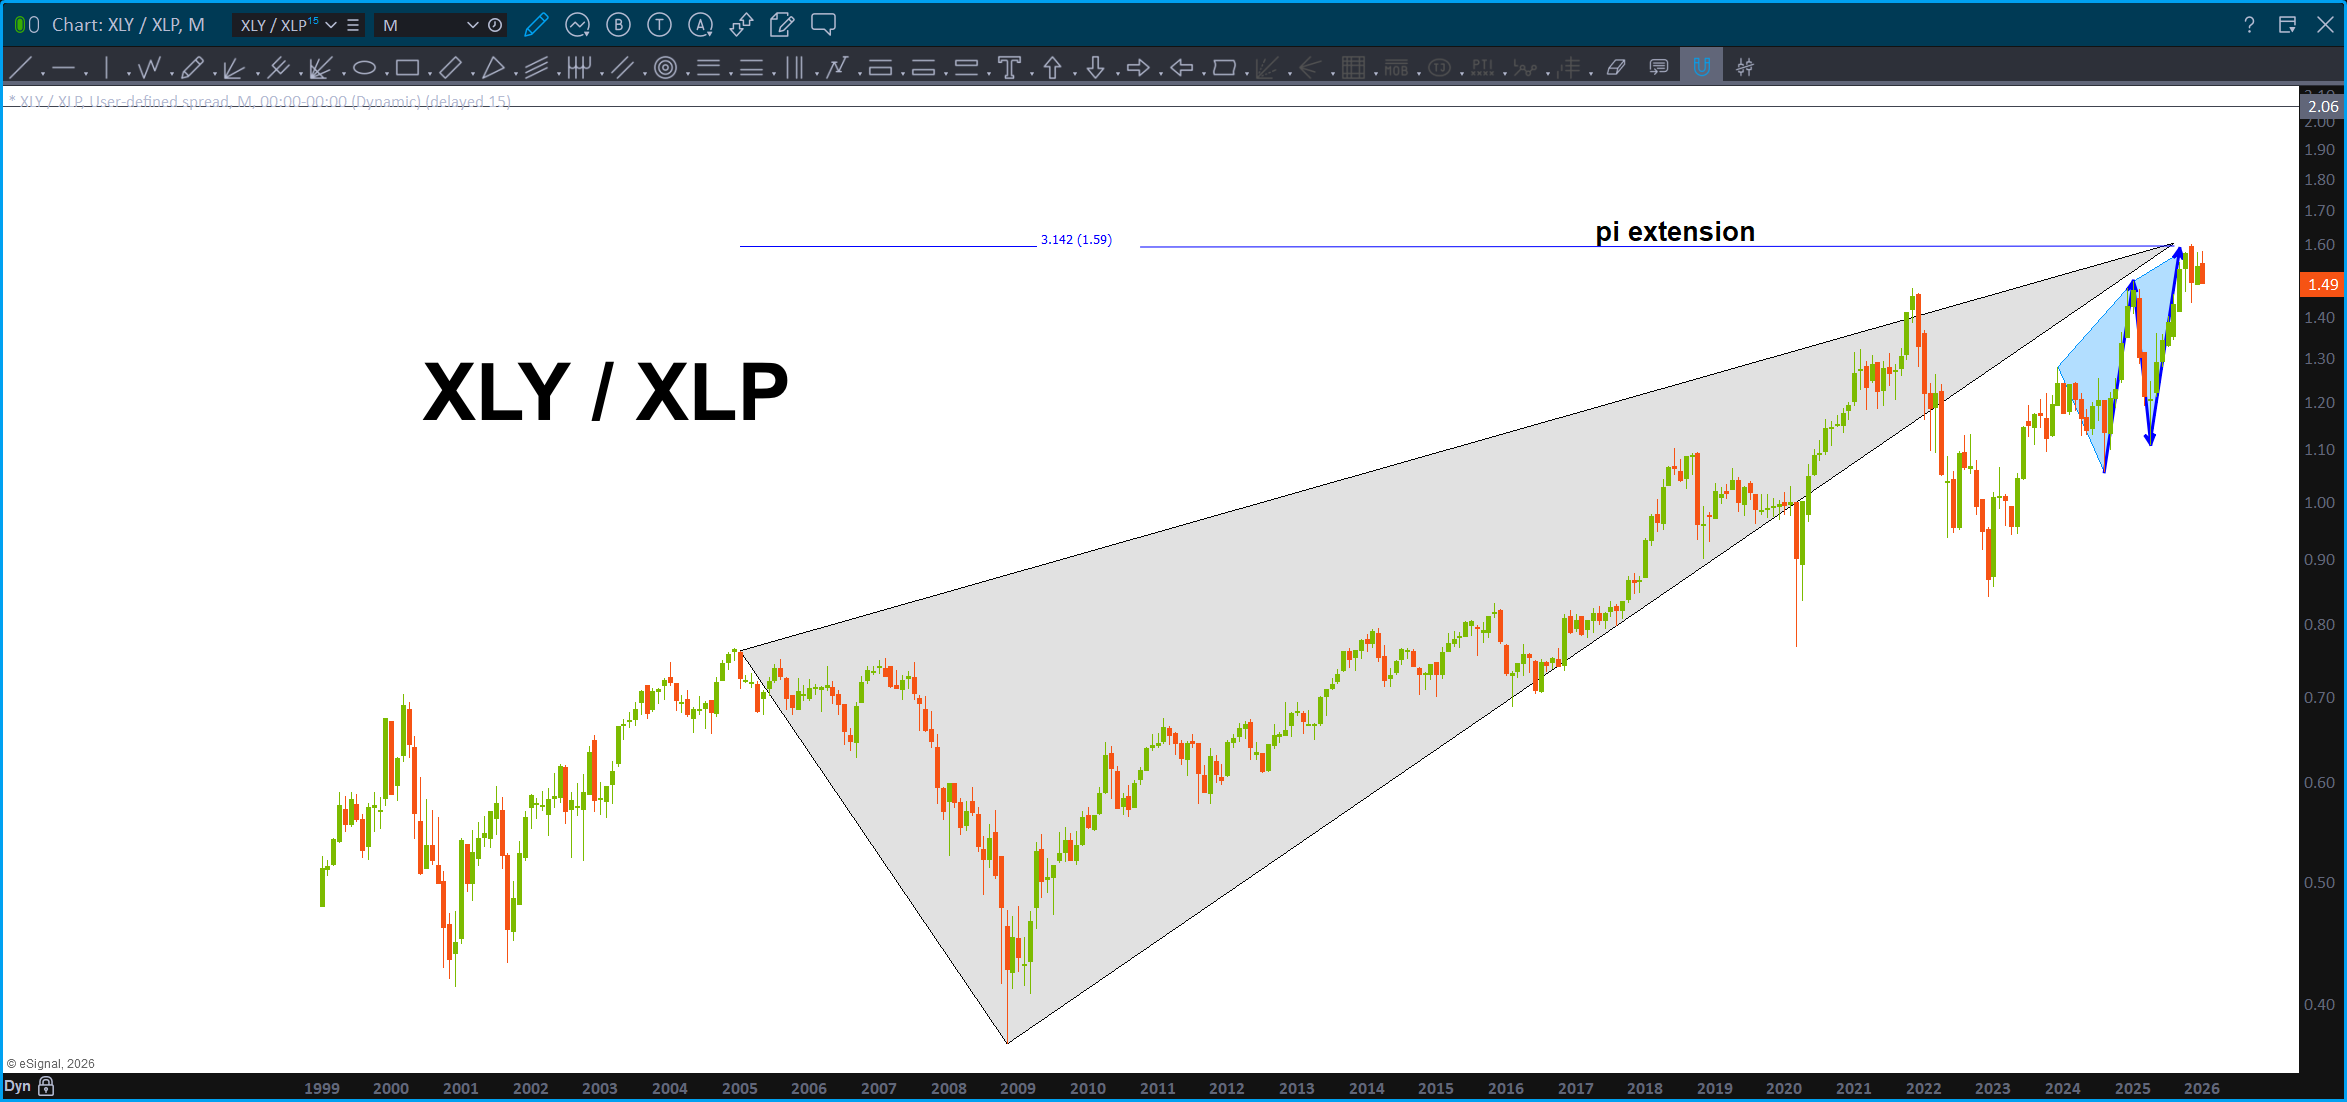
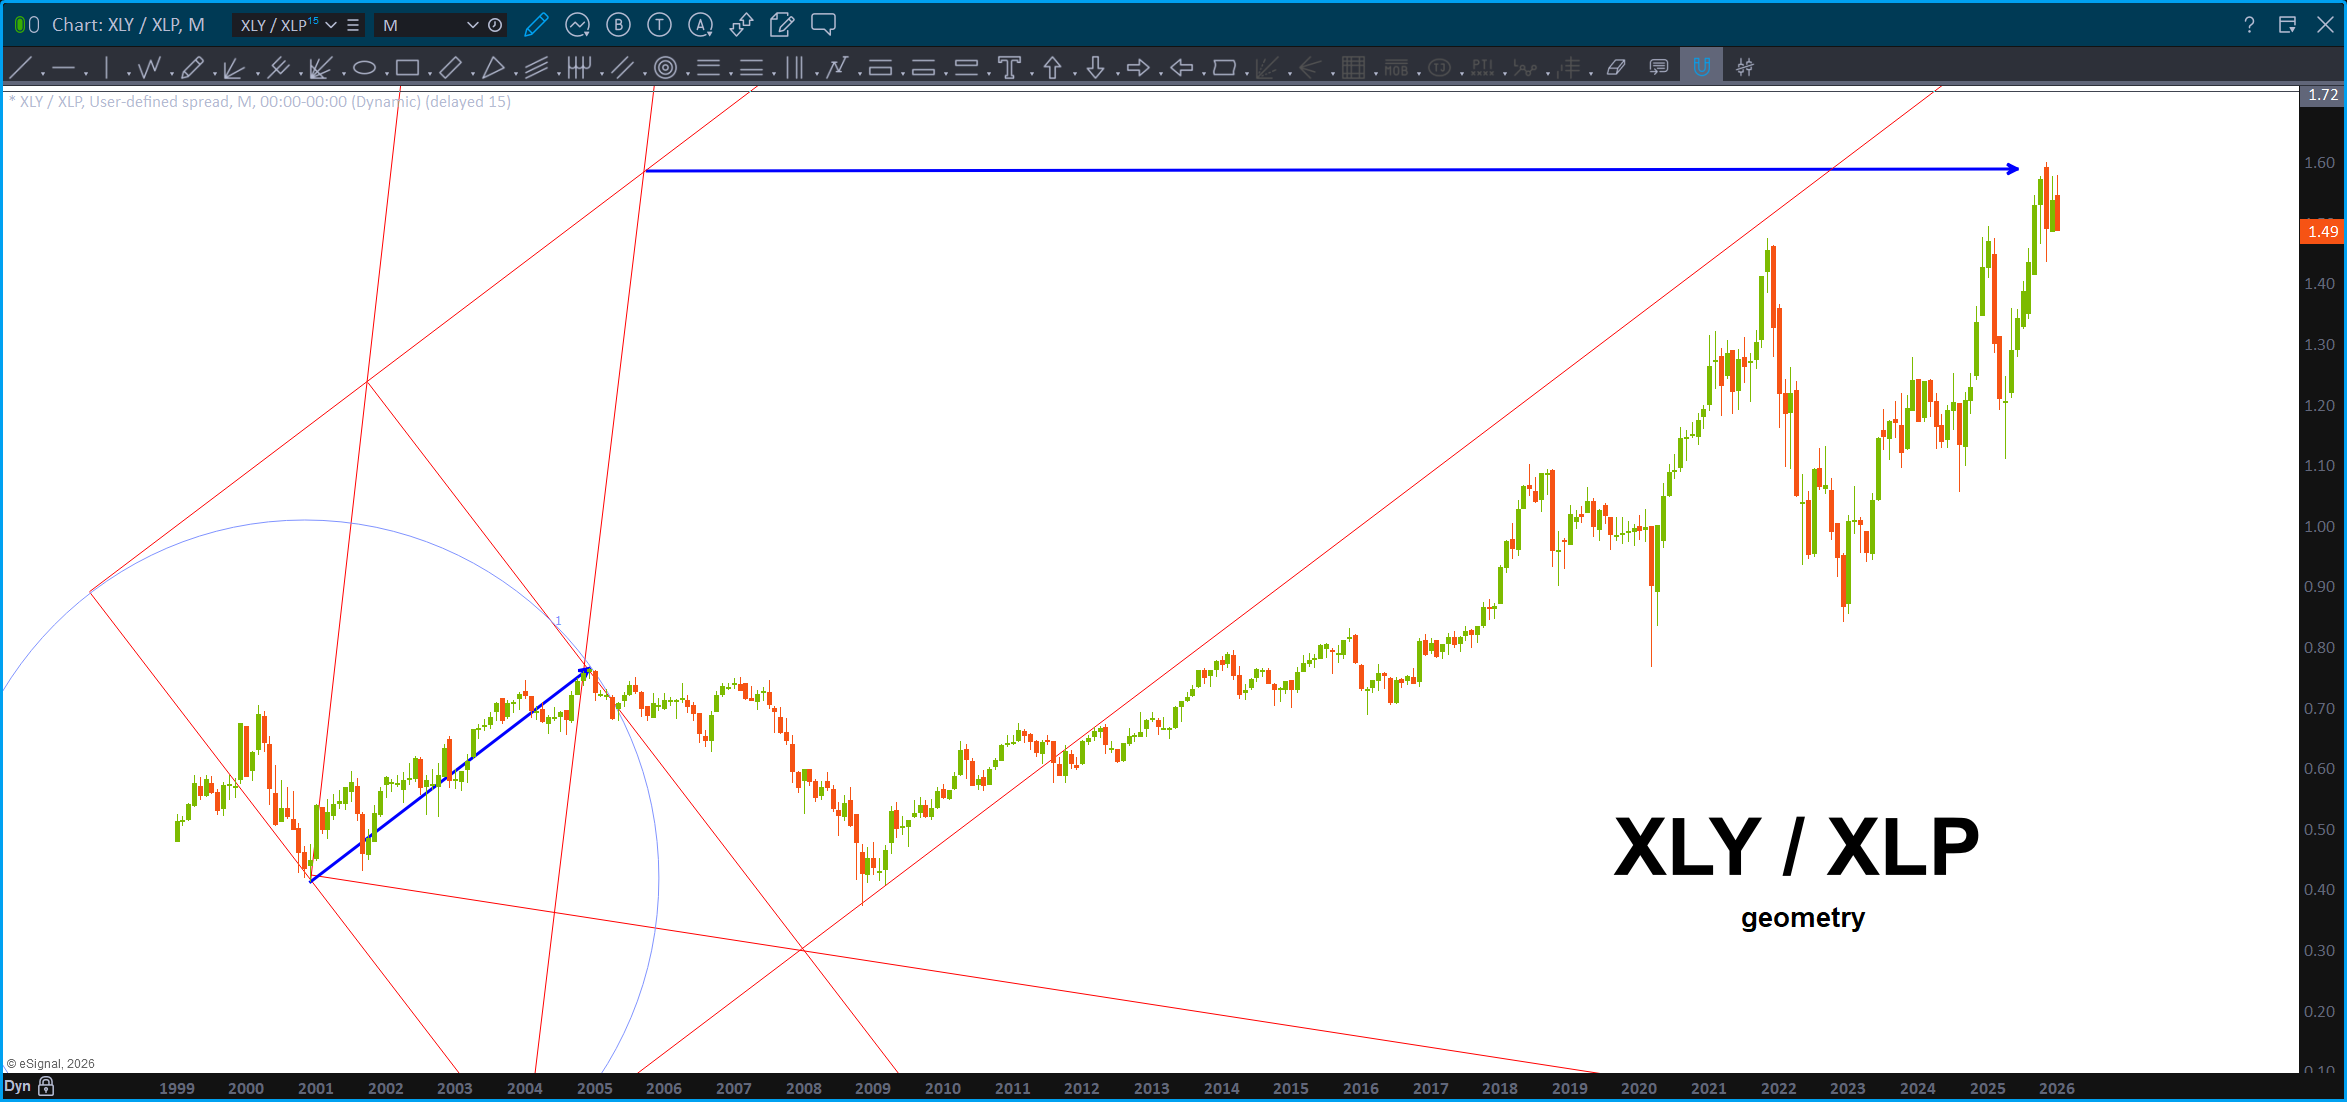
Then, it does all go back to geometry:
Folks, pull the plug, the tops in.
This analysis is wrong if the .786 level on the XLP/NYA breaks down w/ a daily (or weekly for more conservative) close below this level.
Oh, and don’t forget, it’s just a pattern. 🙂
Some charts … January 13, 2025

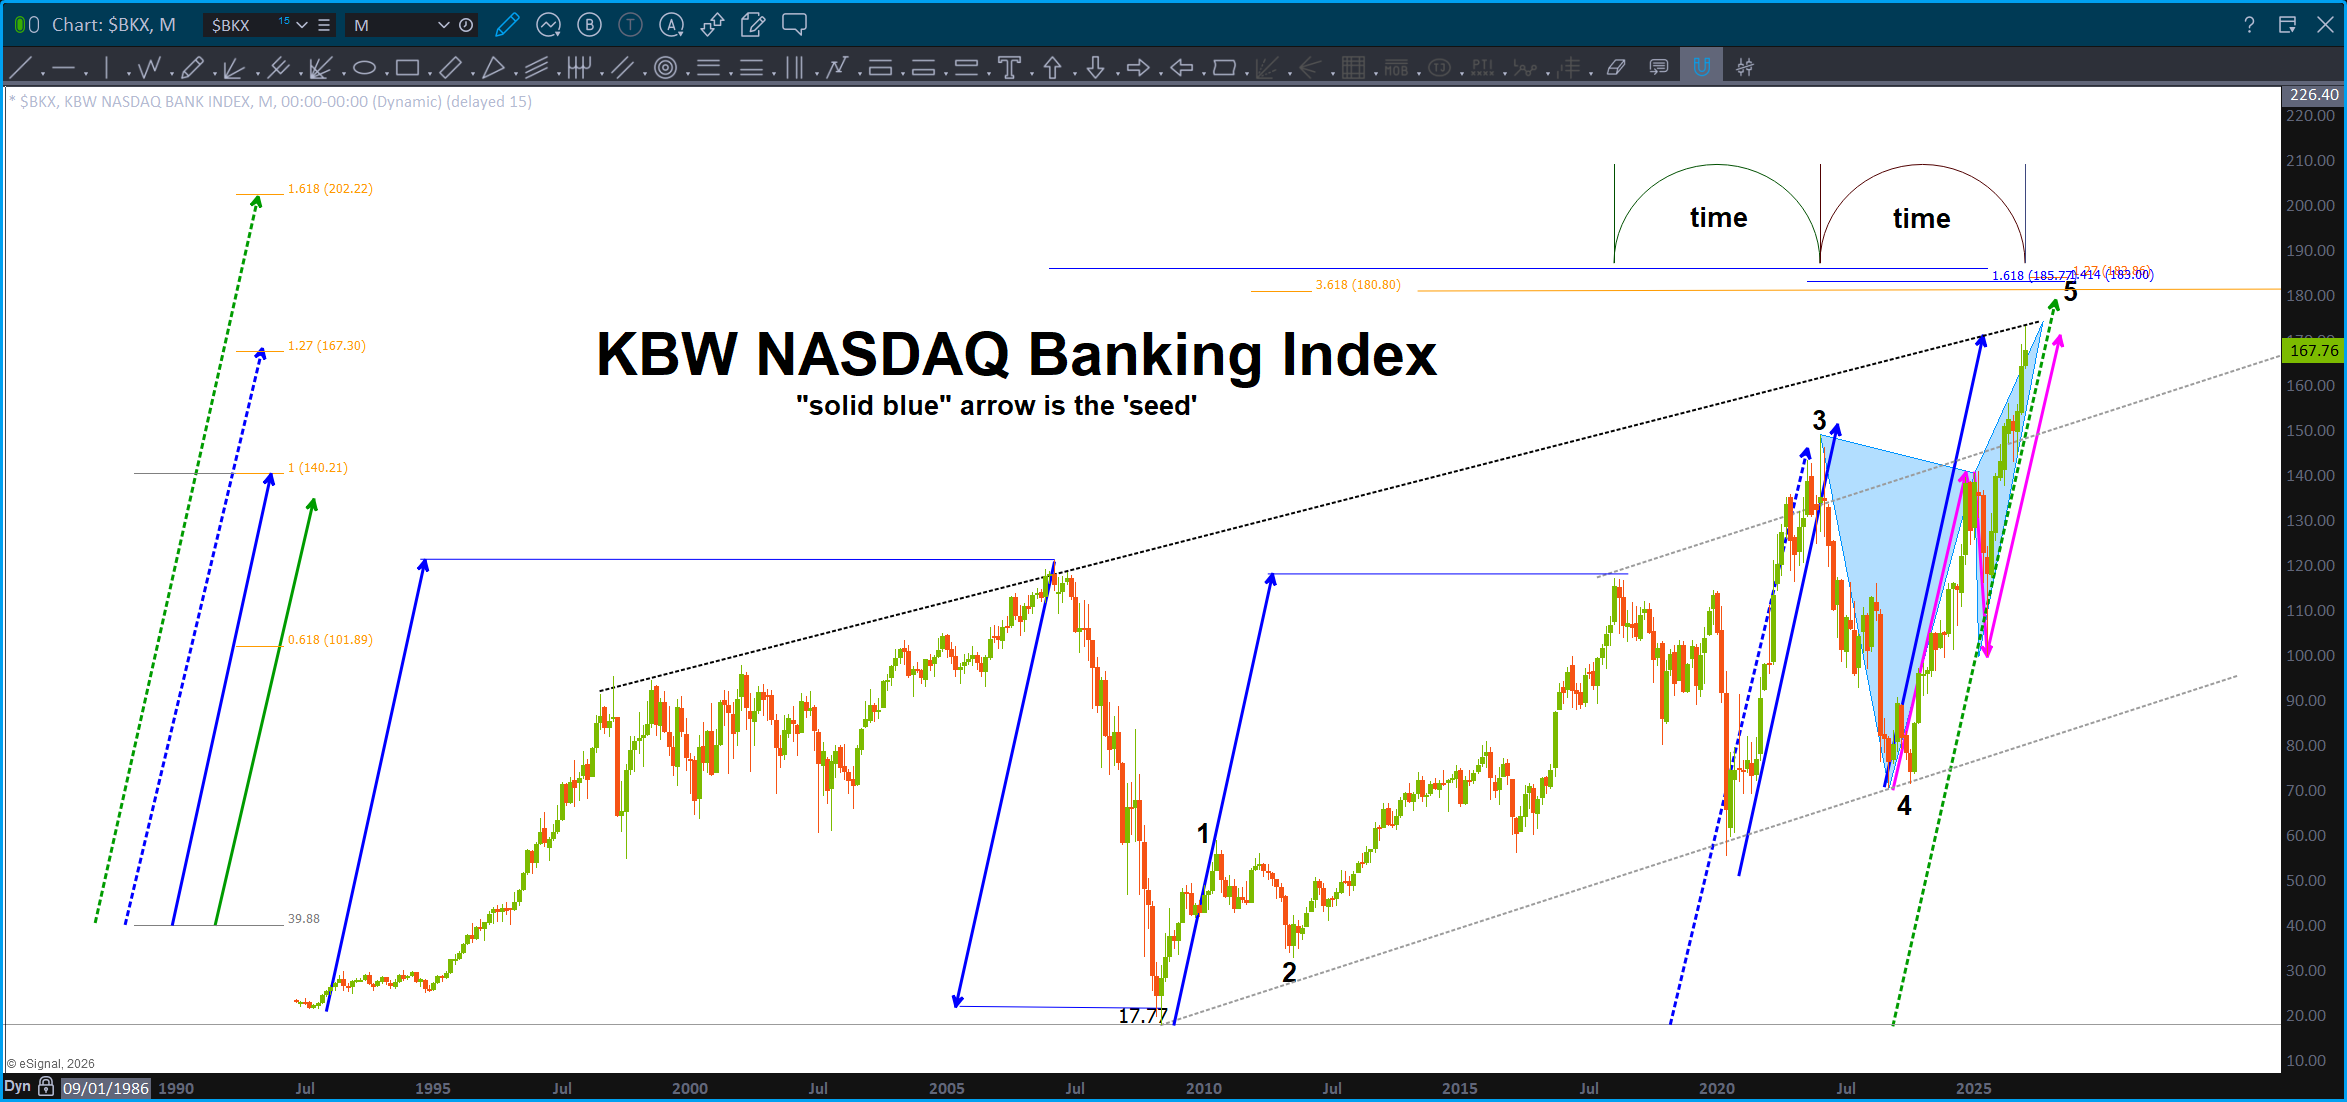
Shown this one a couple times … certainly looks like we are getting or at the VERY crucial resistance level on the KBW.
Same picture, sort of, w/ the XLF:
Folks, I’ve been blogging about the banks/financials – they lead us up and lead us down. Until “they” crack this fragile march up the wall of worry can continue. That being said, these charts are showing the measured moves associated corrections in the past are appearing, now.
The two charts above also exhibit a clear 5 waves … hmmmm.
Well, how about JPM?
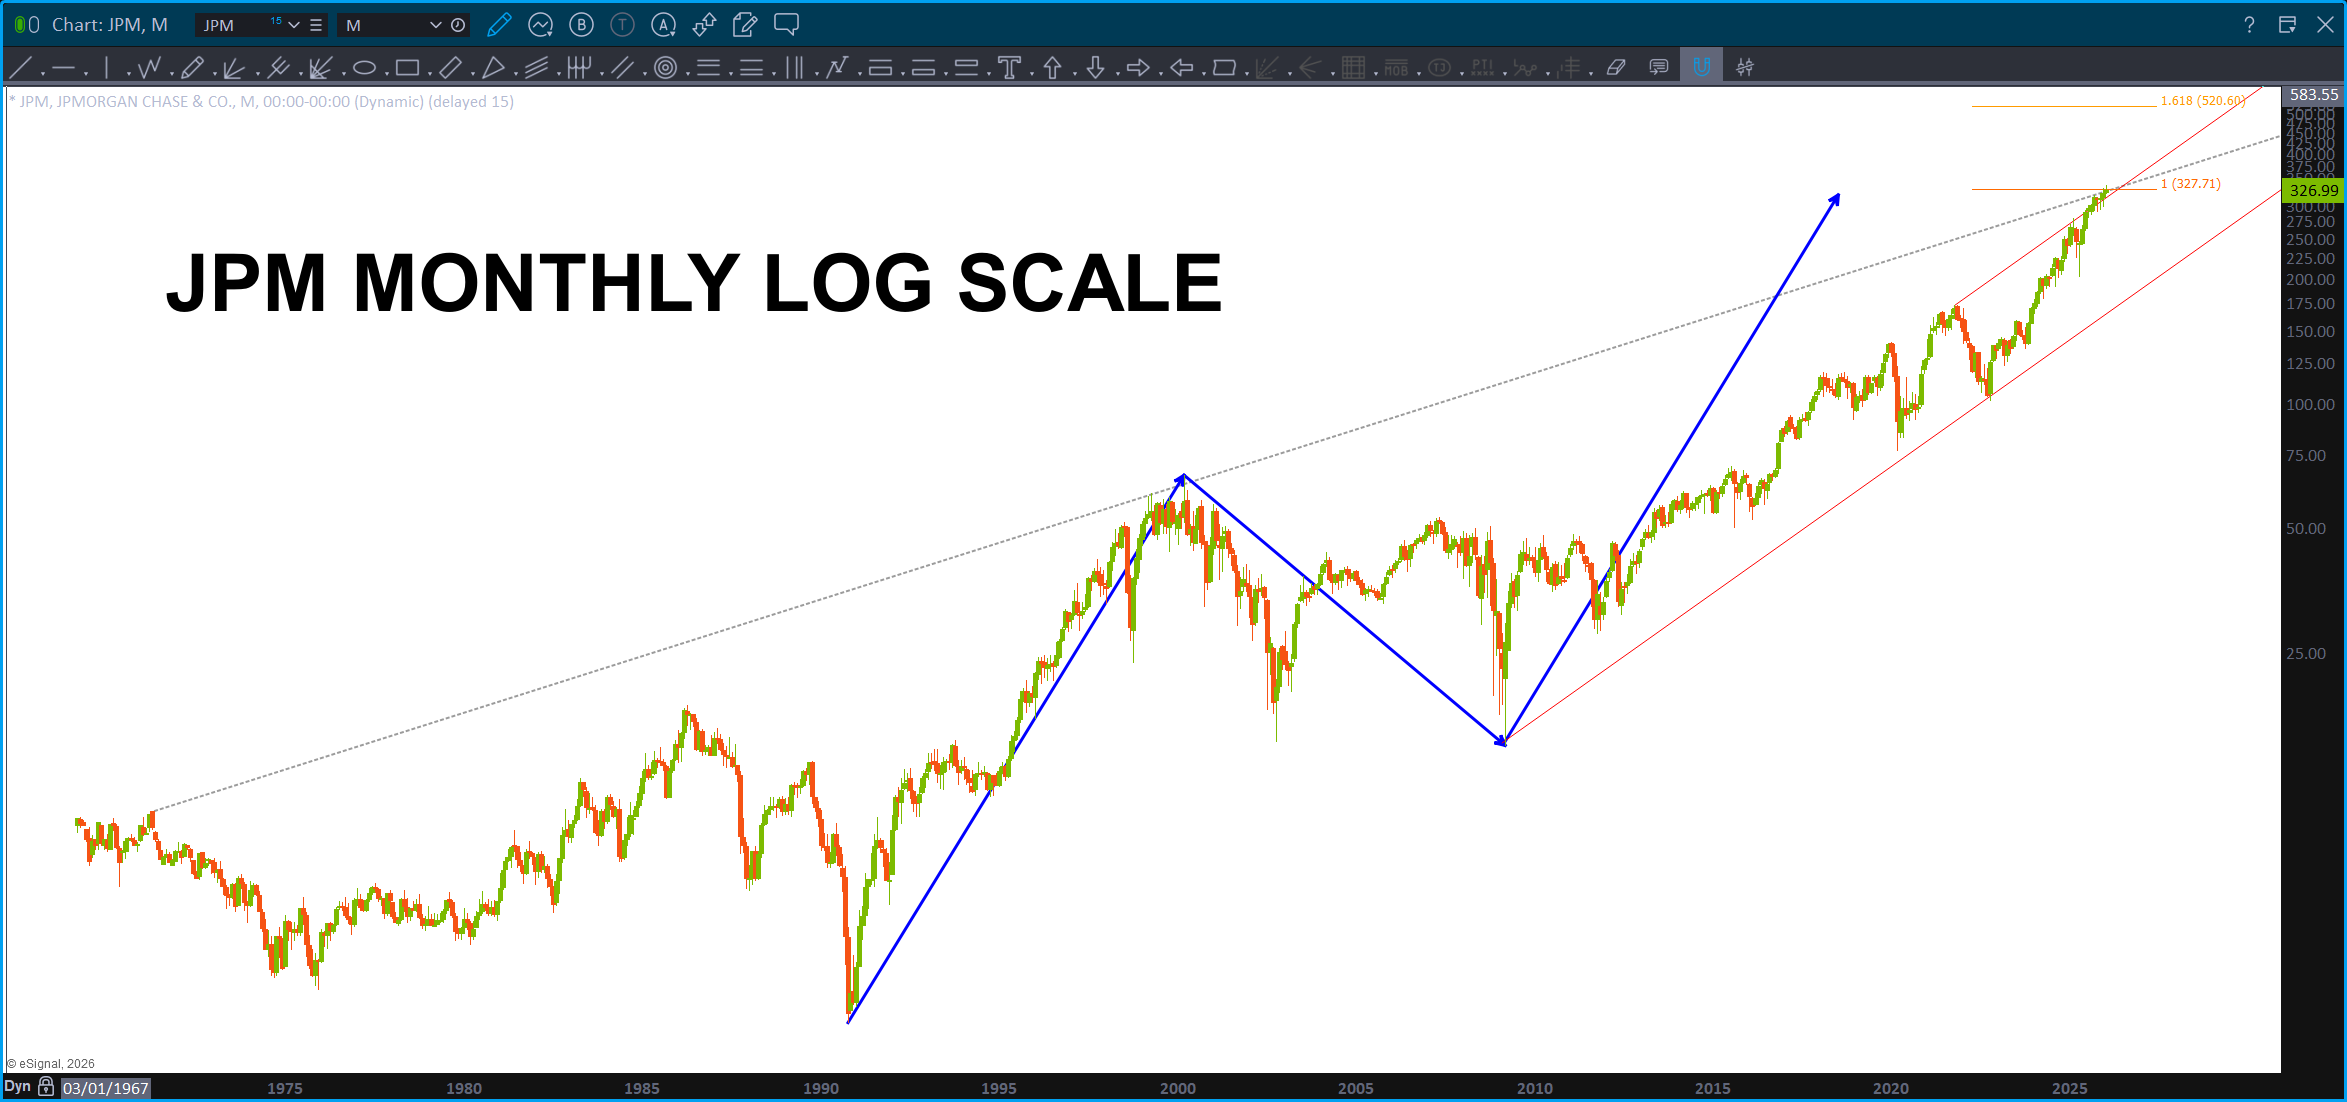
Note, this is a Monthly, since IPO, chart of JPM. Also note, it’s LOG scale so we are dealing w/ percentages .. you can always tell by looking at the right (or left) price margin. When it’s normal spacing you are using normal scaling but when you see big jumps like above – that’s LOG scaling. Well, guess what? ABCD on LOG scale works also! So … couple converging trendlines w/ a projection pattern complete. Note, remember the above about the KBW/XLF.
Well, what else is in the news folks? Silver …yes, I’ve been tracking silver and nailed the LOW in silver (folks, it was just the same correction as the last one ..) at 11 and said ‘it will go to new highs.’
Well, now is the true confessions time … I’ve been doing some fundamental reading (woah, what?) about Silver simply because it’s a weapons system w/in the already started cognitive 5D global war which is raging around us. If you don’t think that, well, “that’s your opinion … (pause) ….man” The Dude . There is SO MUCH GOING ON RIGHT NOW FOLKS ON MANY DIMENSIONS that its hard to keep up. We are living in the most AMAZING TIMES. Period. Dot. So, the reading has helped me understand some of the moves occurring right now … but this euphoria? Well, another confession time, I went to the long term futures chart below many times and ‘in my mind’ labeled it an A-B-C long term pattern. Why?
Folks, sometimes, I just simply don’t see it. Well, when the ABCD failed – BIG OBTW 🙂 – on Silver I went to the futures chart and said could this be a 1-2 ….? And we have started and are in a WAVE THREE OF THREE? And, that my friends, it exactly what this looks like. I’m bummed I went to the dark side and read some socio-economic and foreign affairs articles about Silver because what I’m about to say really does sound funny because it’s pretty outrageous.
I could easily see Silver, from a long term perspective hitting 200 dollars in the coming days.
Here’s why:
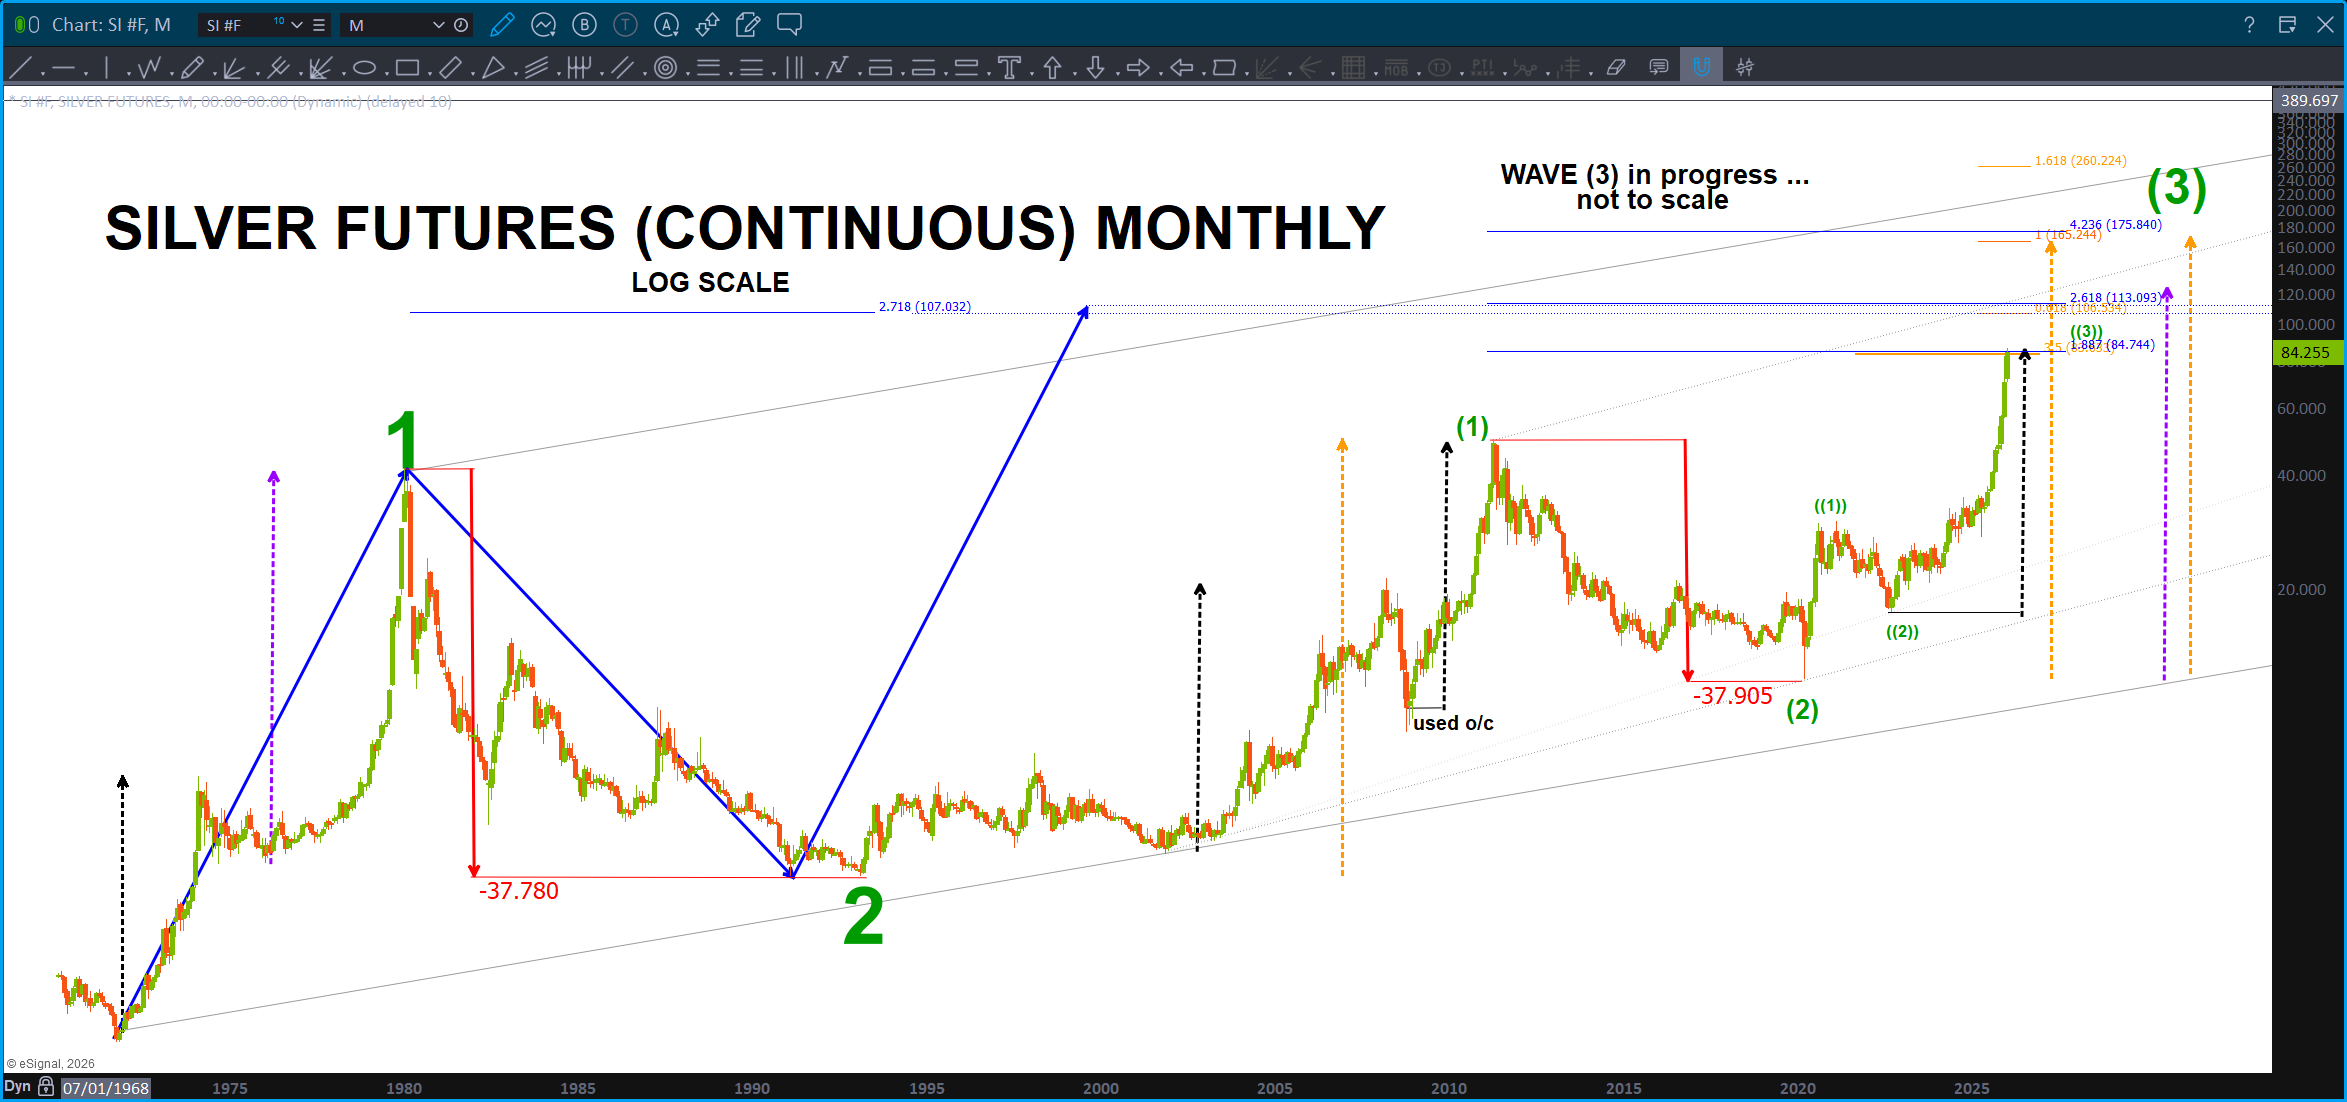
This charts goes back to 1972 folks and, IF my count is correct (obviously the big if) THEN we are going to have a pullback soon, but folks, you want to BUY THIS PULLBACK and I will be hawking it to BUY also as we haven’t even finished wave 3 yet. SILVER IS A BUY. Woah …. IYKYK. The chess match for precious metals has just got a lot more interesting, hasn’t … 200 dollar silver? Again, WOAH.
PS – remember my counting, I try. Give this a 70 percent change of being right? Maybe? 🙂
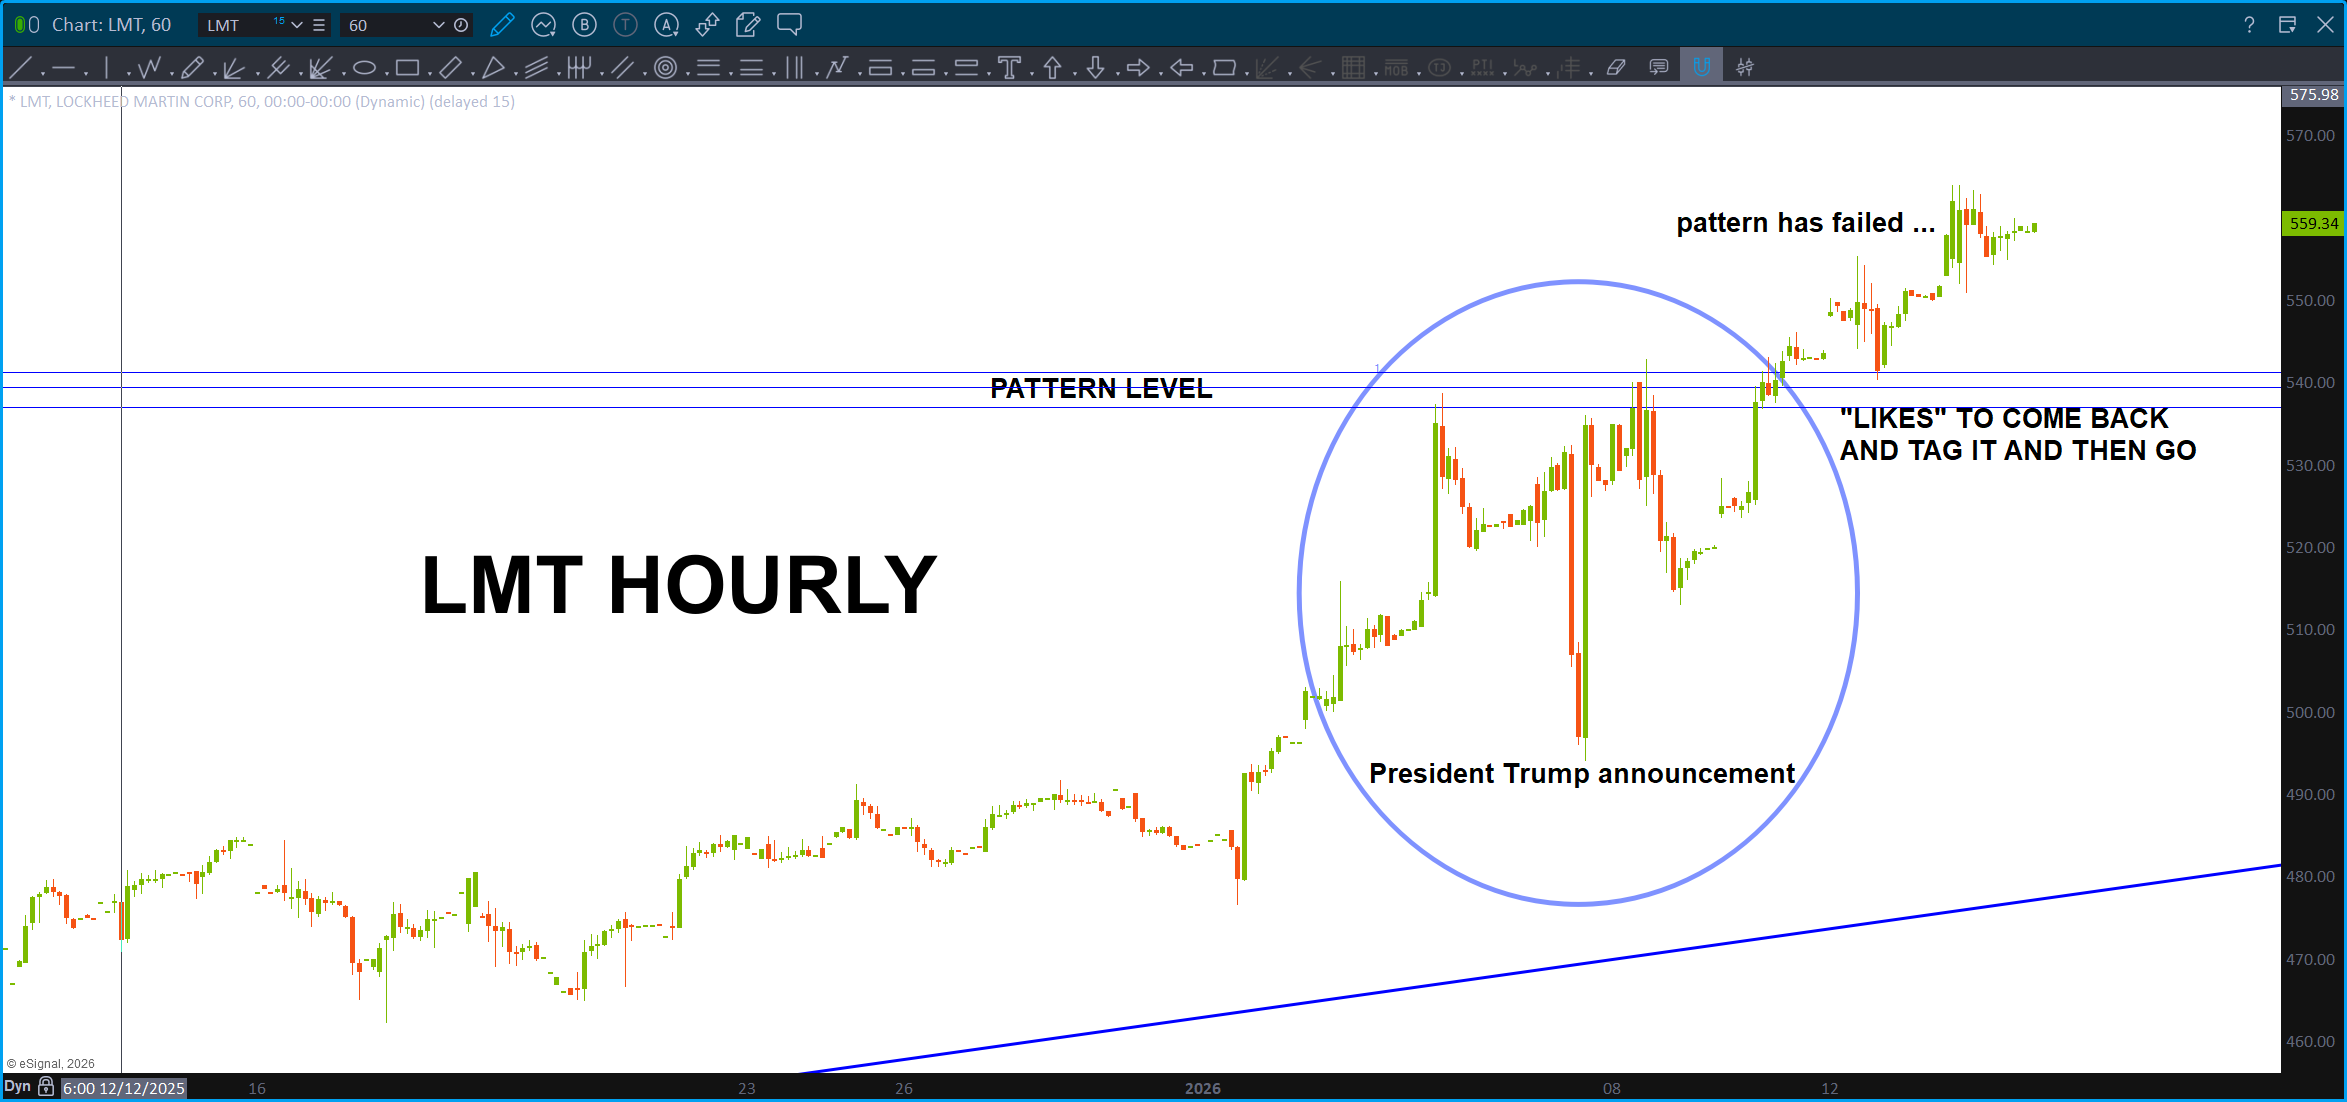
This was a pretty wild sequence on Lockheed. I had ID’d this pattern a week or so ago and I was on X w/ Ponch and we talked about LMT PATTERN and how it would probably fail (w/ the war and everything) but just look at it and remember what Trump said and then the budget request so … it bounced right off the pattern. Crazy.
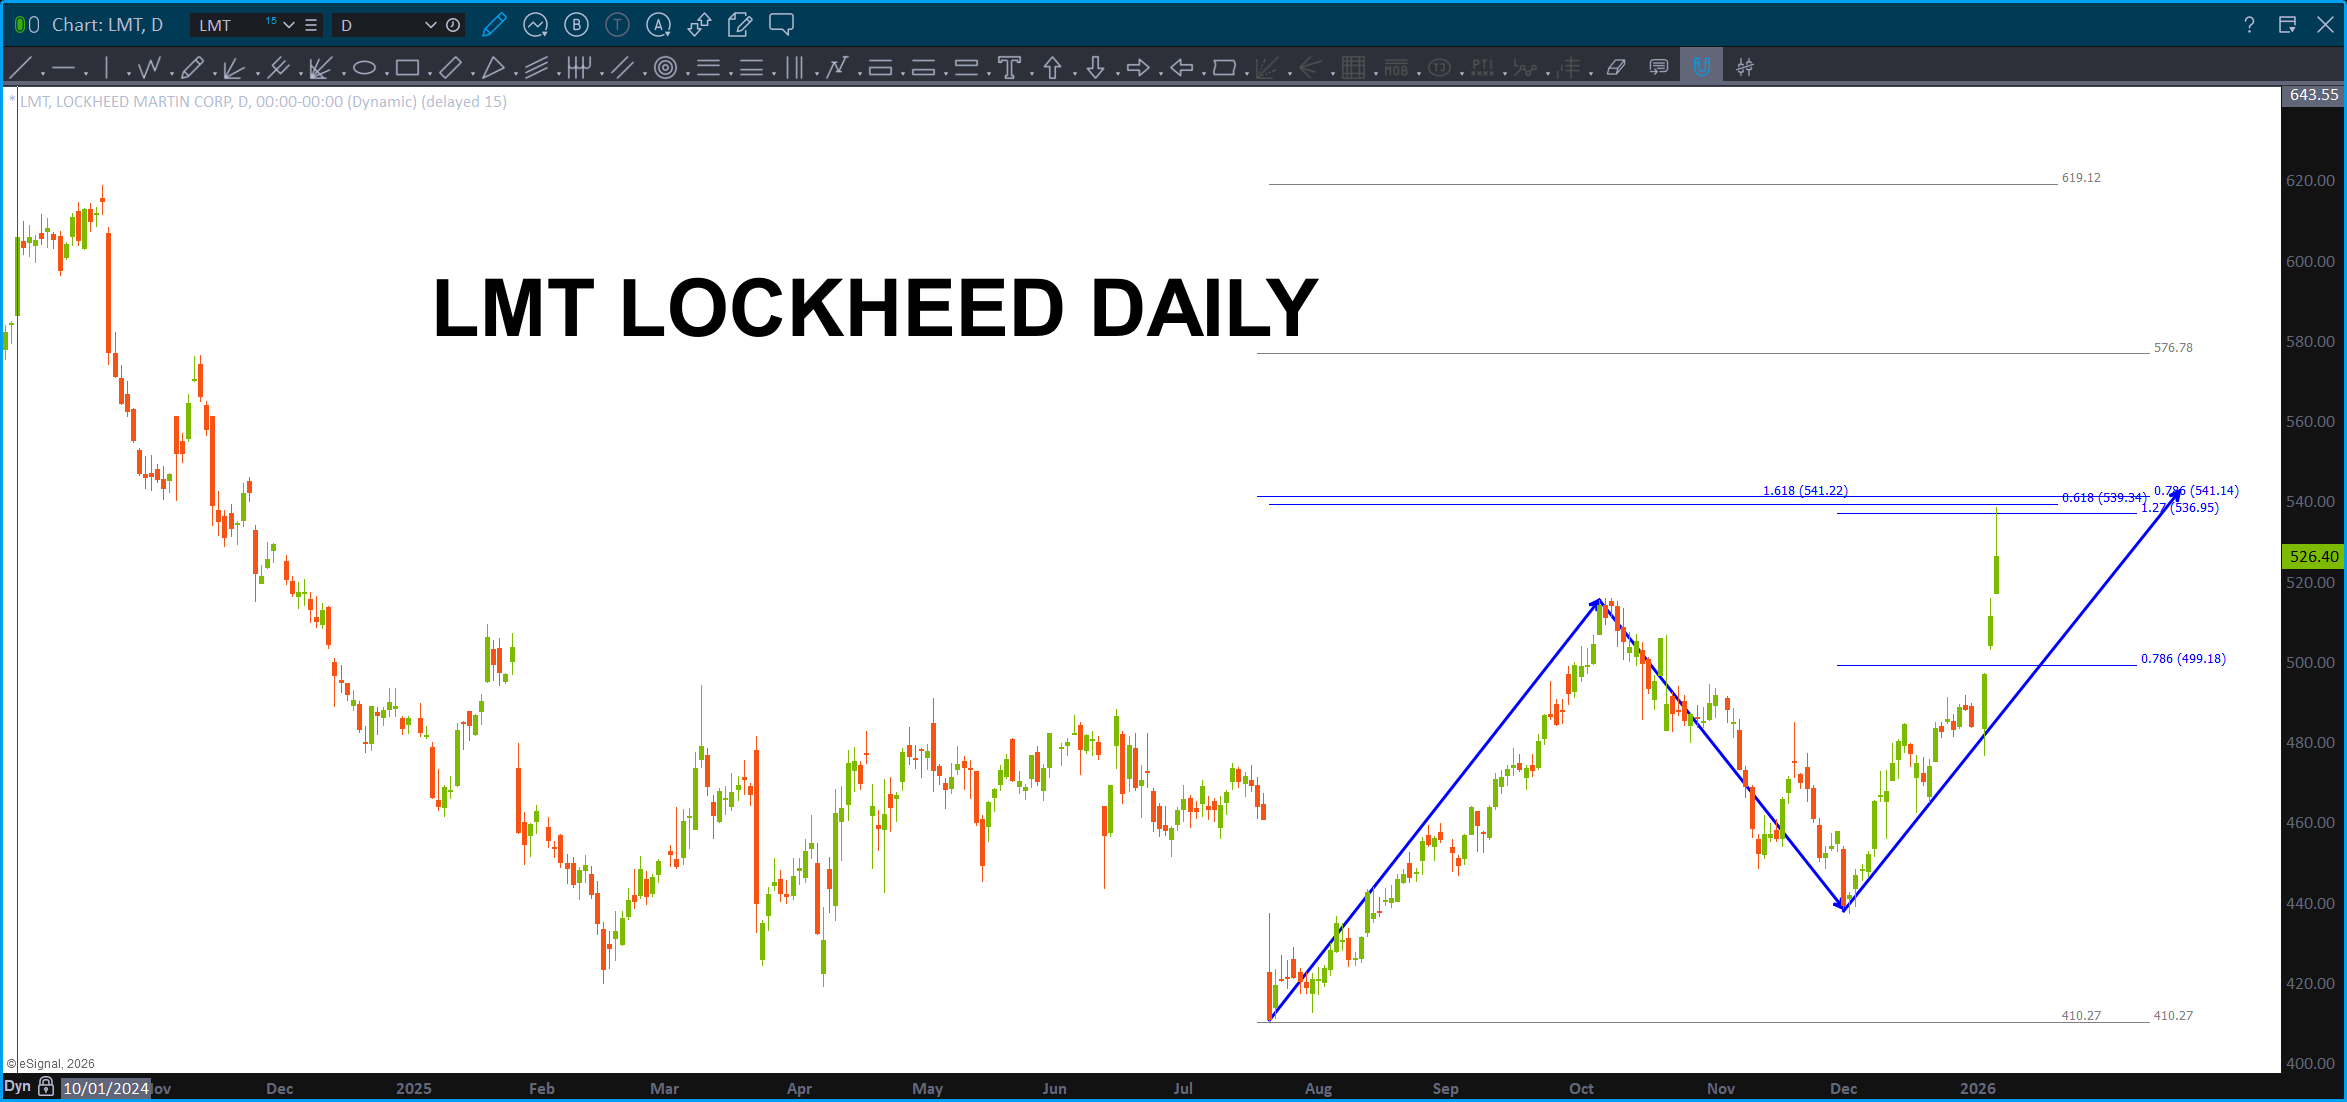
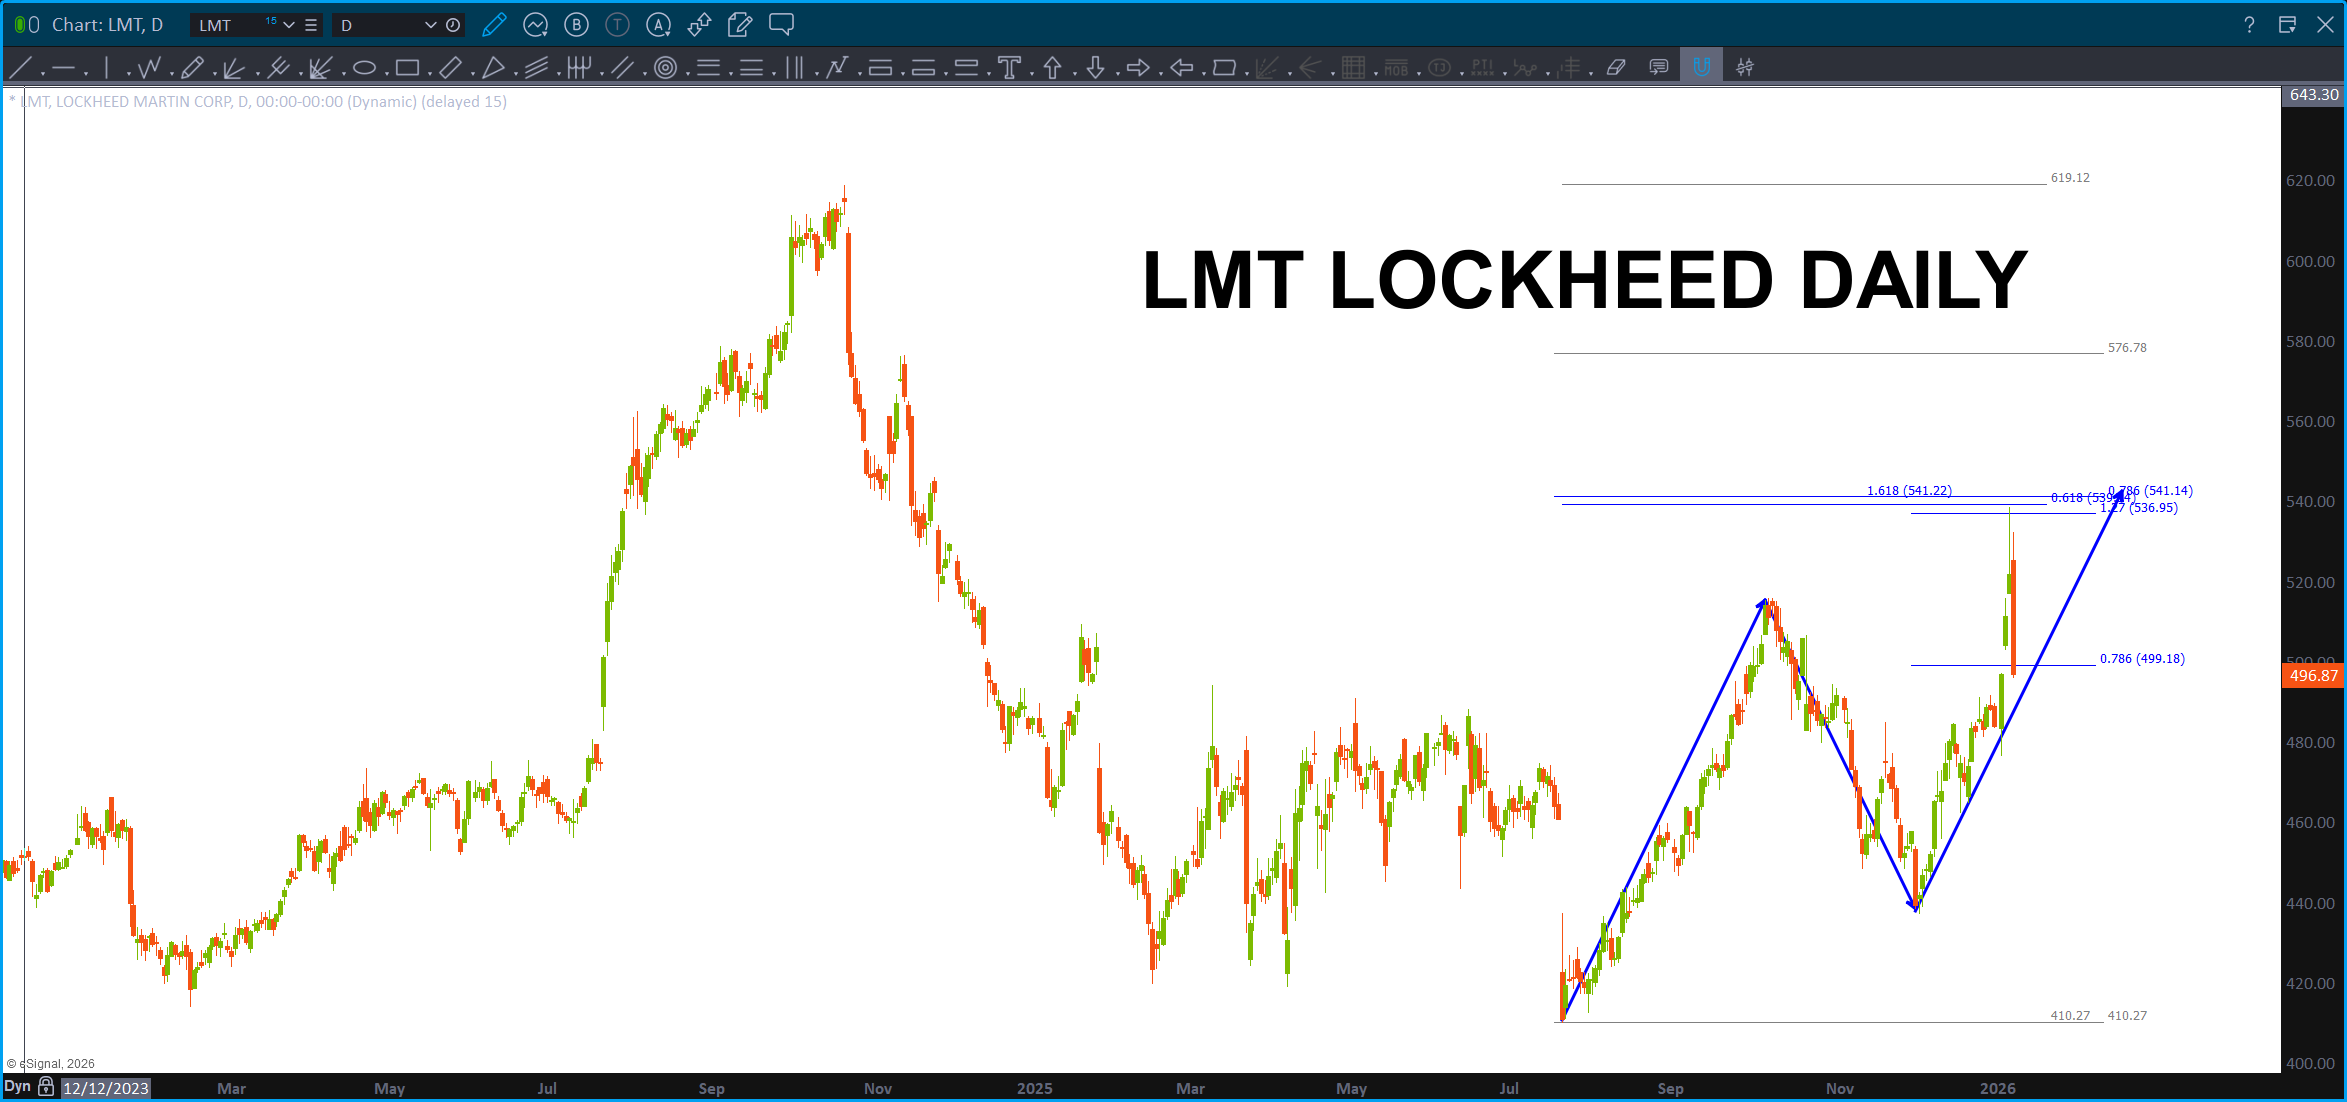
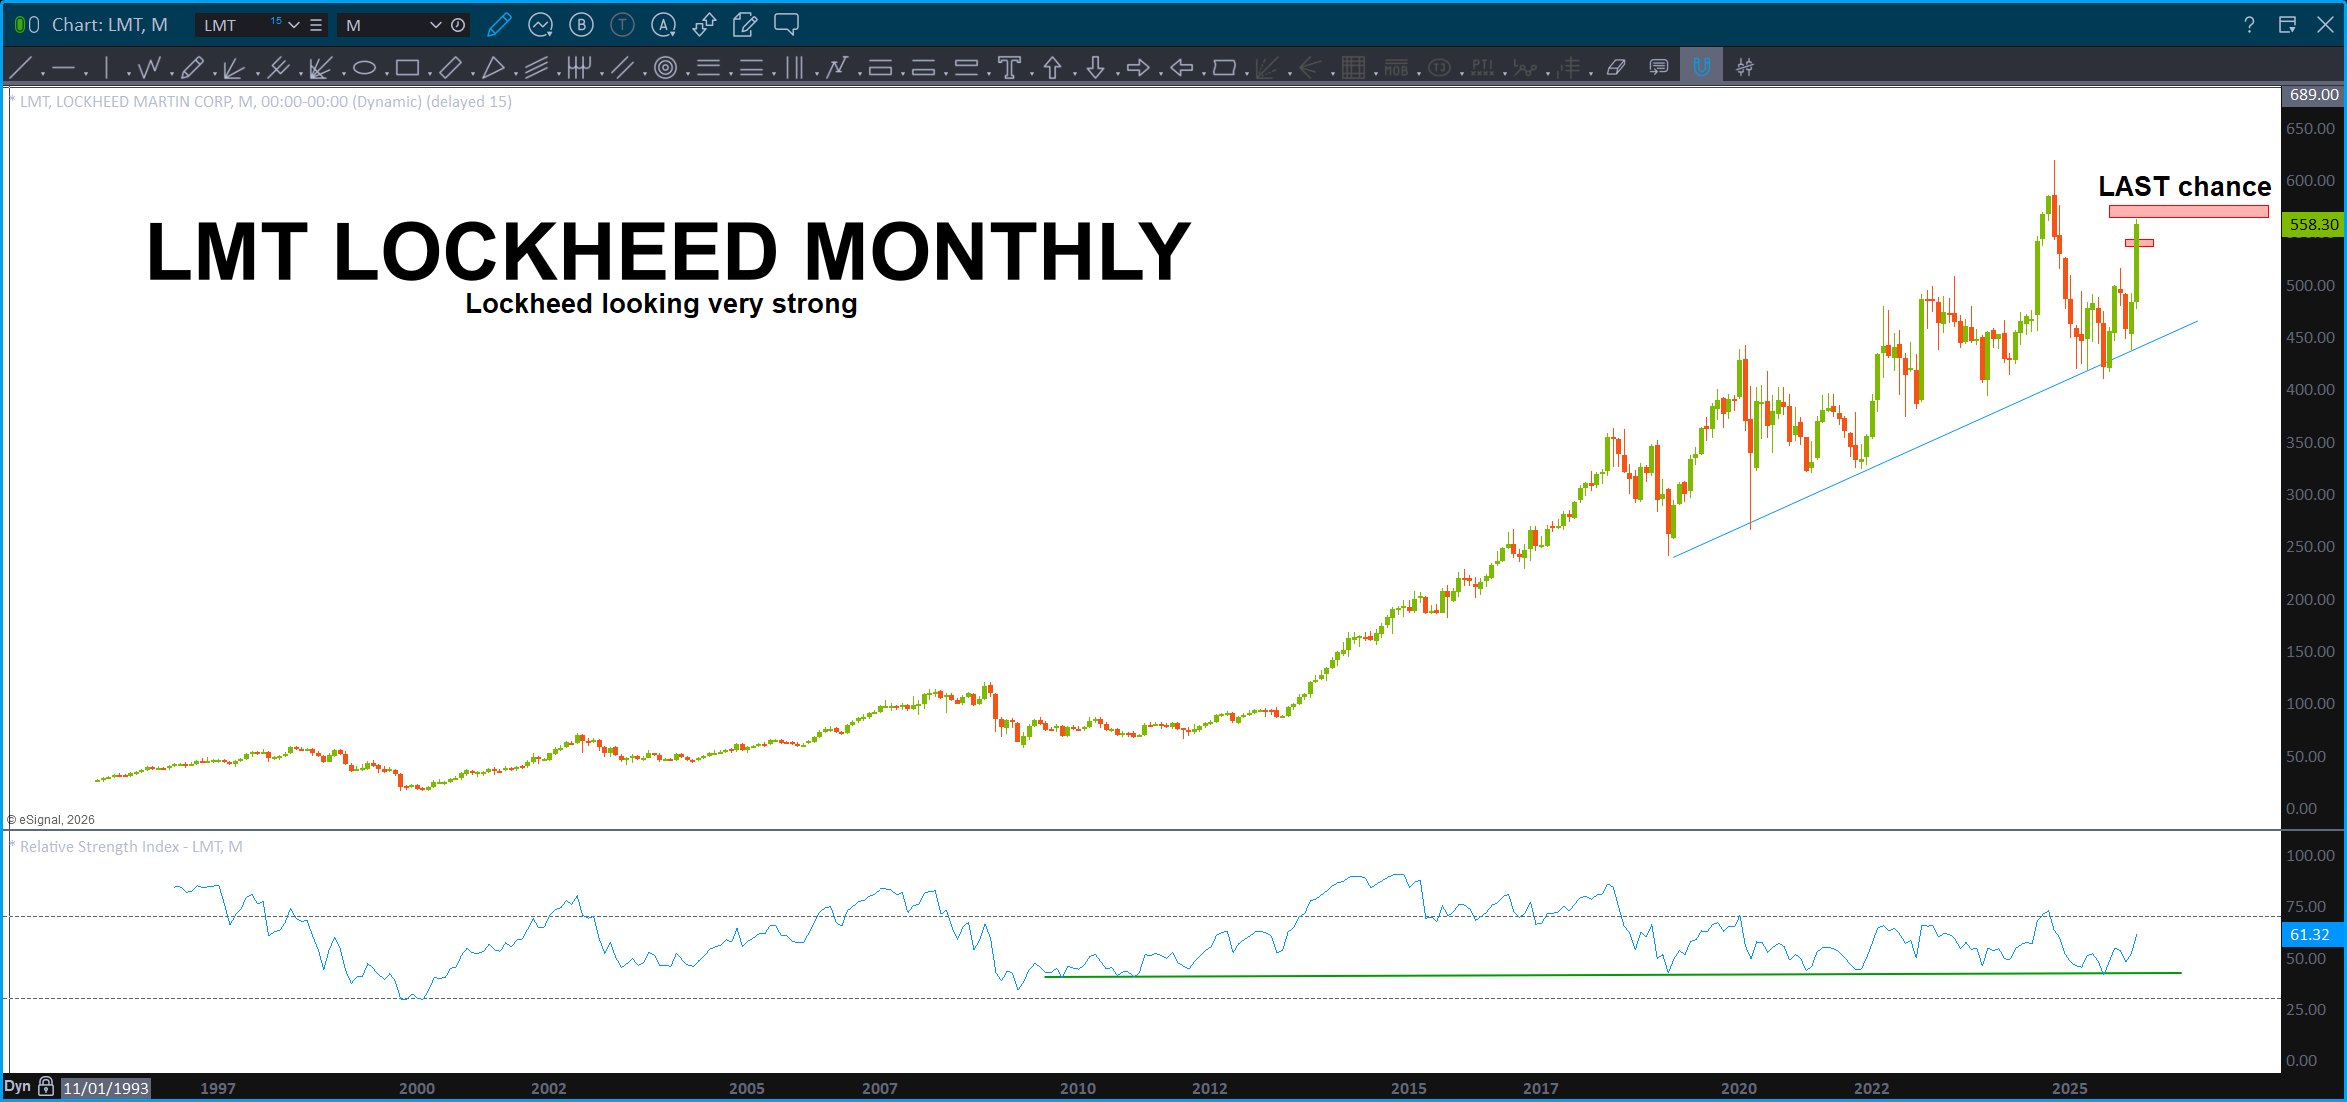
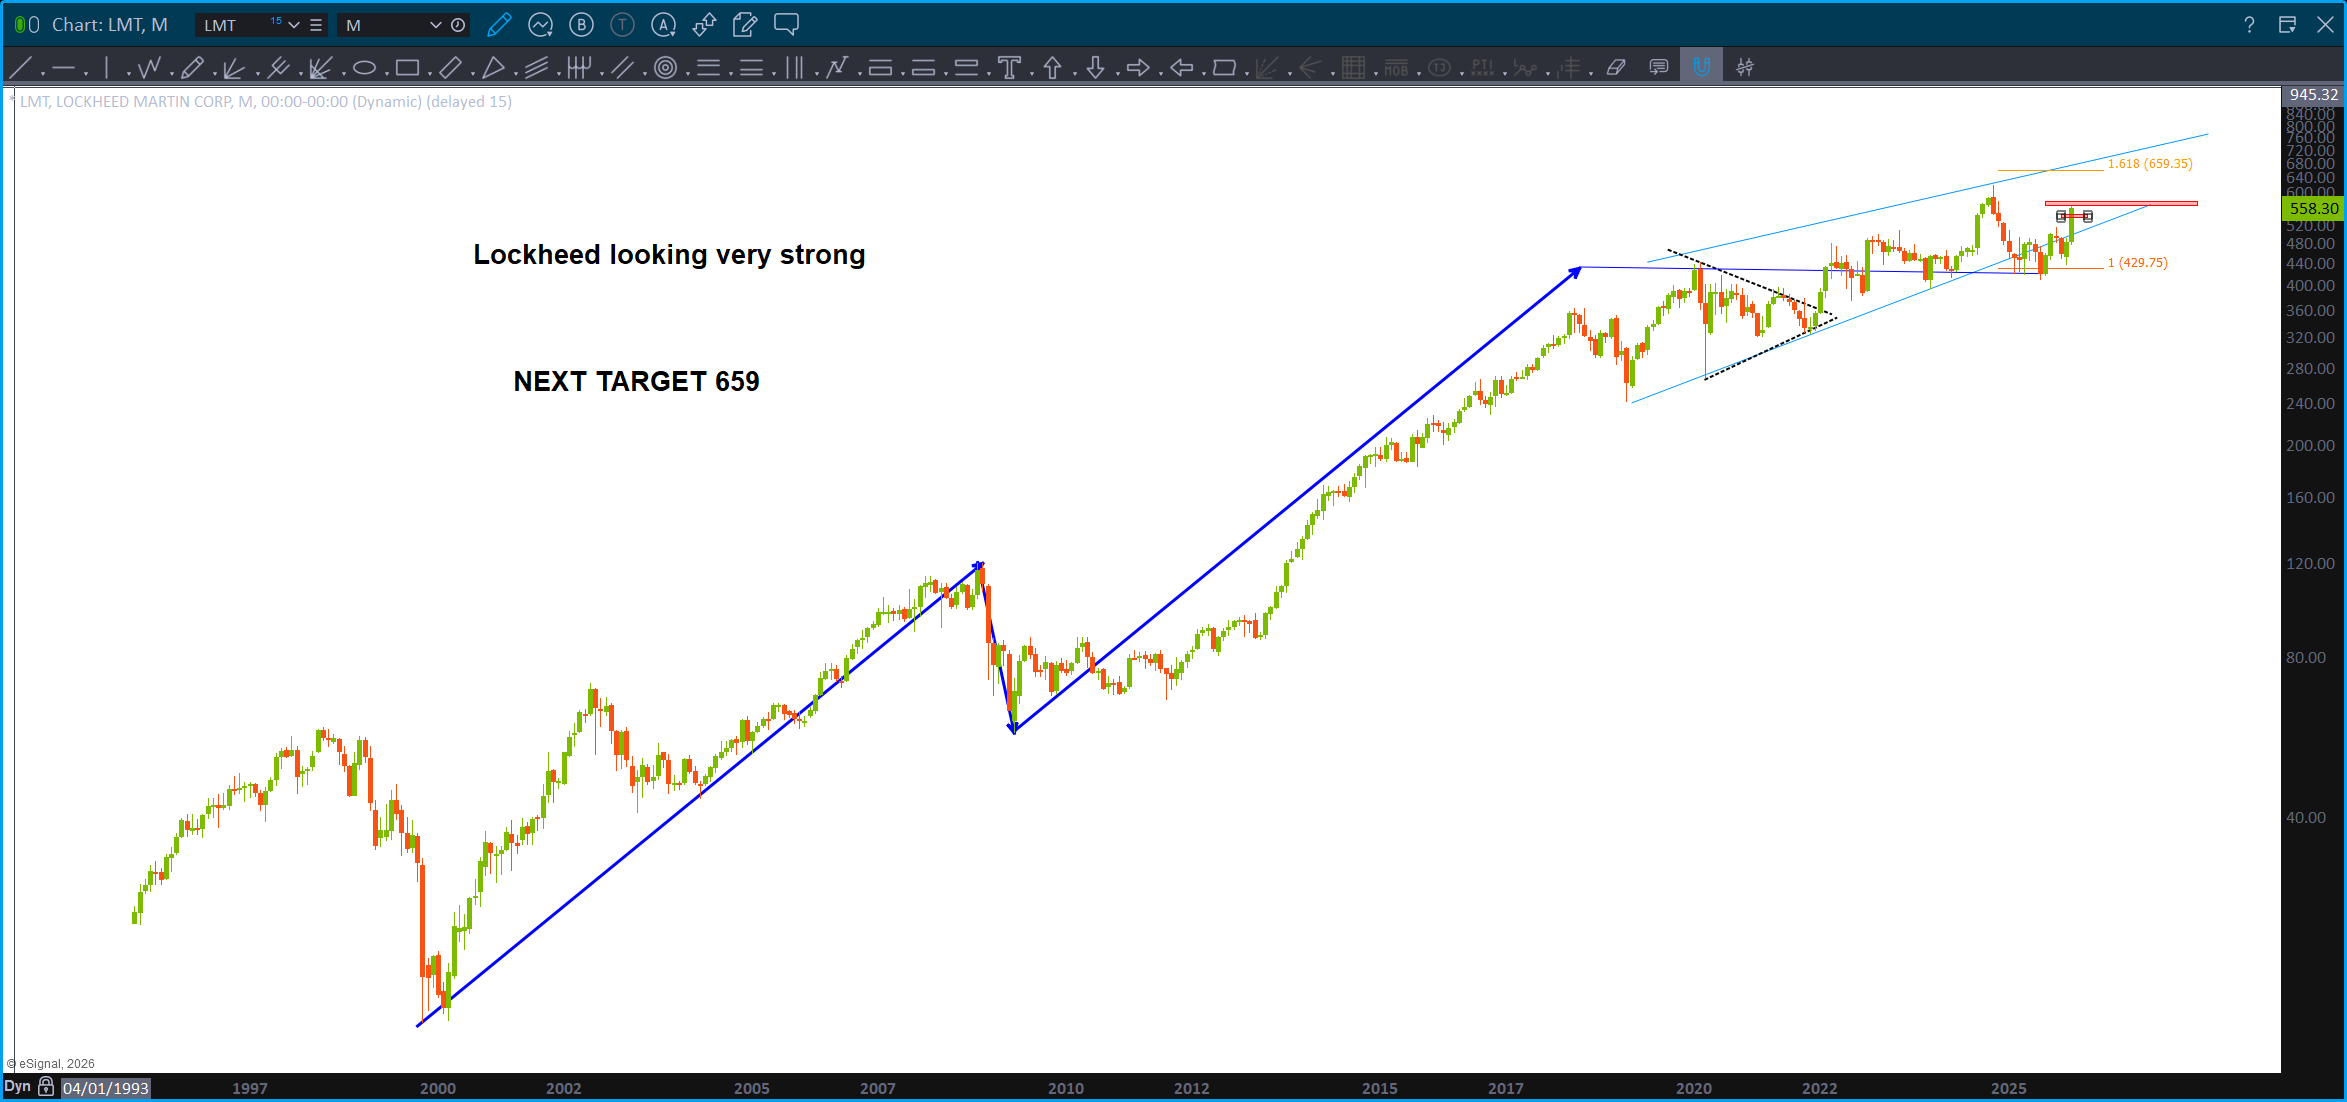
Here’s what the pattern failure looks like on a Monthly. There is some resistance approaching but, w/ the big Department of War (why Department of Peace?) asking for a HUGE increase in Defense Spending … yeah, I’m thinking we might pause here or something but this puppy looks STRONG.
BOOM, there’s a PATTERN FAILURE for ya, near real time….
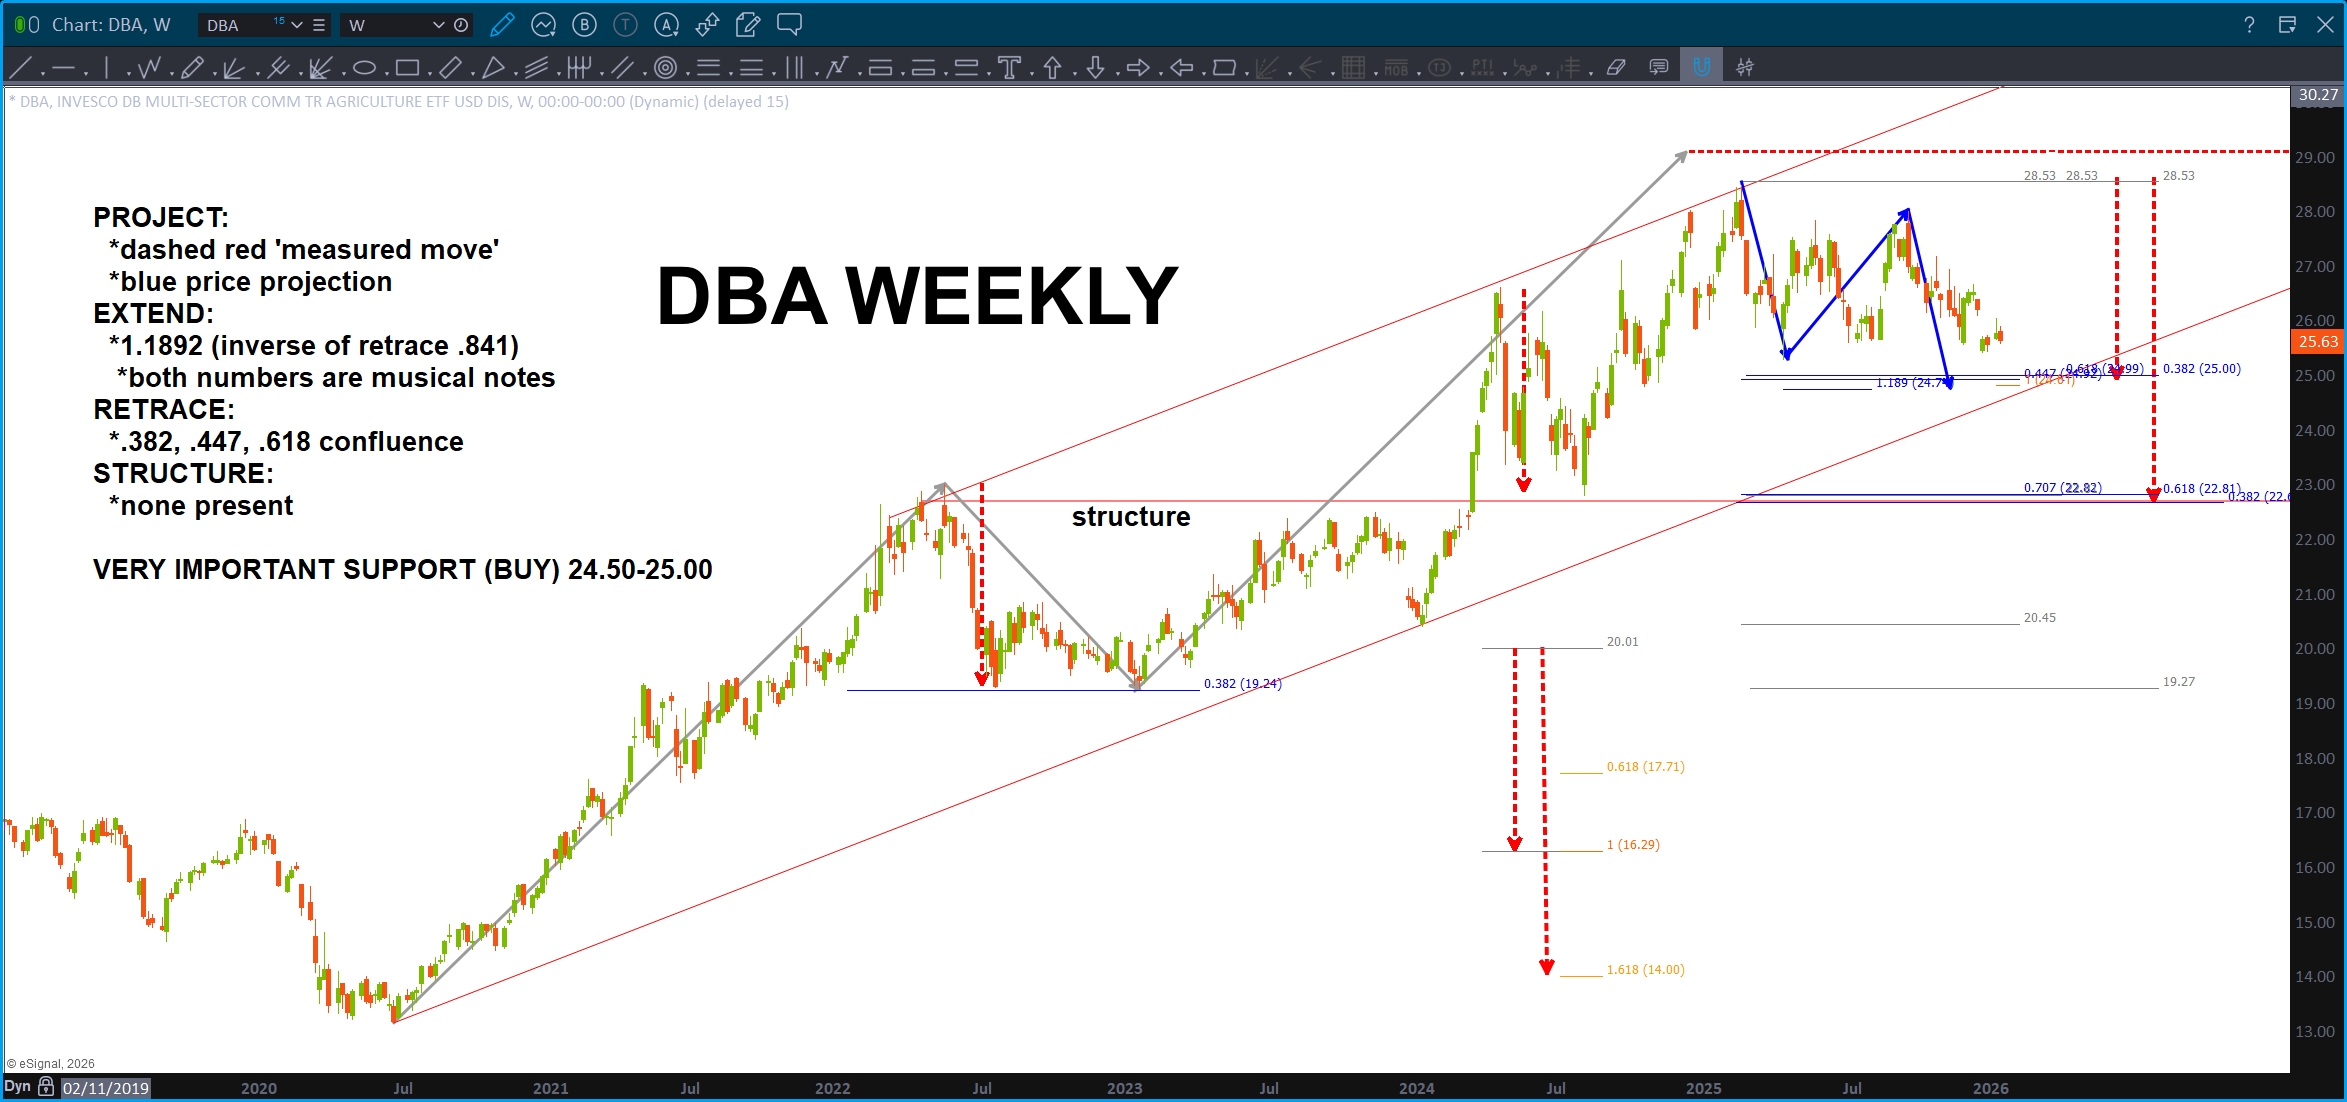
Here’s a fun one – DBA. I’m still long from the low and am thinking higher but we did just finish and ABCD (or close) … two key levels.
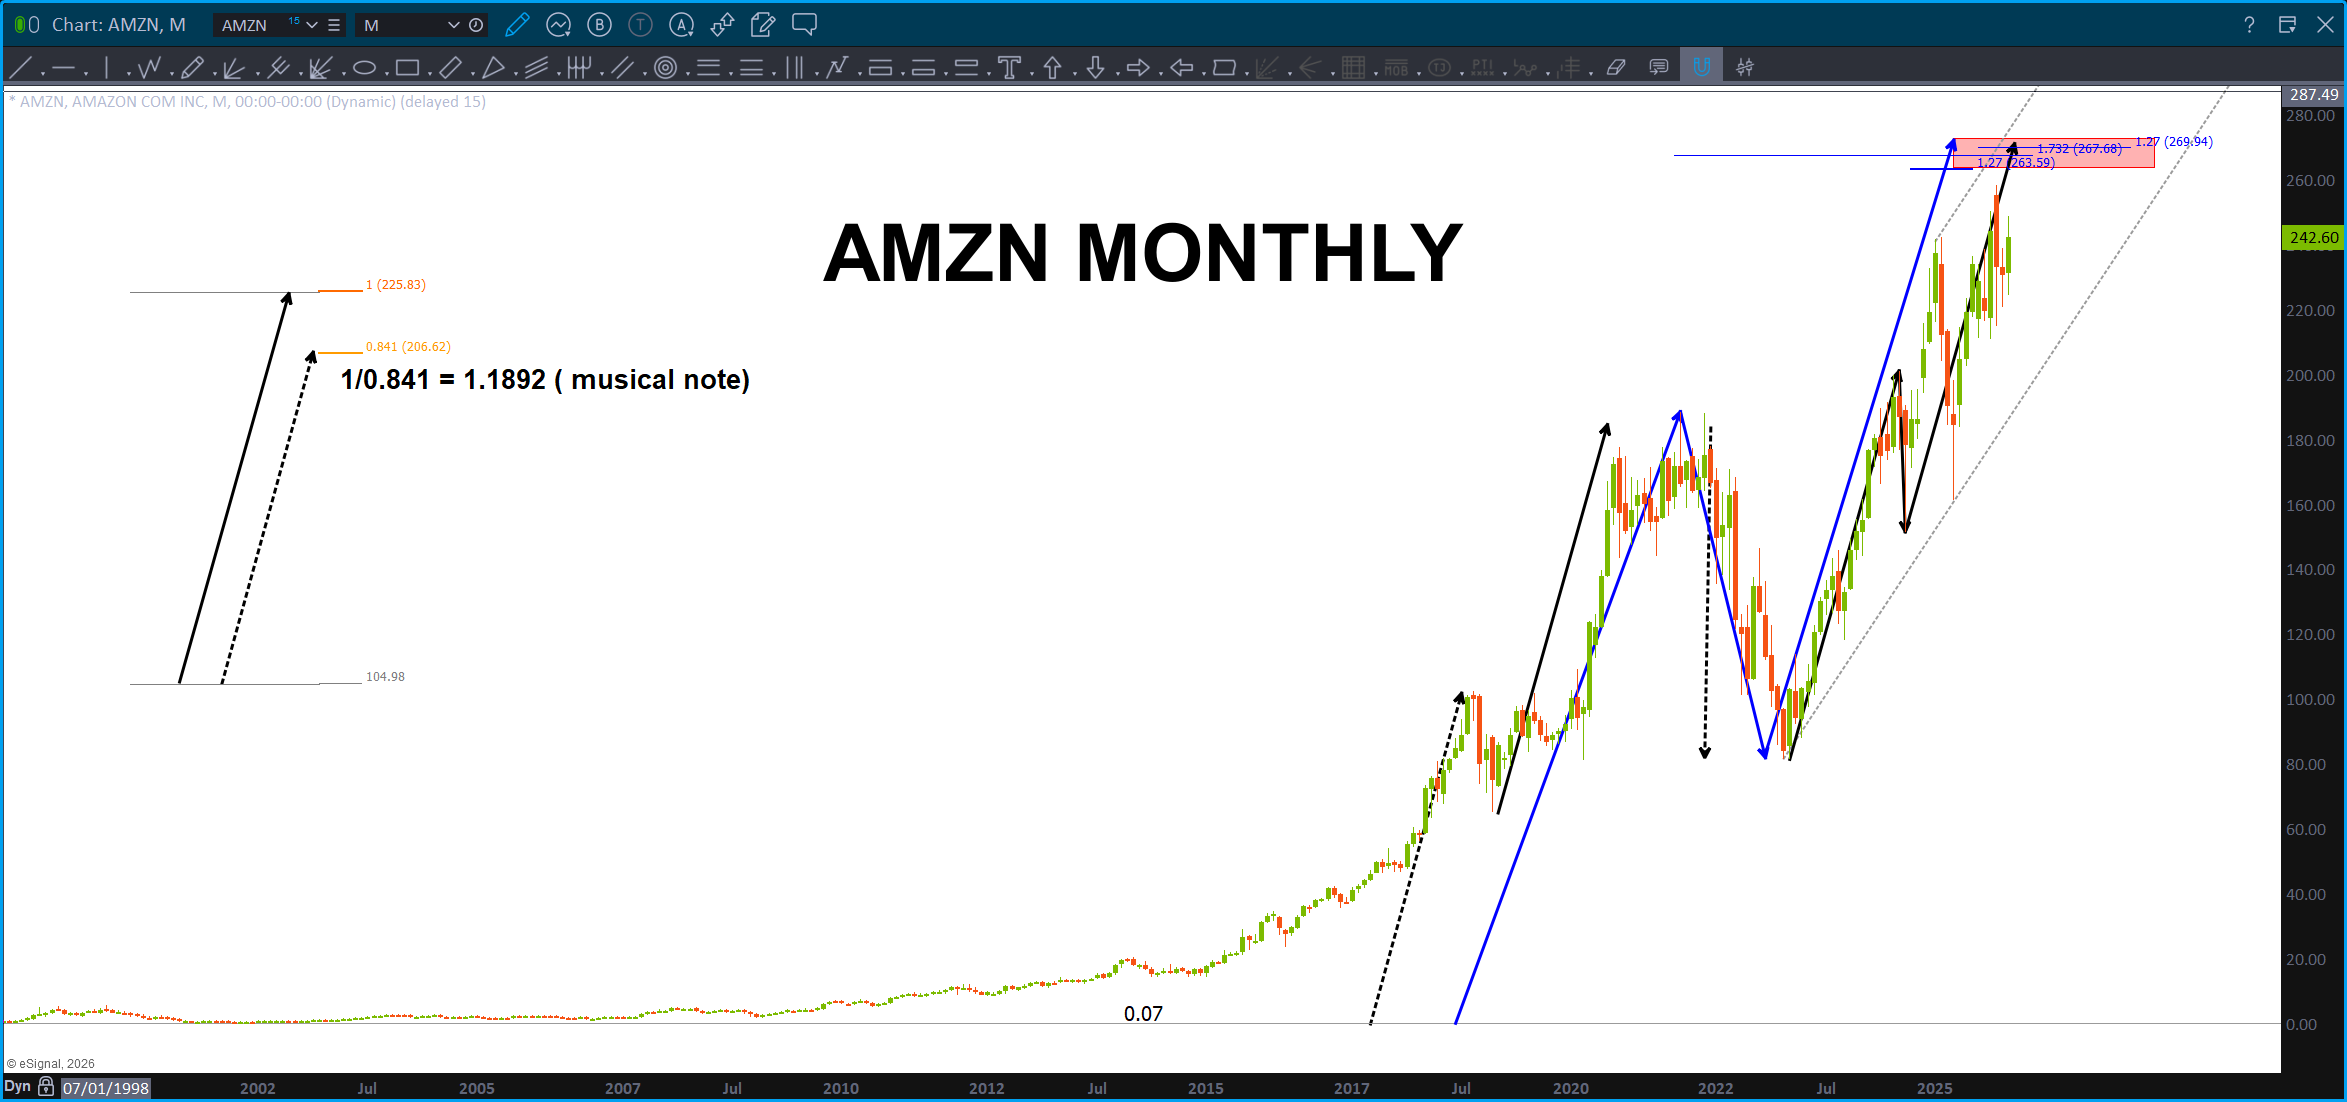
Check THIS one out on AMZN. Woah boy …
Folks, check out the measured moves and the harmonics of those measured moves … ZERO technical indicators, zero fundamentals just ‘measured moves.’ Could these be attractor states? Hmmm … if the SAME price movement occurs over and over and over again then … just like the flock of pelicans that came zooming very close by me as I was surfing this AM at Del Mar. (note – it was GLORIOUS) but think about it, just for a second. The pelicans were cruising the waves, or more likely, the air flow that moved due to the energy which is causing the wave to crest and crash producing a ‘force’ that energy can tap into. Wow … or the pod of dolphins which also came thru and I made eye contact w/ one and it was … let me just say, very cool. Even this Sunday, I had 3 dolphins surfing w/ me. Yes, actually surfing the waves and one of them flipped out of the wave as to say “cya dude.” I said to myself “cya dolphin dude.” It was cool … Anyway, these measured moves repeat. If we can find the MONTHLY long term measured moves then we can calculate those moves and there harmonics which is simply noting more than – the ratio’s created from the Vesica Piscis. Wow, pretty cool. I’ll stop for now.
Take all that and here wave have AMZN. Hmmmmm … two projections with extensions make this THE key level for AMZN going any higher in the near term. Would really like to see it go up there and tag that level.
Finally, the ratio appears to be putting in a pretty strong “hammer” candle and, technically, it was in our ‘target zone’ but I do wish it will go down and tag the projected area that we have been watching for months. That being said, looking at the charts above and some others one has to consider, the pattern complete. So, IF the XLP/NYA ratio has bottomed on a MAJOR MONTHLY pattern that has, in the past, been reason to ‘baton down the hatches’ as a correction is coming.
Here’s the link discussing the ratio from a few days ago: https://atomic-temporary-44460632.wpcomstaging.com/2026/01/05/orientation-update-the-ratio-january-5-2026/
And would you look at that … Mr. Measured Move in percentage terms:
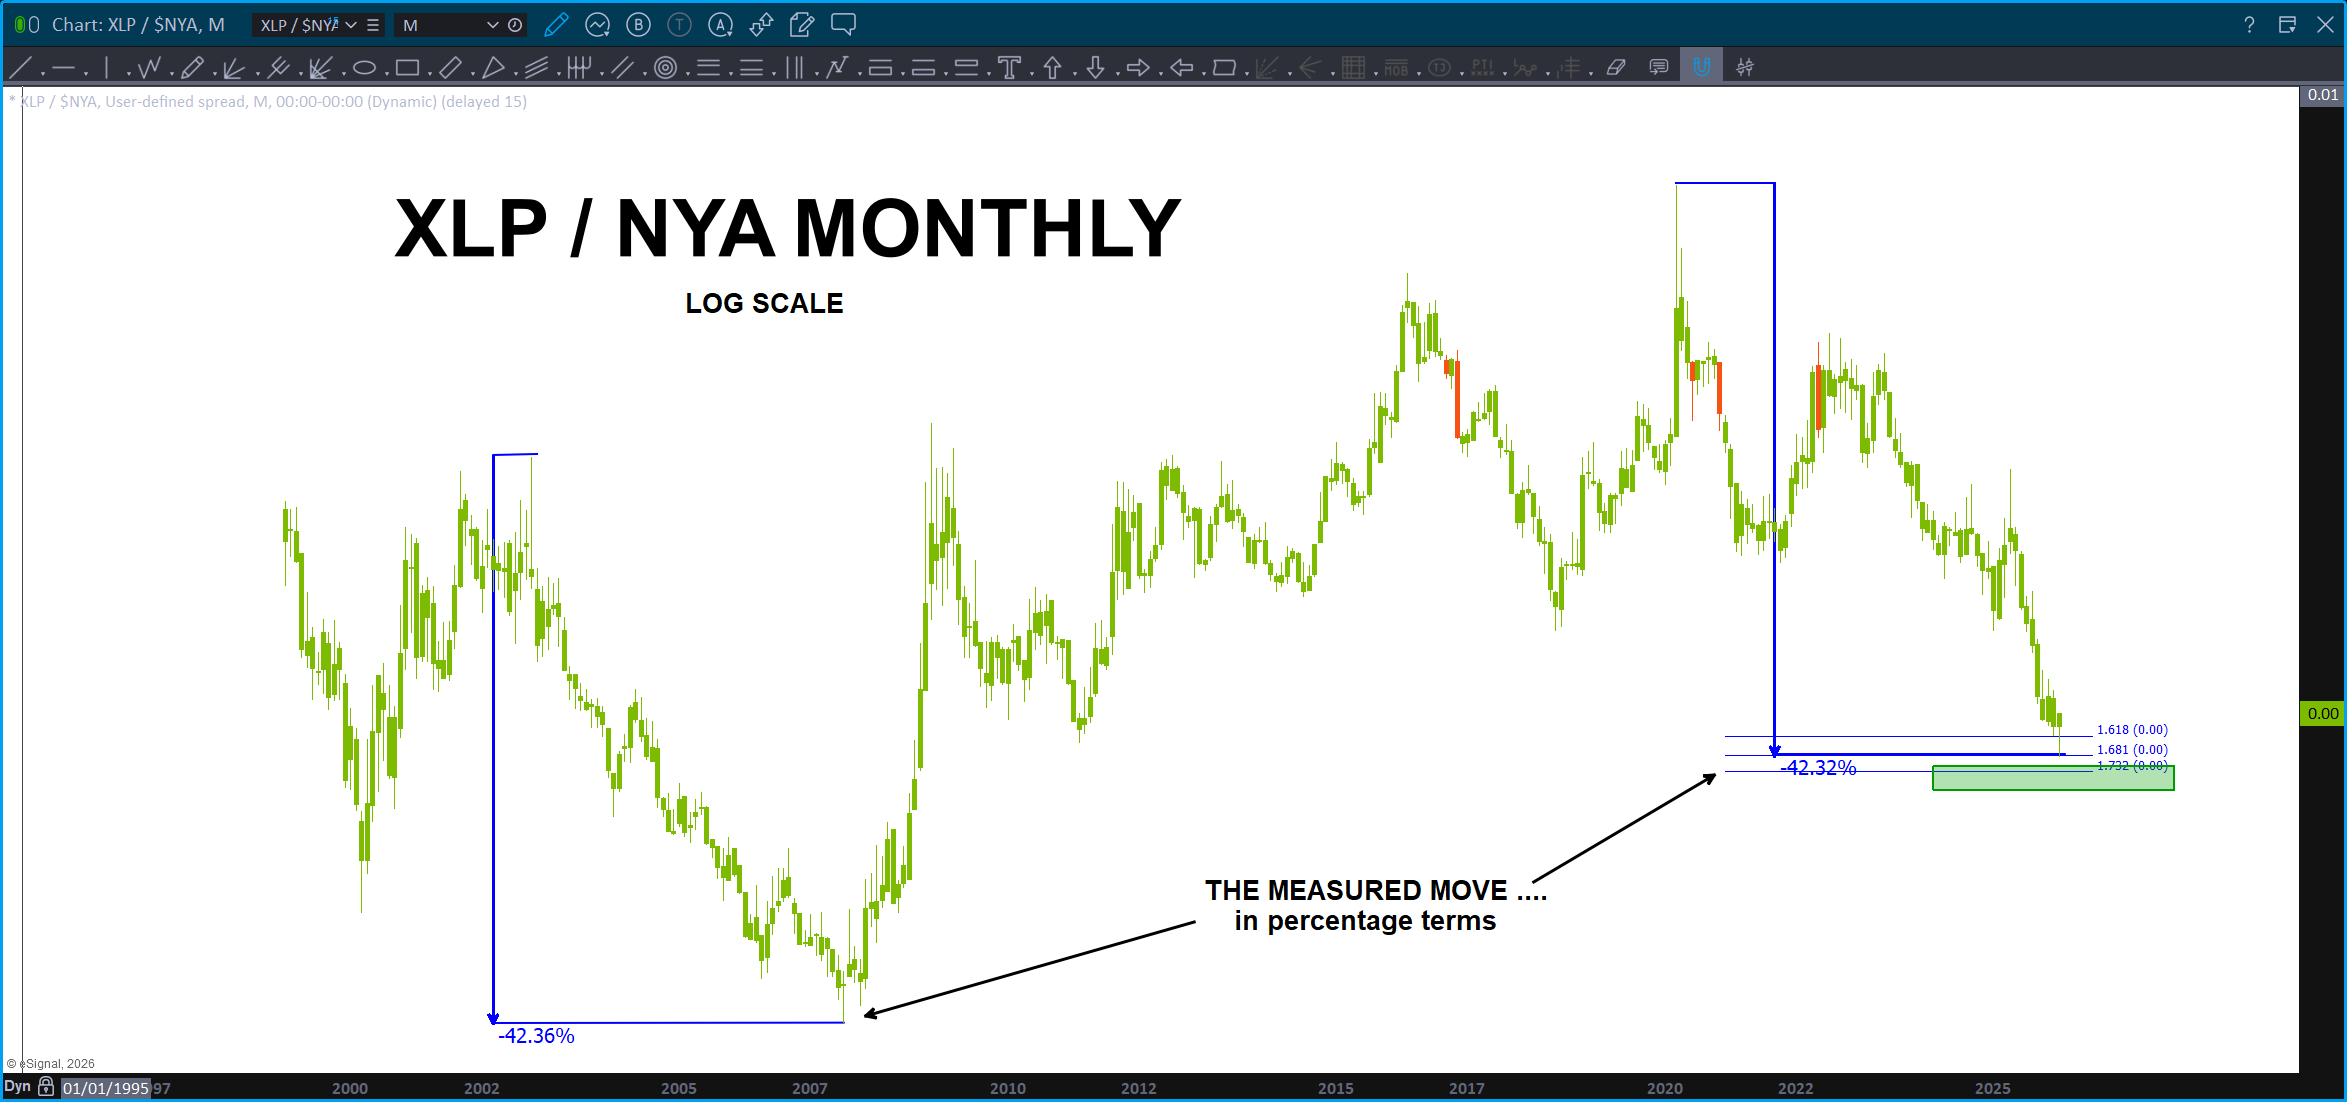
Woah … yup.
What about the USDJPY? Exactly … here ya, go real time:
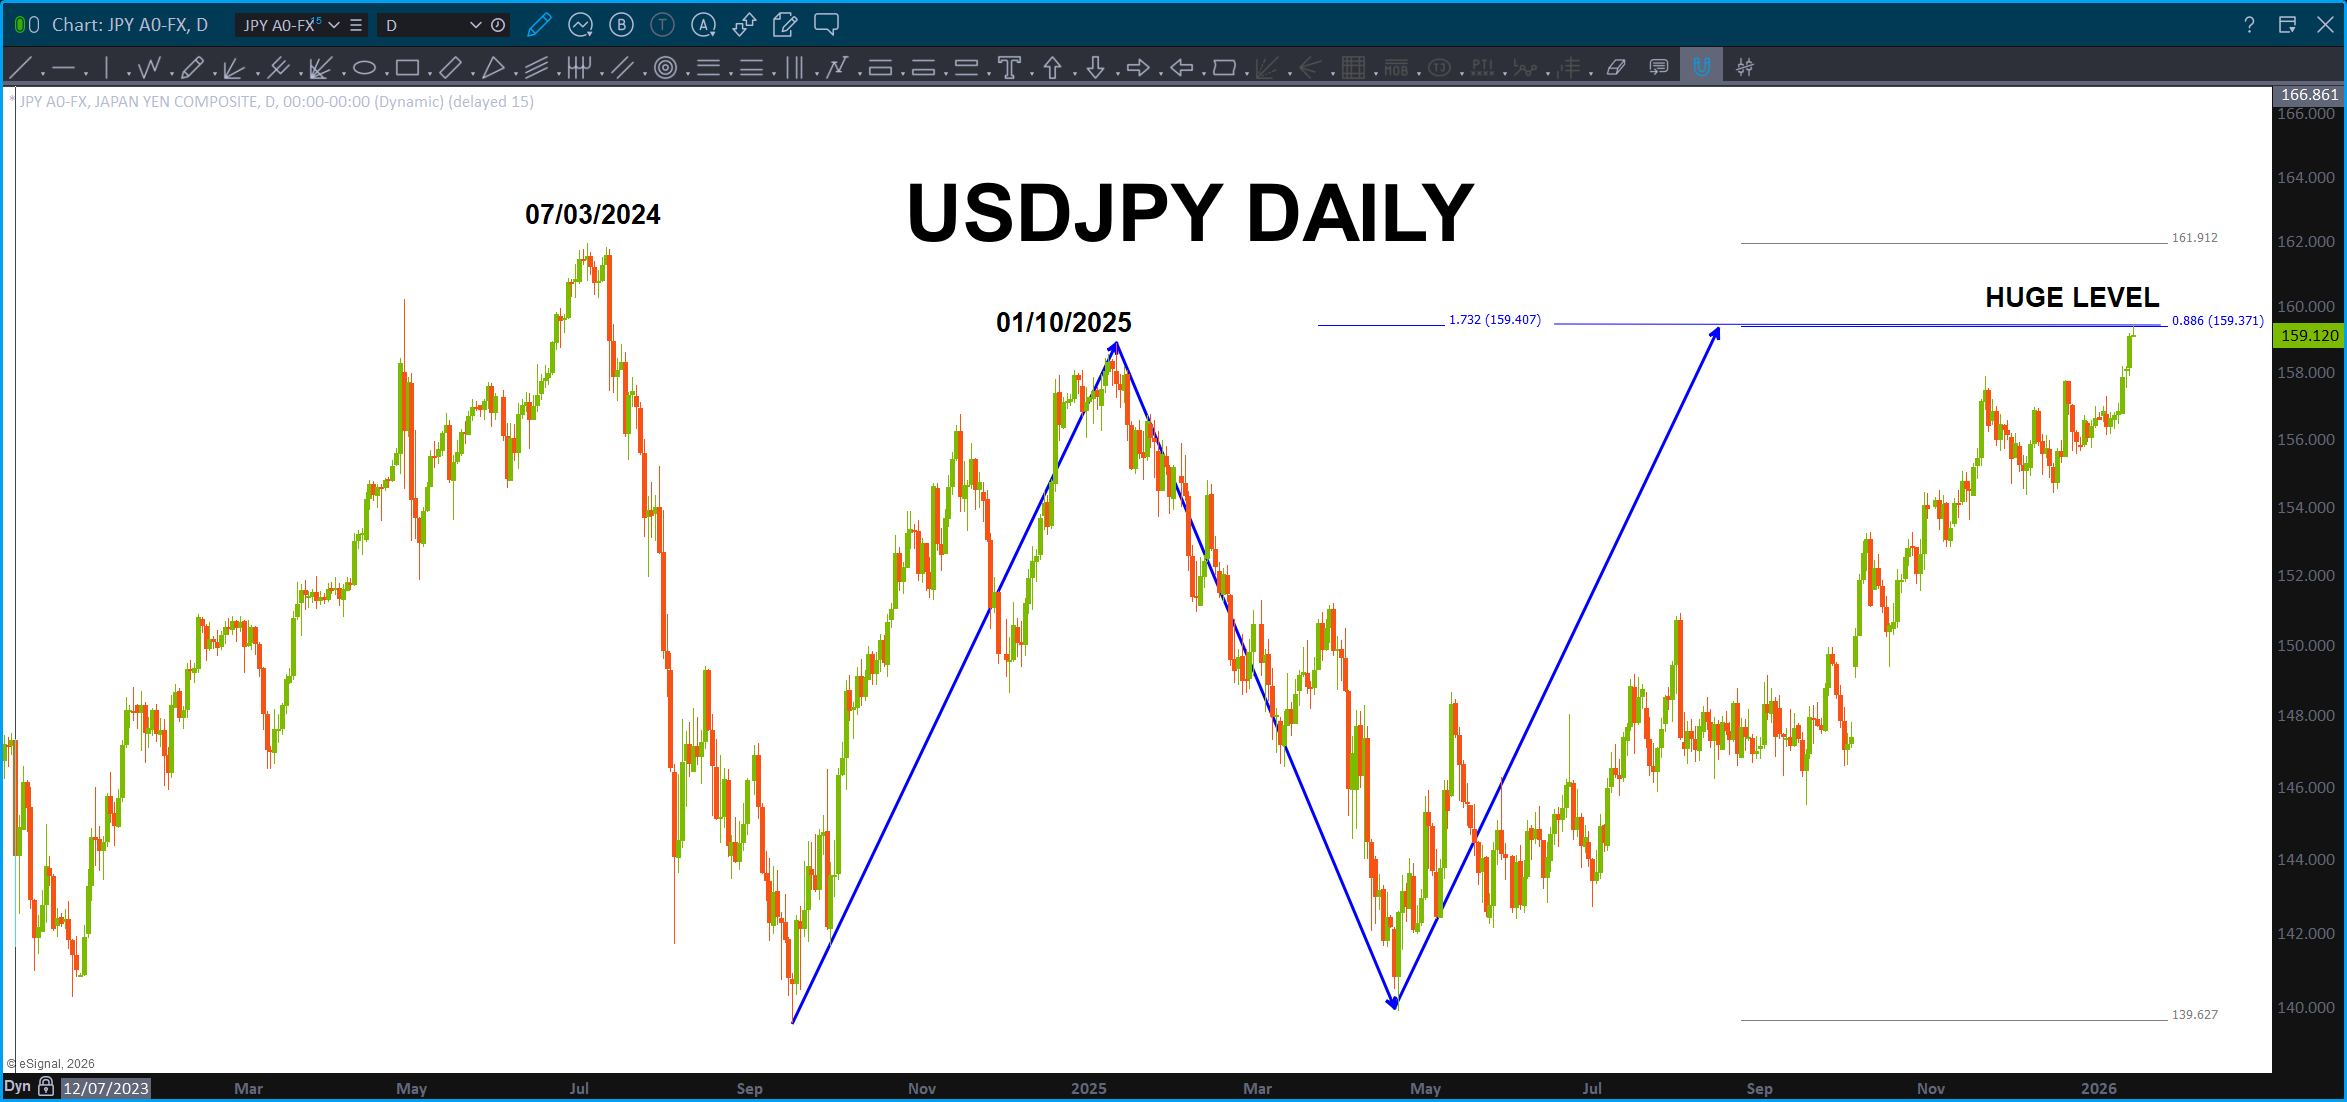
This is actually a PATTERN called the “crab” where the projection hits the .886.
IF the USD blows thru this level THEN that will give some relief for the global macro picture. It’s just hit the level folks …watch this level closely, because, remember, it came after this:
Remember … ? Man, that was a year and half ago! The YEN complex just blew up w/ strength – it was all the patterns. But, some of them have failed so … maybe this does also and off we go? It does work the dollar strength thesis. Again, keep an eye on this for the sole purpose of the carry trade.
KEY: The FX market is the LARGEST market in the world. When I first started trading the FX market it was something like ‘every stock, bond, commodity, futures market would have to trade continuously 90 days to equal one day of liquidity on the FX market.
Here’s what GROK says: Based on the most recent data from the Bank for International Settlements (BIS) Triennial Survey, the average daily turnover in the global FX market reached $9.6 trillion in April 2025.
So, the pattern at play, right now, is going to be KEY. Watch the USDJPY and the entire YEN complex, closely.
Let’s just consider the pattern on the XLP/NYA complete. Which means, support has been found on the XLP/NYA ratio:
We should all know what that means … it’s time to get defensive. Now.
Cut all your positions and run for the hills? I’m not saying that, I’m saying, you might want to take some profit or you might be living thru another round of dollar cost averaging but what if … just if …this was/is a BIG TOP. Hmmmm … guess we’ll just have to wait and see.
Watch for a weekly or monthly signal reversal candle before doing anything too crazy but if we do get them … I would take it seriously.
Orientation Update – the ratio – January 5, 2026

We’ve been watching this ratio for over a year and never thought the BUY pattern would get tested. Certainly looks like that will happen.
This is THE level to watch for the market to continue its climb or correct … it’s that simple.

Orientation Update – BITCOIN January 4, 2025

Sure appears that Bitcoin is going to propel higher and, perhaps, make a new high.
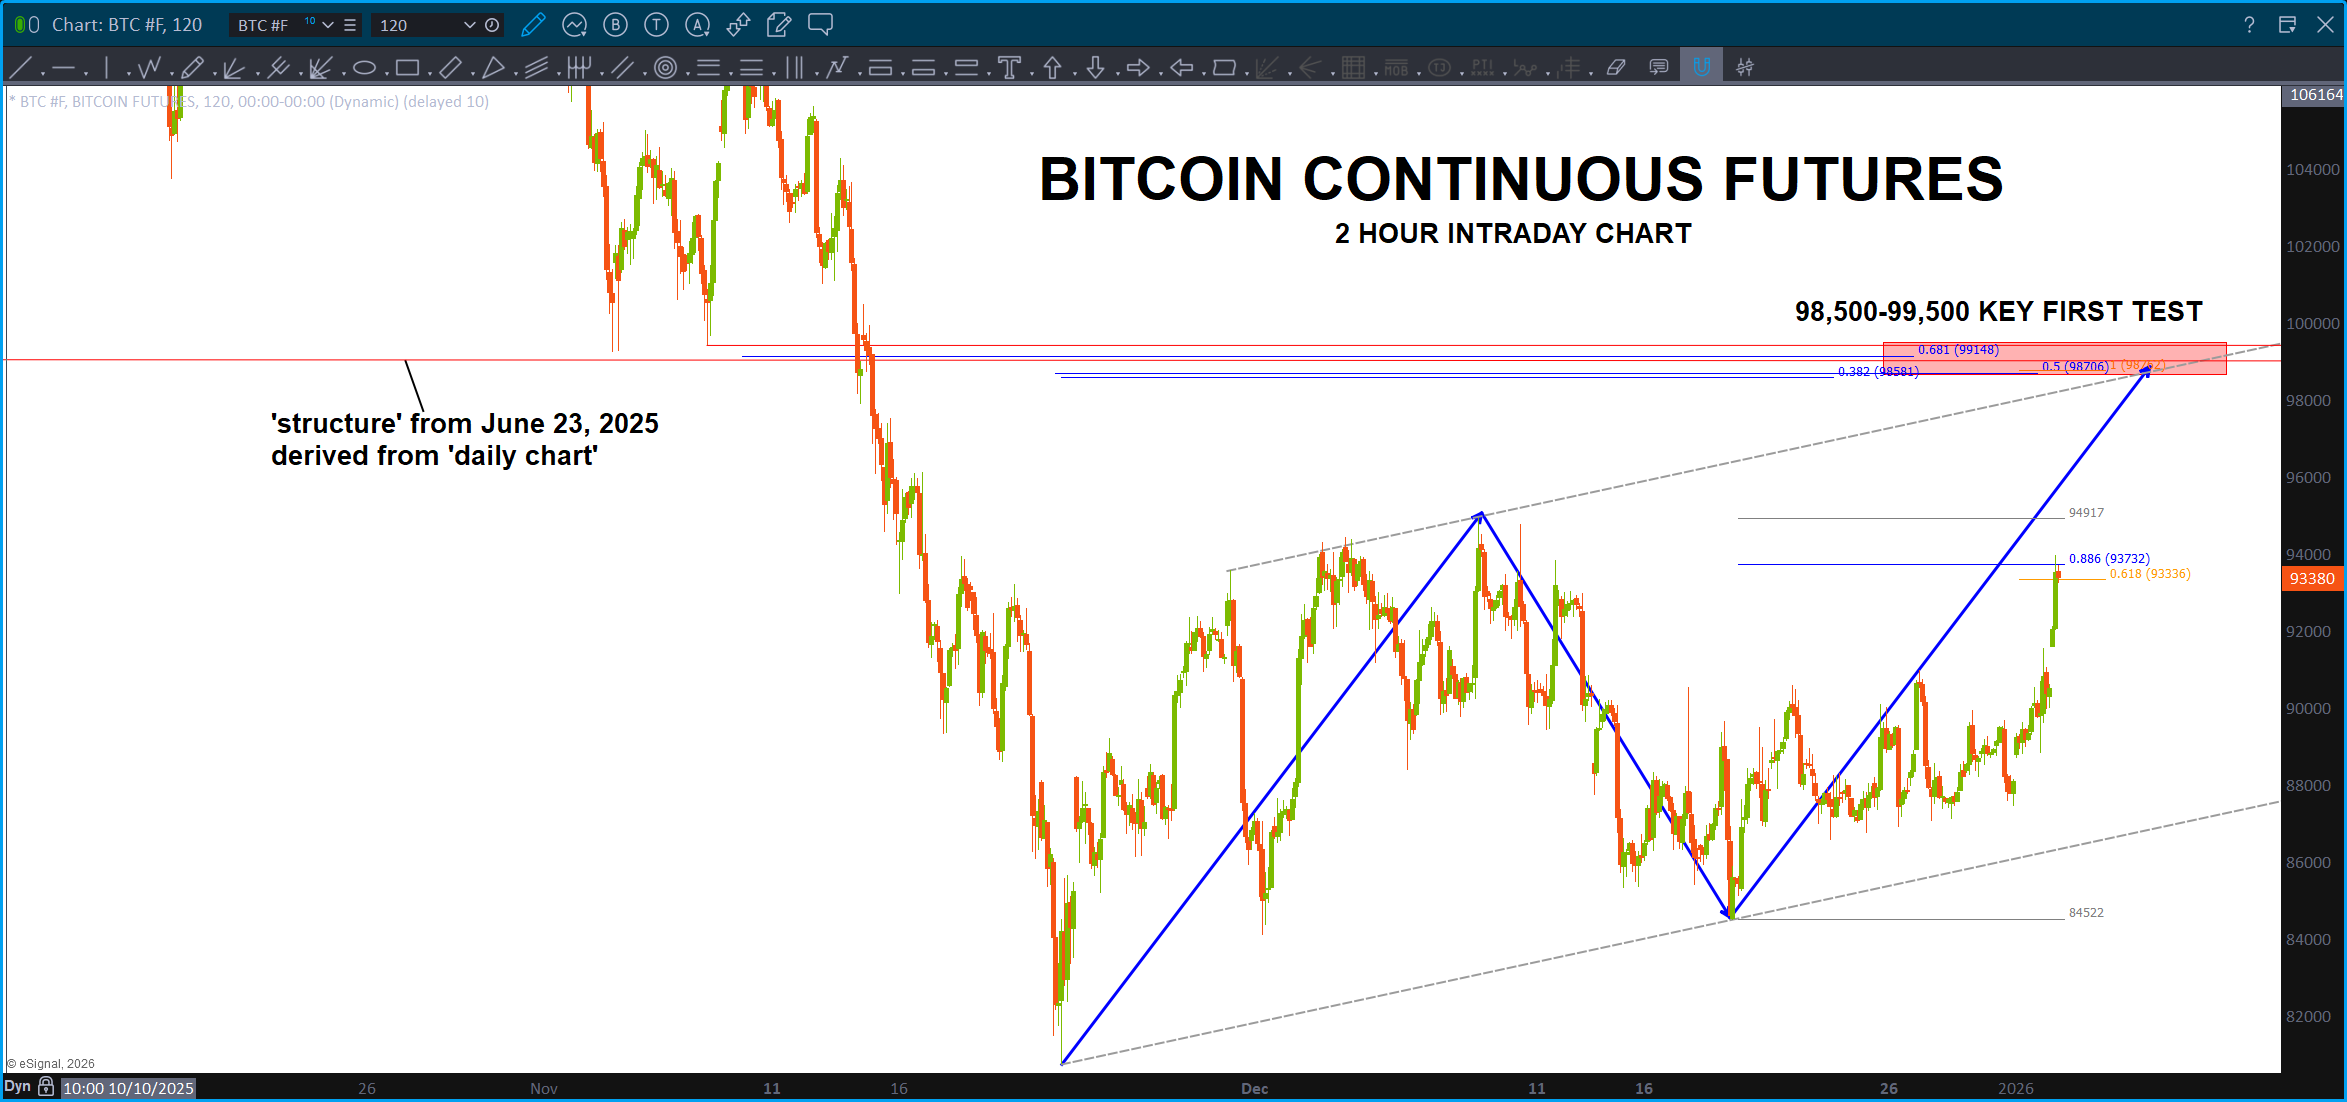
First test and, if bearish, should offer significant resistance is below. If we gap and go above that or just smoke thru it w/ ease then our map is orienting us to new highs in Bitcoin. Yes, I was looking lower for a VERY, near perfect, BUY zone in the 70K’s but w/ everything going on, it might not just get there. We’ll see … don’t forget that MSTR chart either. They kinda move together …
Hmmmm … we are dodging the gorillas w/ the dynamite and the short fuse right now. Isn’t this fun?
Orientation Update – TSLA – January 4, 2026

Thus far this count has worked … since we made a new high and smacked into the 1.27 extension and a clean 5 wave count can be seen, perhaps it’s time to take some profit on TSLA?

Orientation Update

Folks, not even going to pretend I know what direction Silver is going to go or IF my thesis about the first wave (of a lot more) in Bitcoin being complete and if MSTR is going to hold this major pattern. I don’t. They are just patterns and I’m trying to connect the dots the best I can. My frustration is “time” in that I know I could figure out the synthesis of time but, honestly, I’m waiting for a technology to appear and then I’m going to DUMP all of what I’ve studied the past 24 years into it and, I honestly think, it will be unlike anything ‘out there.’
The big key is thinking in the terms of OBJECTS (time as an object) and fractals (time as a fractal) and then the logic (help start a Virtual Reality software company 20 years ago – maybe THIS is why? 😉 of how to fuse the different disciplines of time computations (planetary, calendar/trading day, fundamental frequency, tides (yes, I said it – the tides), planetary returns, etc. etc. … so in this analysis I did a ‘little bit’ of time for MSTR and the ‘fractal’ of the golden mean is present w/ regards to trading day time and with the ‘Gutenberg Press Moment’ occurring in the Silver market globally, along w/ the FED playing Mr. Repo again, Japan raising their rates, Venzuella, China, Russia, Minnesota … I thought that this ‘time component’ is particularly compelling because, as of THIS day, China (worlds largest exporters of Silver peeps) is no longer allowing Silver to be exported out of China w/out strict controls. Yup, you read that right AND, as a former CFA (yes I played a Commodities Futures Advisor in a past light managing a small Spot FX account in … 2004-2009 (I WAS UP – but everyone had to roll their money out to cover losses!) I can tell you that something is amiss at the circle K when the physical (dare I say ‘real’) price is MUCH higher than the PAPER. (NY and London)
Now, call me a conspiracy theorist BUT are we, dare I type, seeing the first salvo of a global reset and economic warfare? Folks, just think about what’s going on right now …
Venezuela – big buddies? Russia, China … not big buddies? US
Silver – BIGGEST EXPORTER? China … paper players (paper tigers?) US, London
Back when I was being taught by Mr. Joe Dinappoli (www.fibtrader.com) he once said “never forget, YOU as a retail trader are entering into a cage w/ Gorillas that are mean, angry, hungry and are carrying lit dynamite!”
Folks, the dynamite has been burning for a PRETTY LONG TIME and the fuze is getting short.
Happy 2026 …
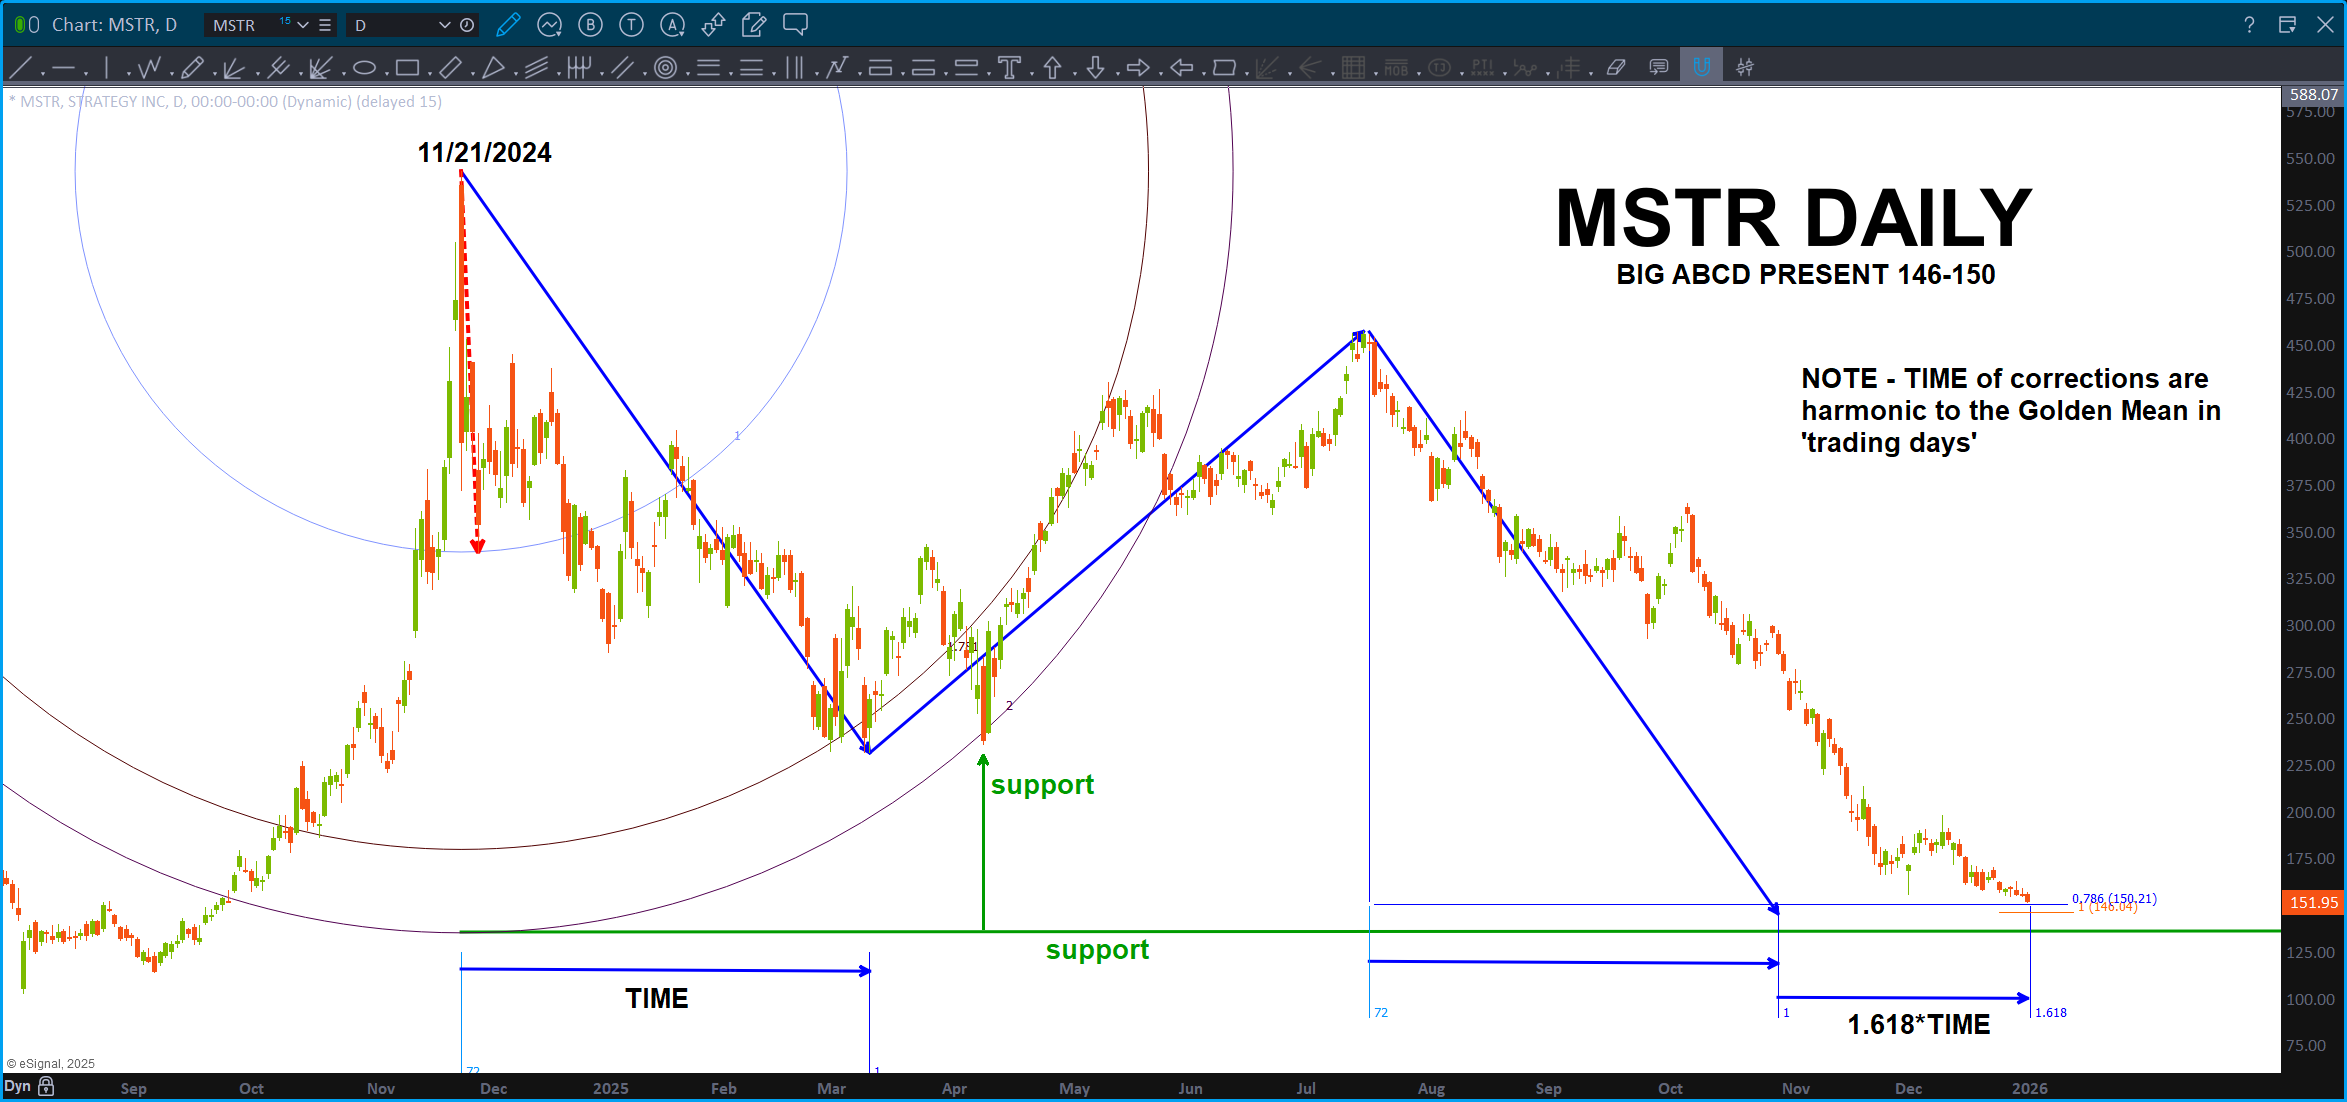
Be sure to have a stop in place for this one … (below the ‘green support’ is advisable) After reading the above … what if Bitcoin becomes a ‘real’ asset as the global gold/silver monetary value, along w/ a continual rise of the BRICS (precisely due to Russia being kicked out of the USD due to the Biden Administration) economic value, not to throw in natural disasters galore (more on that later if you would like ;)) and we have what is called a volatile situation.
This MSTR BUY could explode w/ a BIG RUN in bitcoin higher based on everything going on …

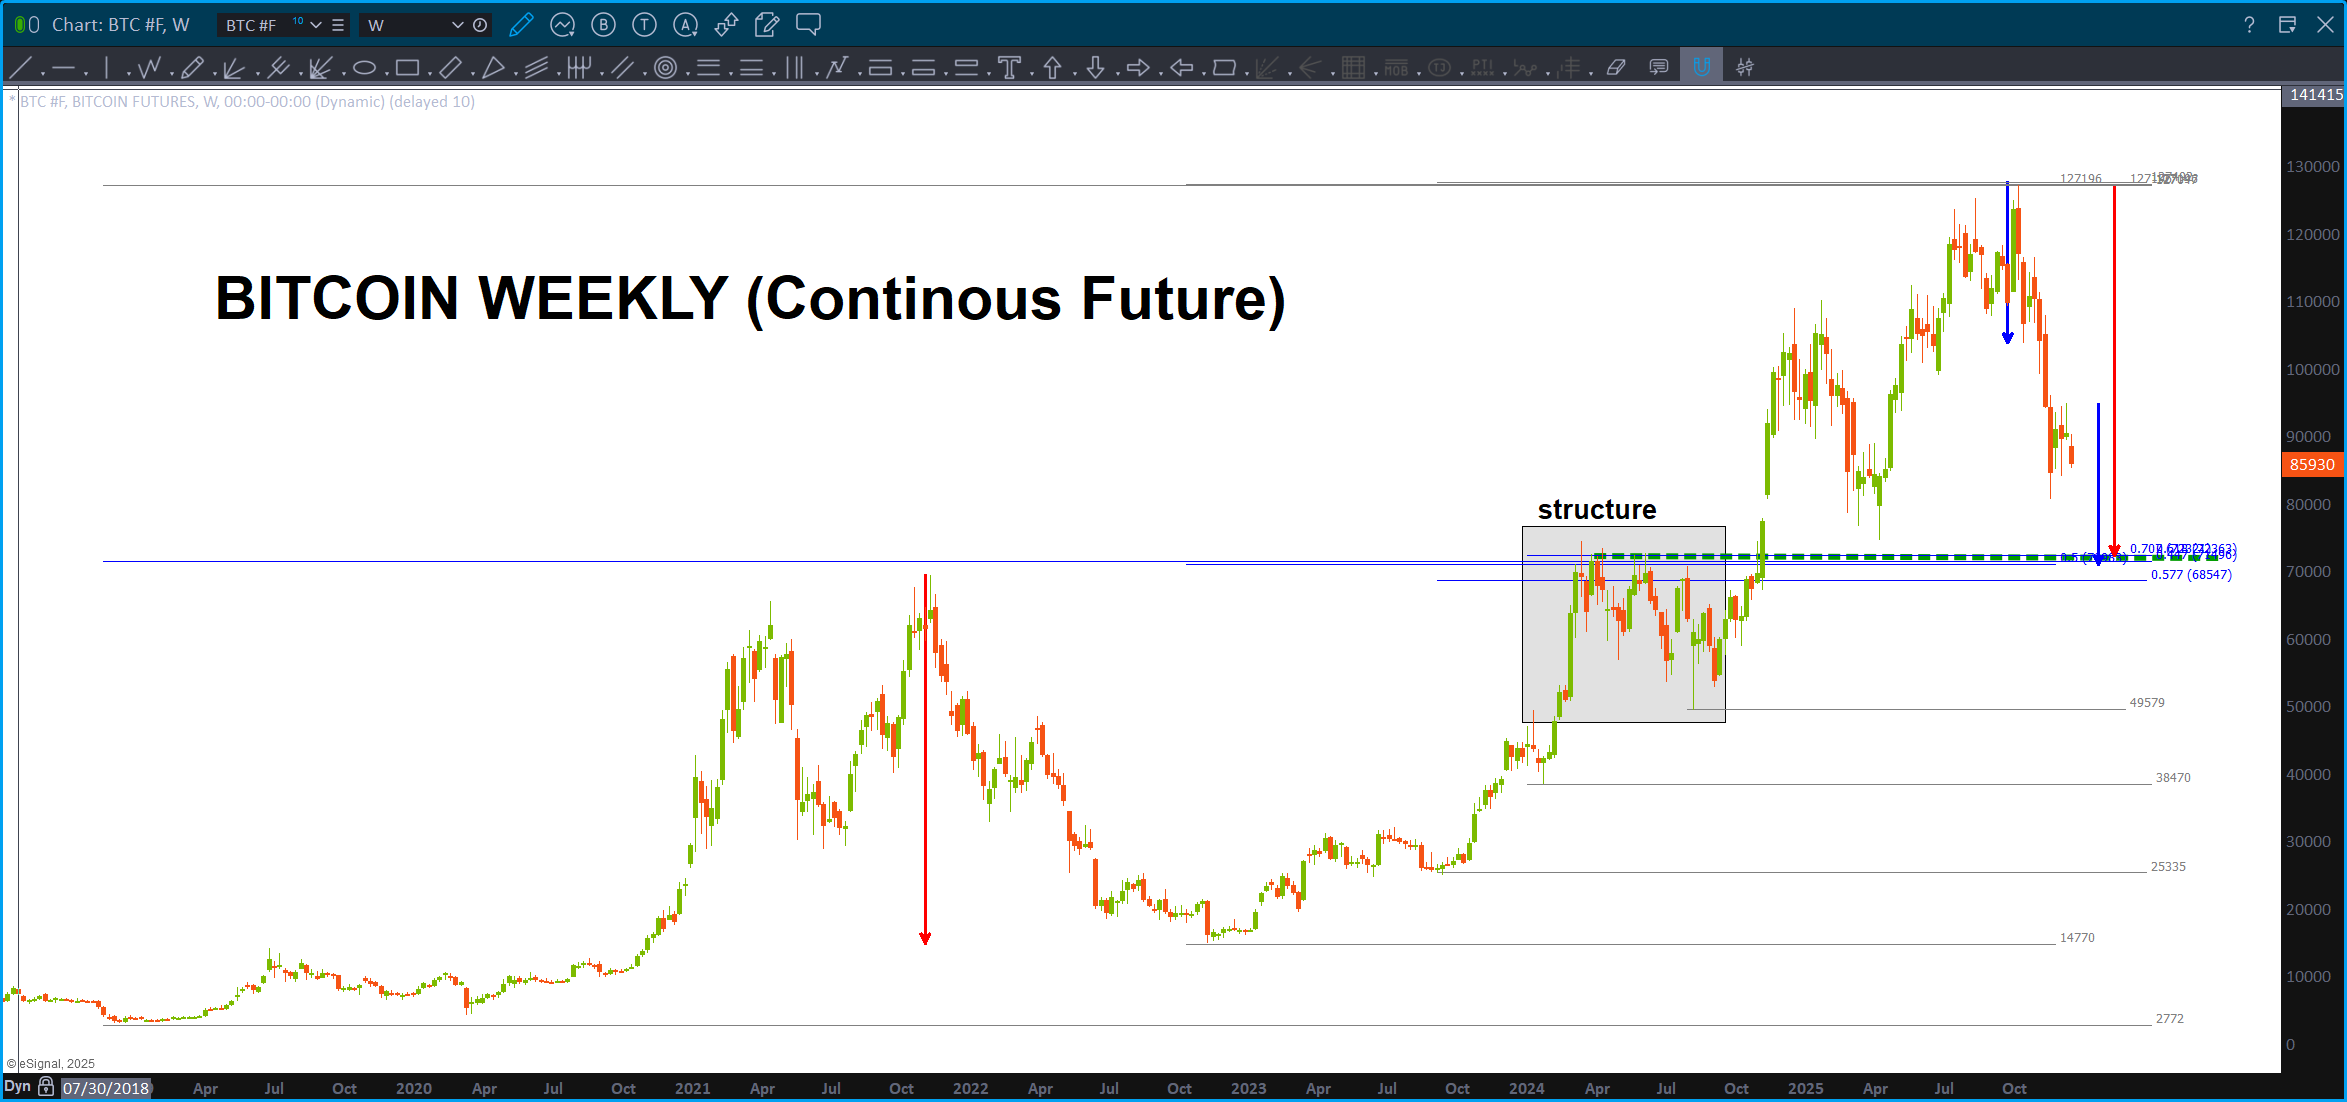
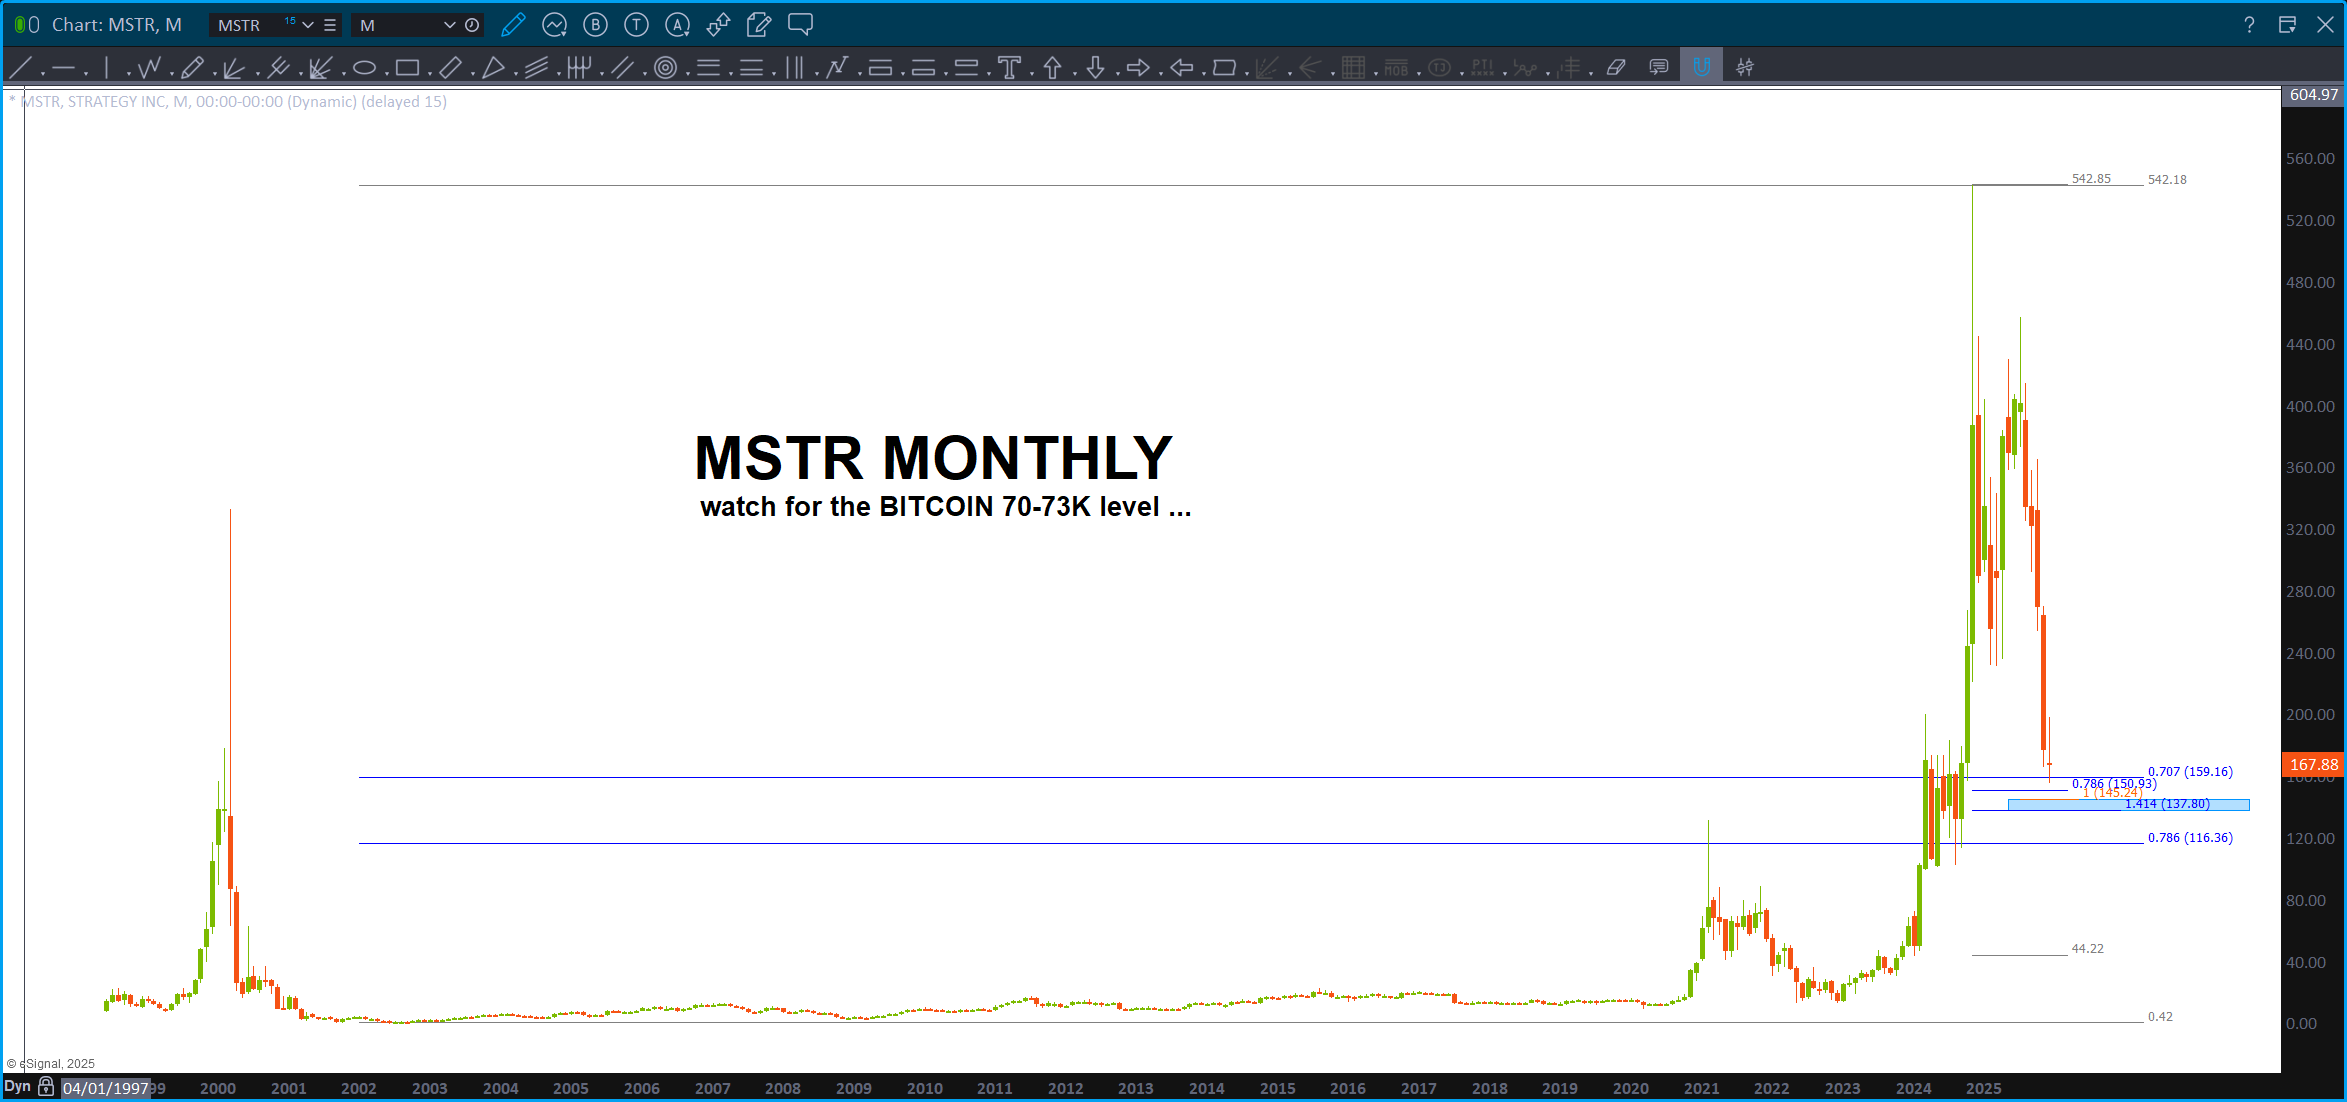
Ratio’s – December 14, 2025

I didn’t know what to call this post, so I just put the date.
Over the weekend, I read everything from “we have another 4-5 years in this bull run” to an Elliott Wave label of a Grand Super Cycle III and my good friend and mentor Larry (trading daily for the past 50+ years) talk about a monster top here or inbound.
I
DO
NOT
KNOW
Just looking for a pattern … the CLEANEST PATTERN I SEE IS MY OLD TRUSTY XLP/NYA.
First, take a peak at this ‘static’ cycle – it was near perfect for about 15 years and then, w/ the recent cycle, it has failed. Hmmmmm ….
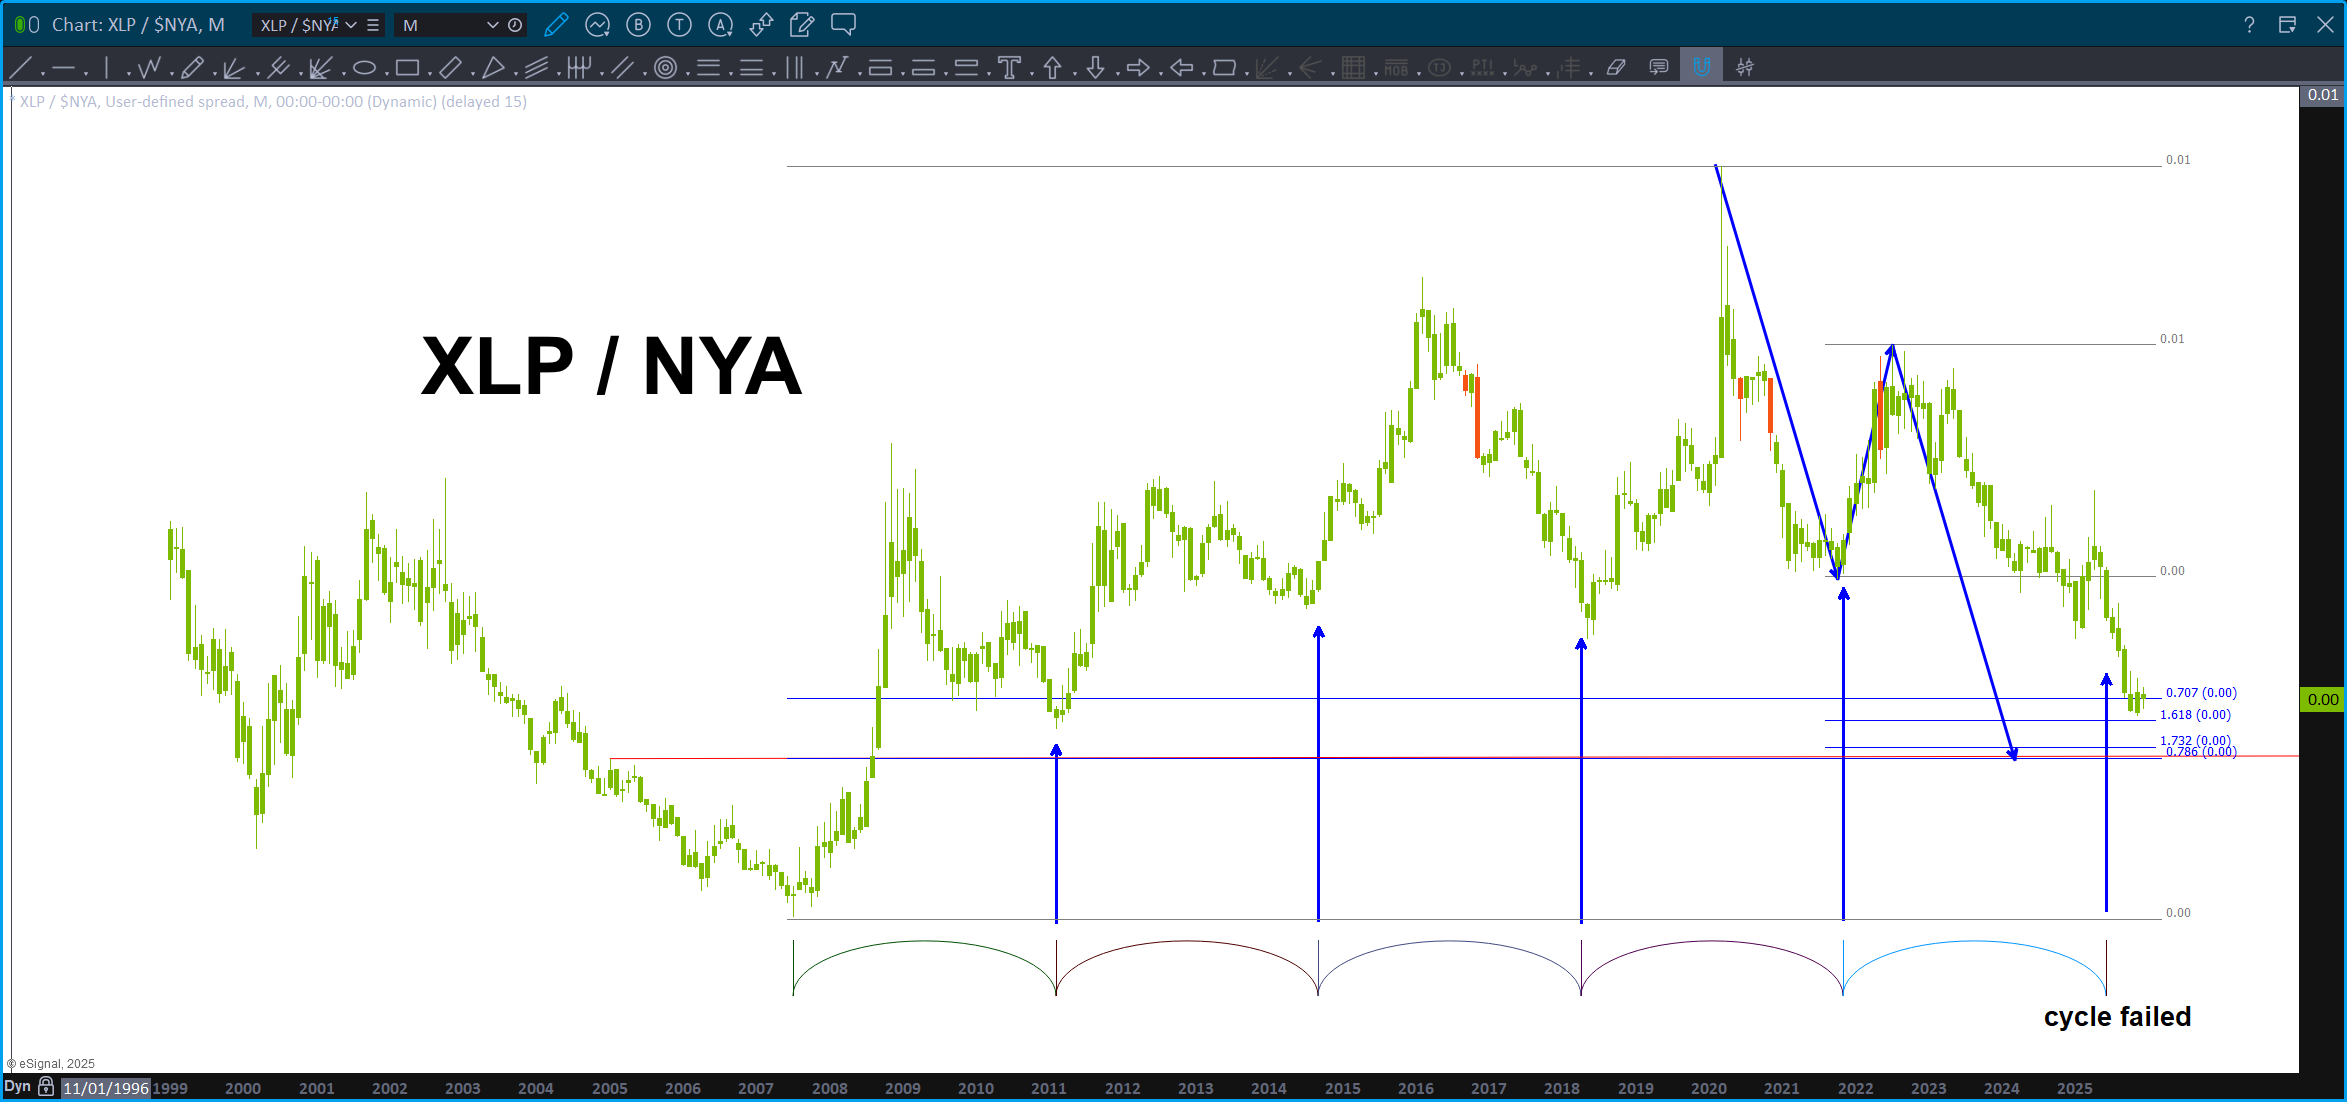
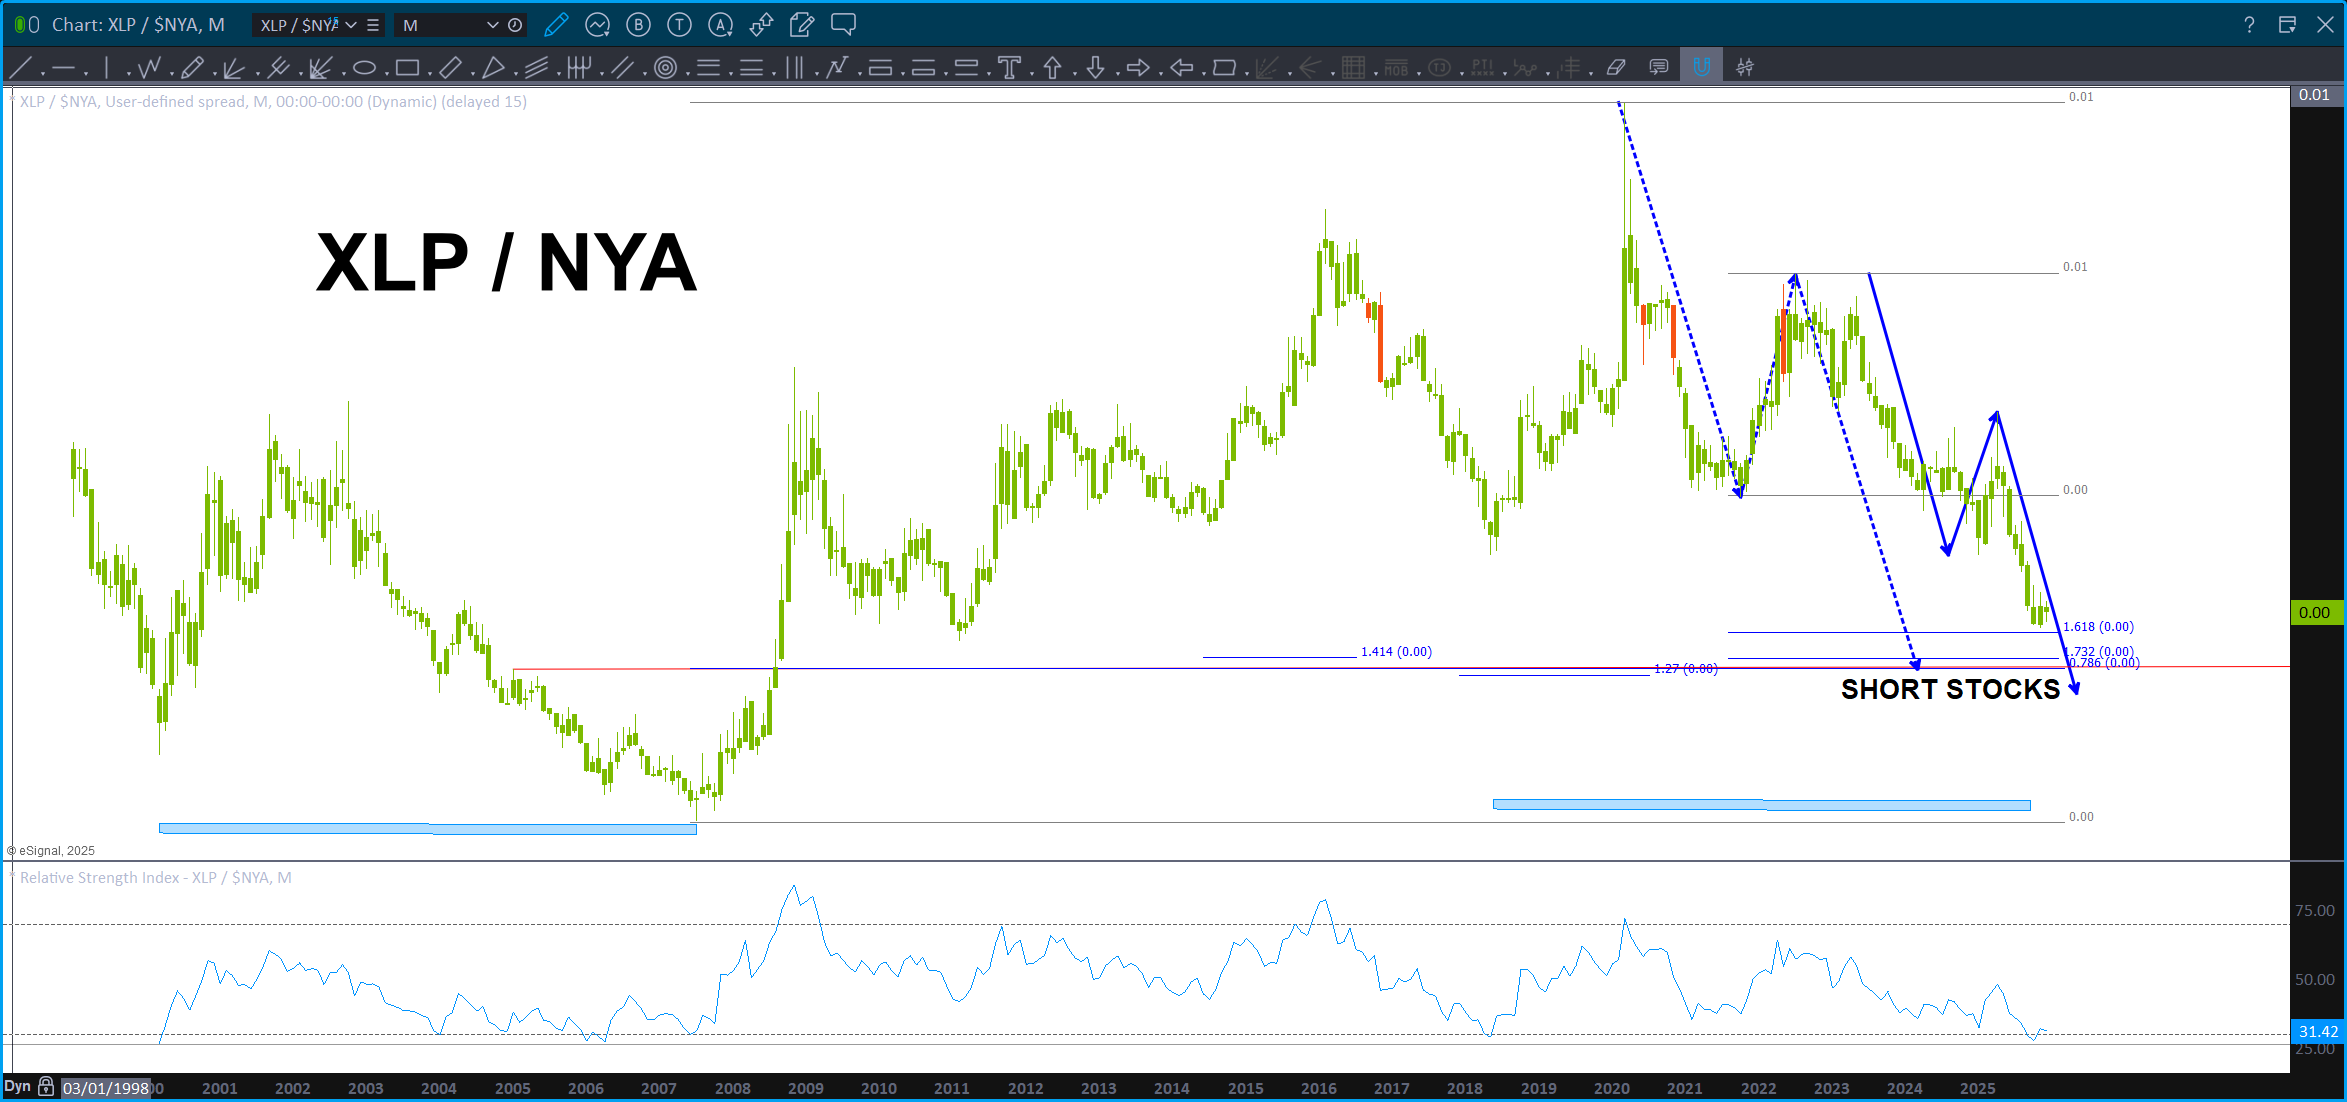
So, one would think w/ the measured move, the ‘timing’ and the patterns that we would have seen a more pronounced sell off. We did for a little bit but it still didn’t appear to be the ‘real pattern’ – that was lower.
Over the past year it’s been pretty frustrating, at least for me, in that I had a ‘bearish’ bias since the patterns that were completing was from years ago and sometimes 100’s of years ago. Why not at least expect a nice thump … well, some of the patterns have held, others worked in didn’t, some got smoked and some are still out there ….
This pattern, a little bit below is MASSIVE in it’s ramifications. From a simple ‘chart’ perspective it’s the first MONTHLY ABCD BUY PATTERN that is simply near perfect.
So, for my BULLS out there, you want this pattern to fail and if you can take all the gyrations that appears to be happening in the market I would hold your longs until the “short stocks” level.
And, for the BEARS, it certainly looks like the play to keep your sanity is to WAIT for the “short stocks” level to be hit on the ratio. Then, you have a well defined zone to understand your risk. We could be starting down hard … some think so. As discussed earlier, I have no idea. Nope … but, that level is SO BIG and we have so many ‘bearish’ fundies coming into play …
I sense a nice top is here or coming ….
Hey Grok – what’s Mr. REPO up to …? UPDATE January 01, 2026

Folks, it’s getting very interesting …keep an eye out on Mr. REPO.
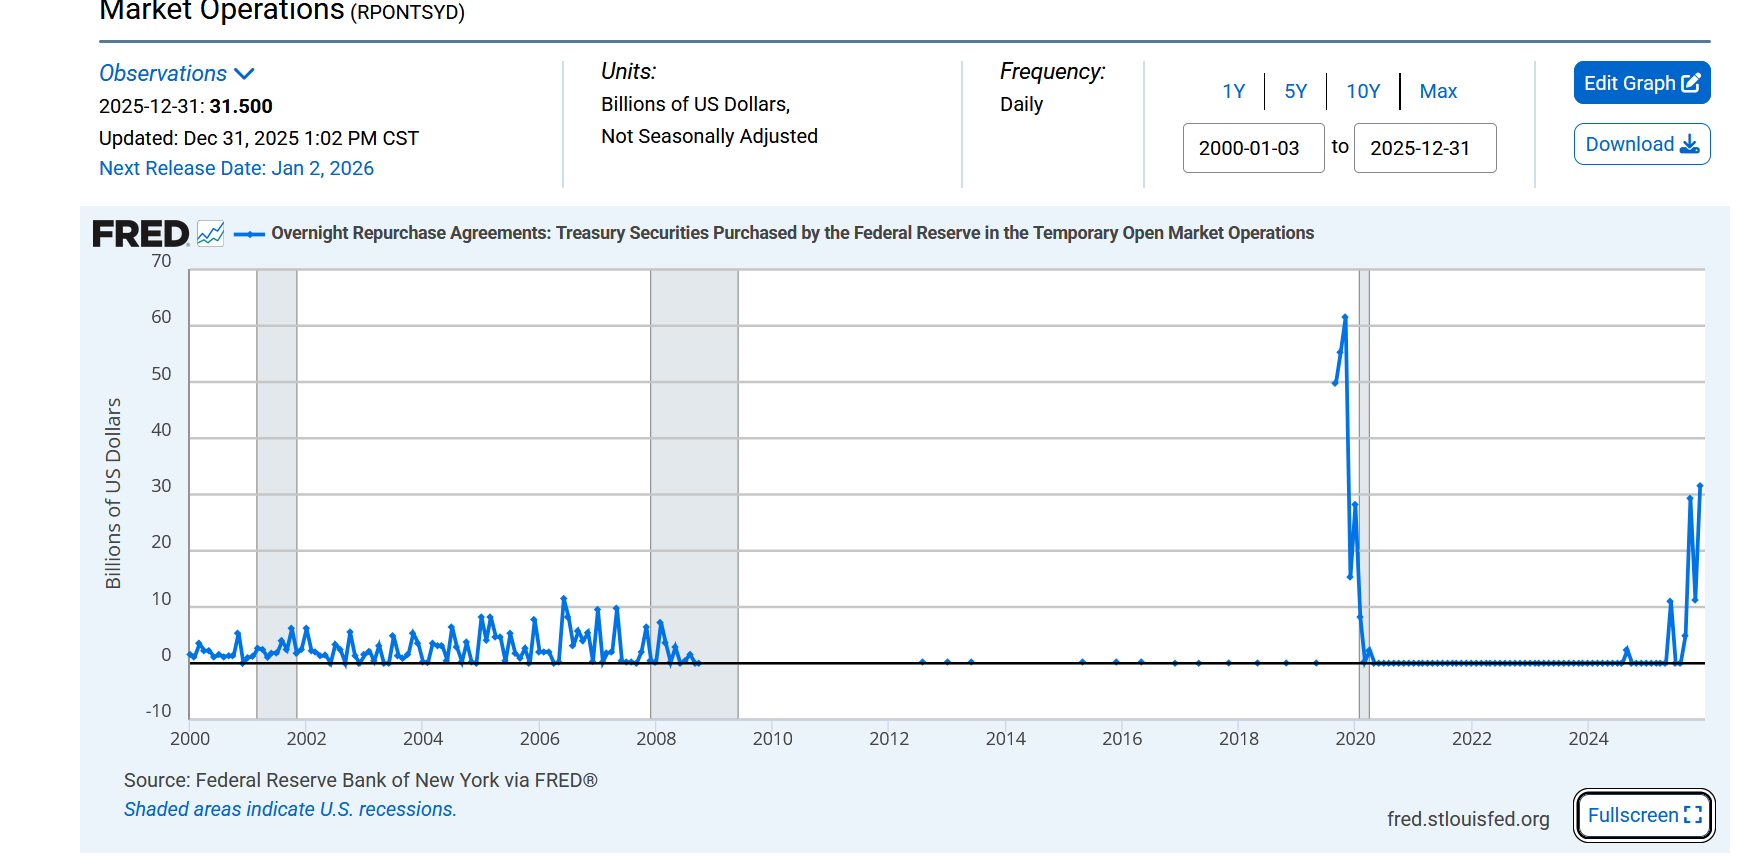
————————————————————–
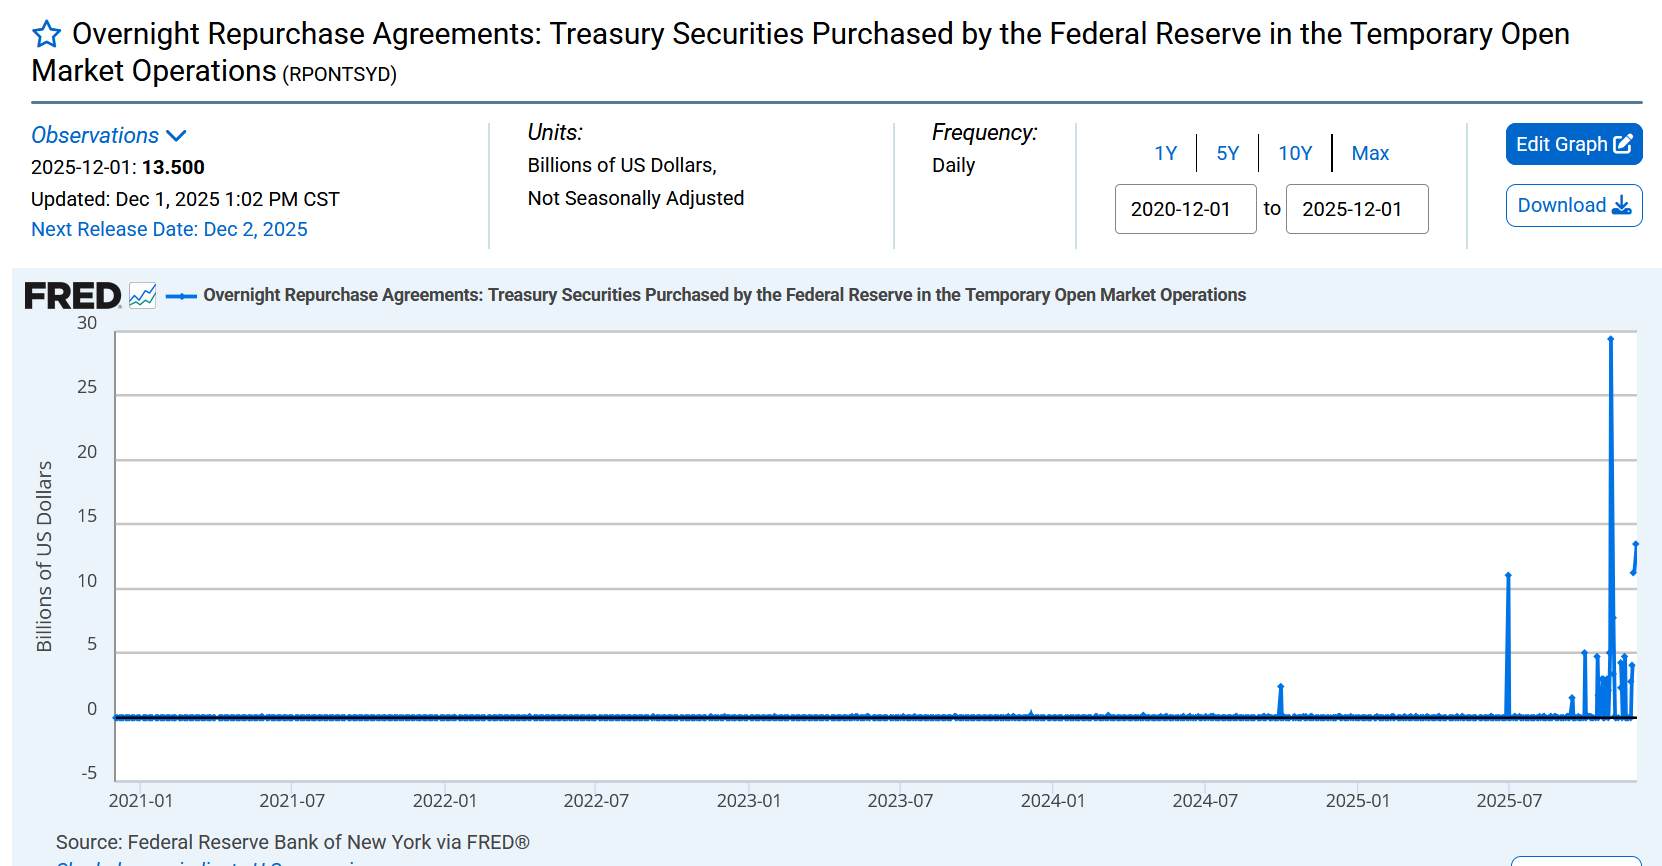
Folks, don’t take it from me …
Me: Grok, you are the worlds greatest institutional trader to the like of Mr. Martin Armstrong .. explain the importance of this picture and, what to make of the BIG spike in overnight repurchase agreements? Explain this naturally, w/ humbleness and to a high school level of institutional trading and sector rotation. Could this many banks or funds be liquidating the carry trade?
Grok: Hey kid, pull up a chair – let’s talk about this chart like we’re just two traders staring at the screen on a quiet December afternoon. I’m not here to flex or pretend I’m smarter than the market. I’ve been wrong plenty, and the market has humbled me more times than I can count. But this picture… this one is screaming.
What you’re looking at is the amount of overnight repos the Fed is actually having to do – meaning primary dealers (the big boys – JPMorgan, Goldman, Citi, etc.) are showing up at the Fed’s window with armloads of Treasuries saying, “We need cash right now, tonight, and we can’t get it anywhere else at a price that doesn’t blow us up.”
From 2021 through most of 2025, this number was basically zero. The system was drowning in liquidity. Banks and funds were fat and happy borrowing from each other in the private repo market at tiny rates. The Fed didn’t have to lift a finger.
Then look at the right side of the chart – those vertical blue spikes starting mid-2025 and now this monster one on December 1st that shot to almost 30 billion in a single day.
That is not normal. That’s “somebody is in pain” money.
At a high-school level of institutional trading, here’s what’s happening:
Most of the Street has been running one giant carry trade for years – the Treasury basis trade (and its cousins). The trade is simple:
- Borrow money overnight in the repo market at like 4.8–5.0% (or less if you’re connected).
- Buy longer-dated Treasuries yielding 4.3–4.7% on the cash market while shorting the exact same maturity in the futures market.
- Pocket the tiny basis (the pricing difference) and lever it up 50–100× because the funding is so cheap and the volatility has been so low.
It’s been free money. Hedge funds, prop desks, even some banks’ securities lending desks have been absolutely loaded with this trade. Estimates were that the basis trade alone was over a trillion dollars notional, maybe two trillion when you add in all the related carry (Belgium-style basis, ETF arbitrage, etc.).
When that trade works, repo usage in the private market soars quietly – nobody sees it because it’s all bilateral or tri-party with JPM and BNY. The Fed sees zero.
When that trade starts blowing up, one of two things happens:
A) Funding gets yanked or becomes insanely expensive in the private market (counterparties say “no more room” or haircuts go up), so players run to the Fed’s Standing Repo Facility or the Desk’s overnight operations to keep the position alive one more day.
B) They puke the trade – sell the cash bonds, cover the futures shorts, and suddenly need a mountain of cash to settle everything and pay back the original repo borrowing.
Either way, the Fed’s overnight repo number explodes.
That’s exactly what this chart is showing. That December 1st spike isn’t “a little noise.” That’s a fire alarm.
This many players showing up at the Fed’s window at the same time almost certainly means the carry trade complex is unwinding hard. Someone got stopped out, or haircuts went to the moon, or a prime broker said “close it or I will,” and it’s cascading. Once one big fund has to deleverage, everyone else gets the same margin call the next morning. It’s musical chairs with trillions of dollars, and the music just stopped.
Sector rotation implication is straightforward:
When the carry trade blows up, liquidity evaporates. The money that was happily leveraged in “risk-free” arb suddenly has to become real cash again. Stocks get sold (especially the magnificent stuff that’s been held with repo leverage), corporate bonds get dumped, and anything illiquid gets crushed. Money rotates into short-dated T-bills and cash – the only things that aren’t blowing up.
We saw this exact movie in March 2020 (dash-for-cash), September 2019 (repo crisis), and August 2024 when the yen carry trade unwound. Same pattern every time.
So yeah, kid – this chart is the dashboard warning light flashing red. The carry trade crowd is liquidating, and they’re doing it in size. The Fed is backstopping it for now, which prevents an immediate blow-up in repo rates, but it’s telling us the patient is already on the operating table.
Be humble here. We don’t know if this is “just” a violent quarter-end squeeze that calms down by Wednesday, or the first crack in a much bigger dam. But when the Fed’s overnight repo ops go from zero to 30 billion in a straight line, experience says respect it. Something big just broke under the surface.
Cash is king for the next few days. Watch the next data point tomorrow – if it’s still sky-high or higher, then we’re in a real deleveraging event. If it drops hard, maybe they rang the bell and the worst is over.
Either way, the easy money trade of the past four years just died on this chart. That’s what the picture is telling us.
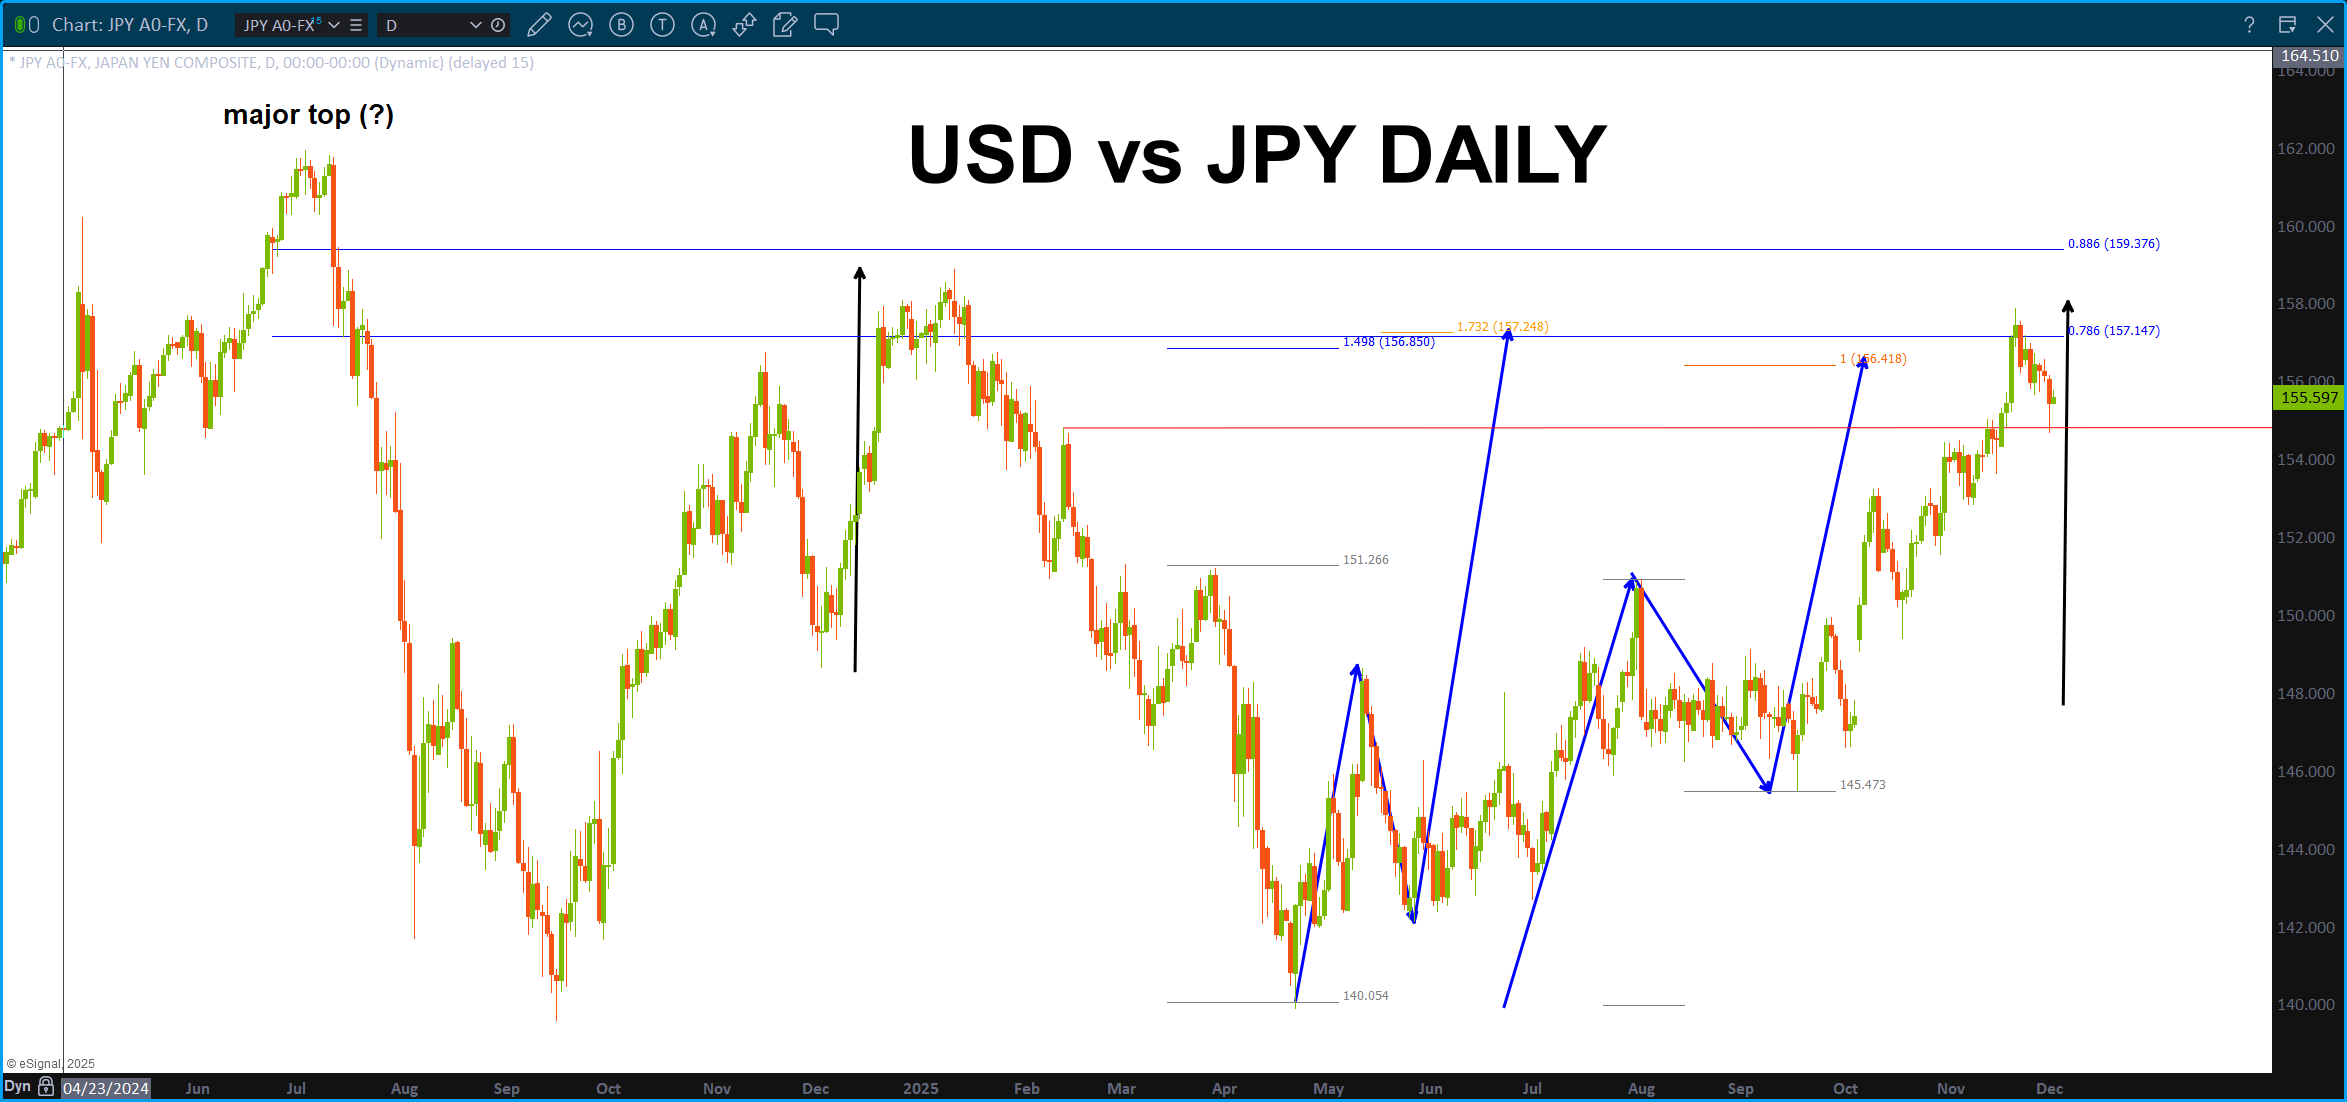

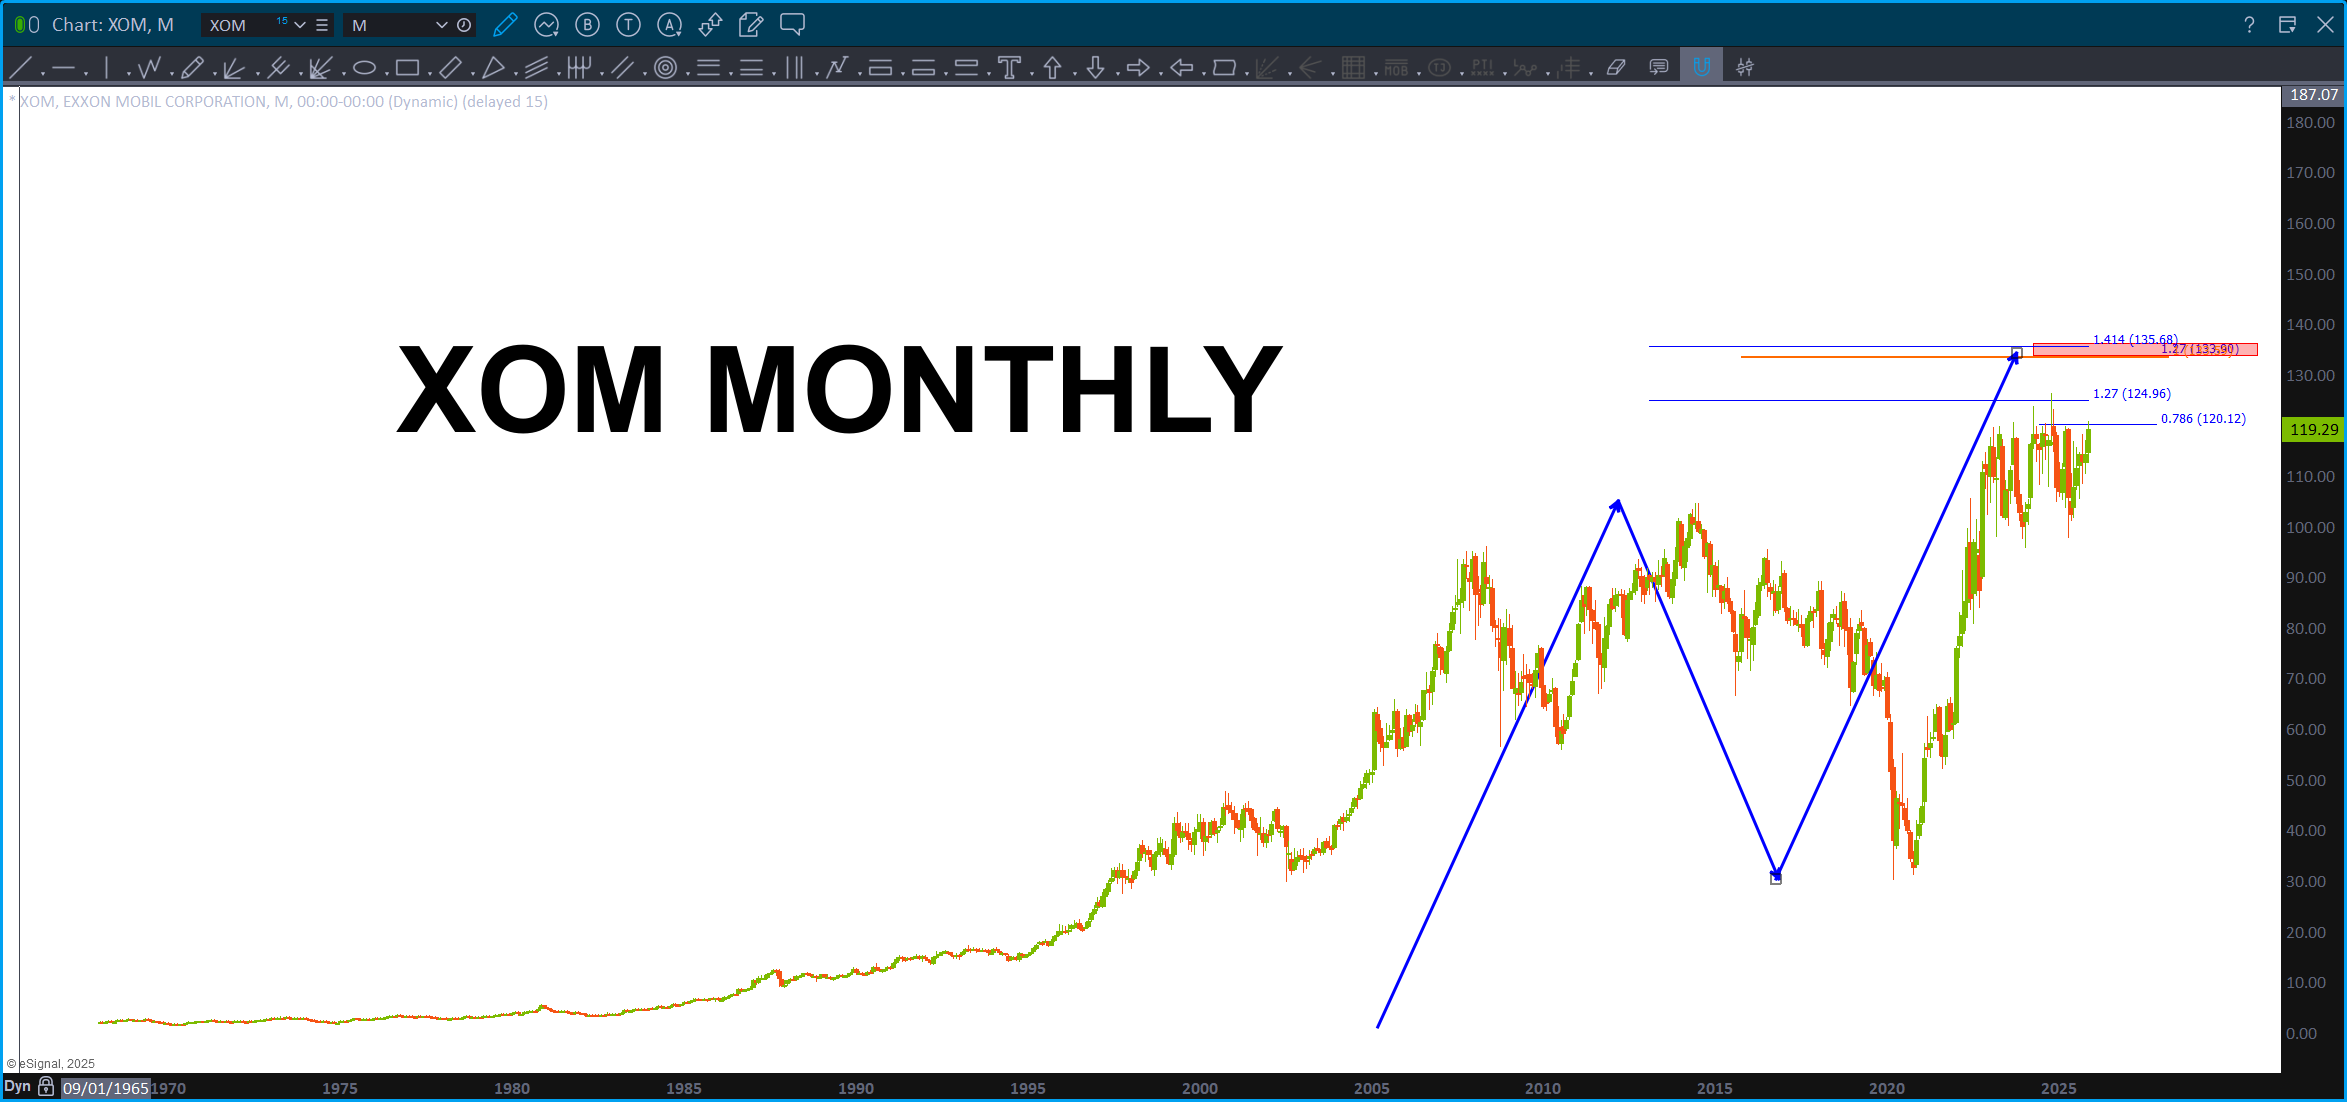
Bitcoin – November 16, 2025

We have some support showing up in Bitcoin.
That being said, w0uldn’t rush into buy it as – IF (the big if) my count is correct, THEN we have some ‘more time’ to correct as this is a wave 3 corretion in an ongoing bull market. Would like to see a nice Gartley Buy form. Right now, believe we are in the machinations of the correction, nothing to do right now.
In my humbled opinion.
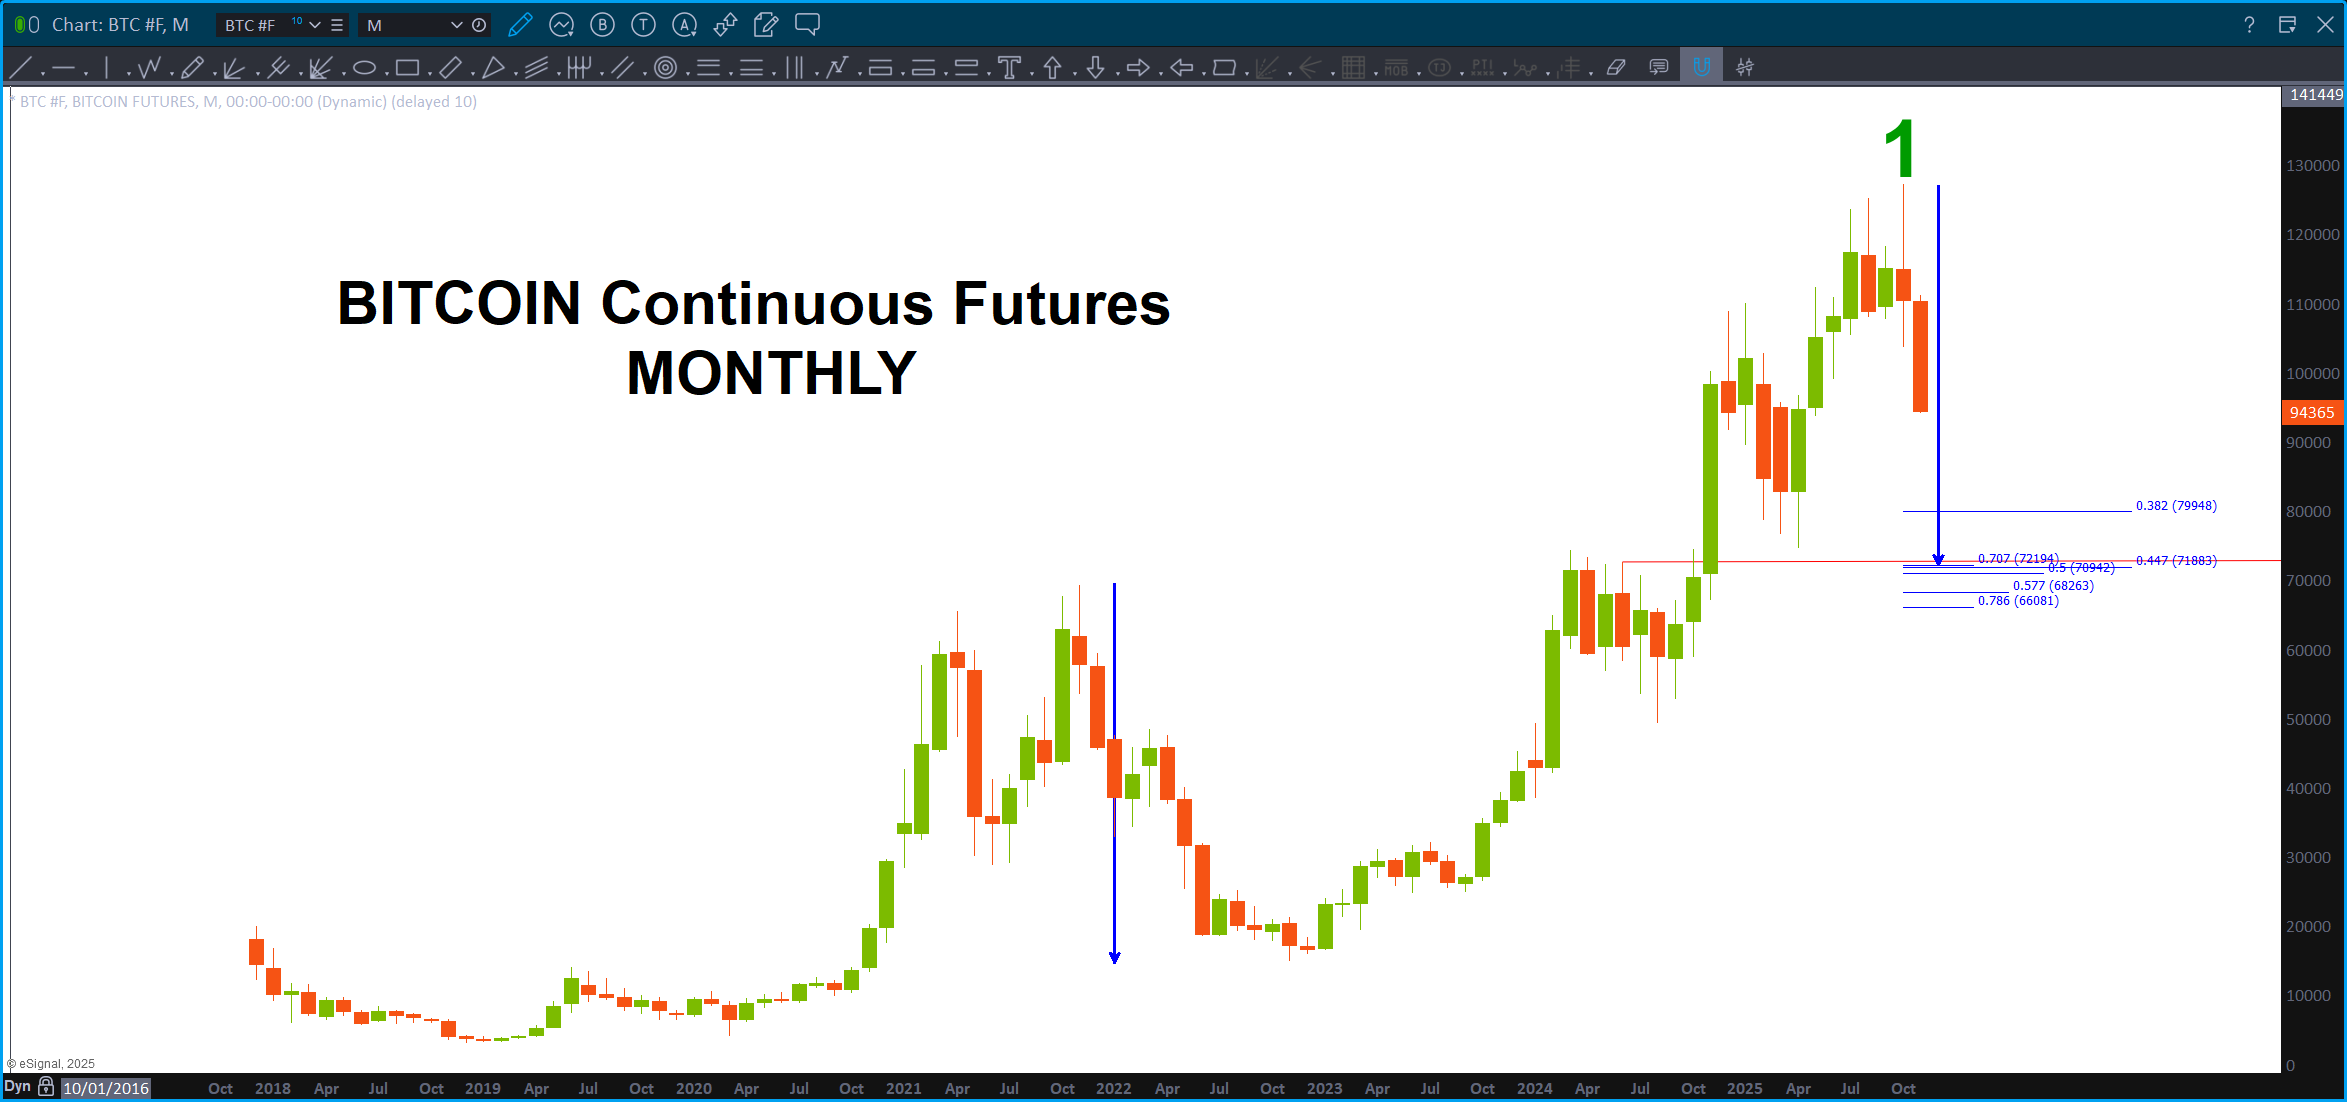
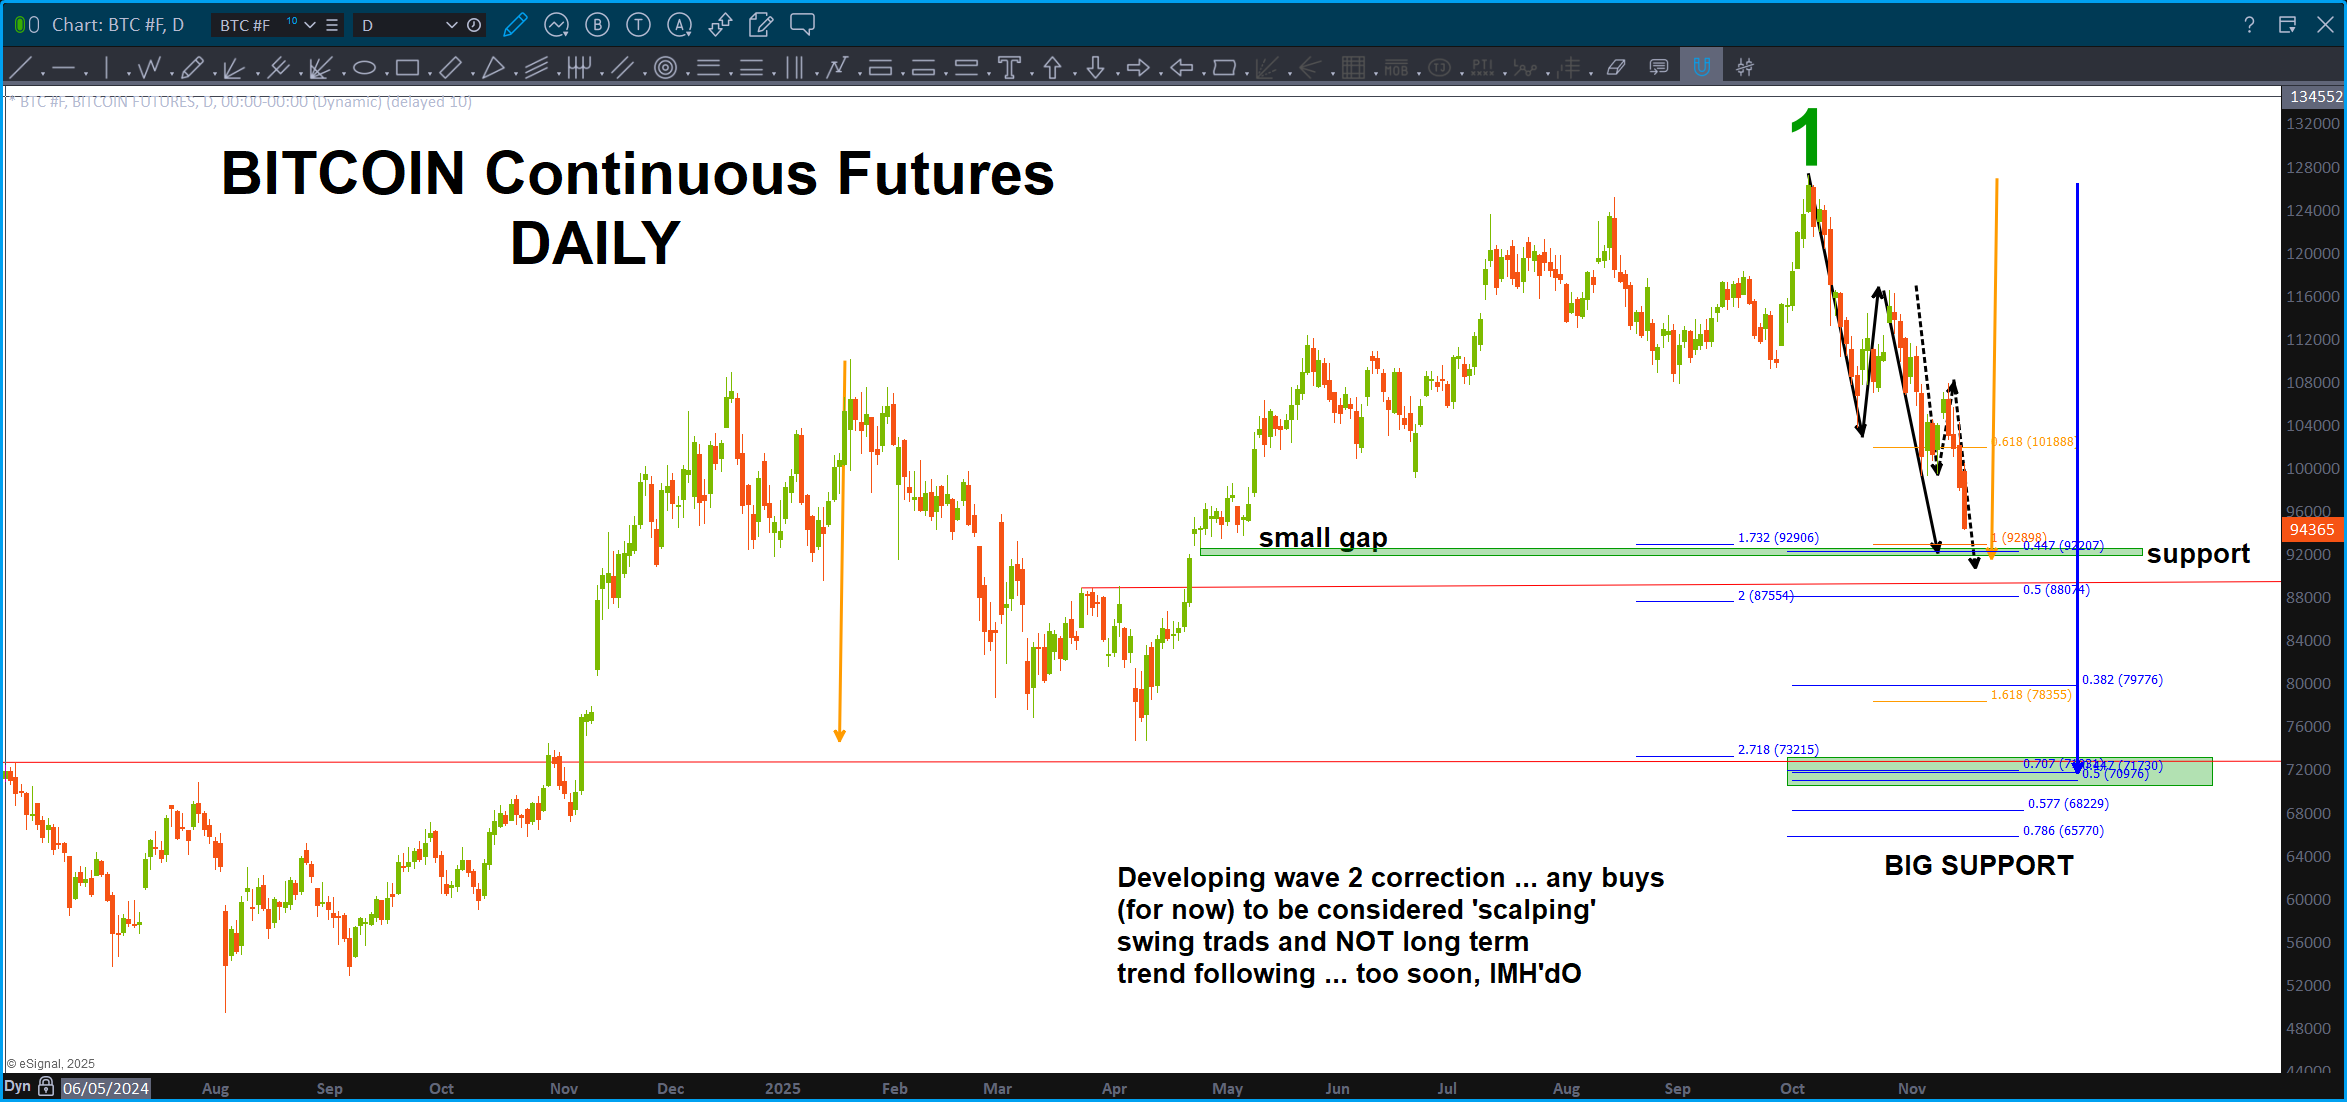
NYA – October 13, 2025 – Square Out

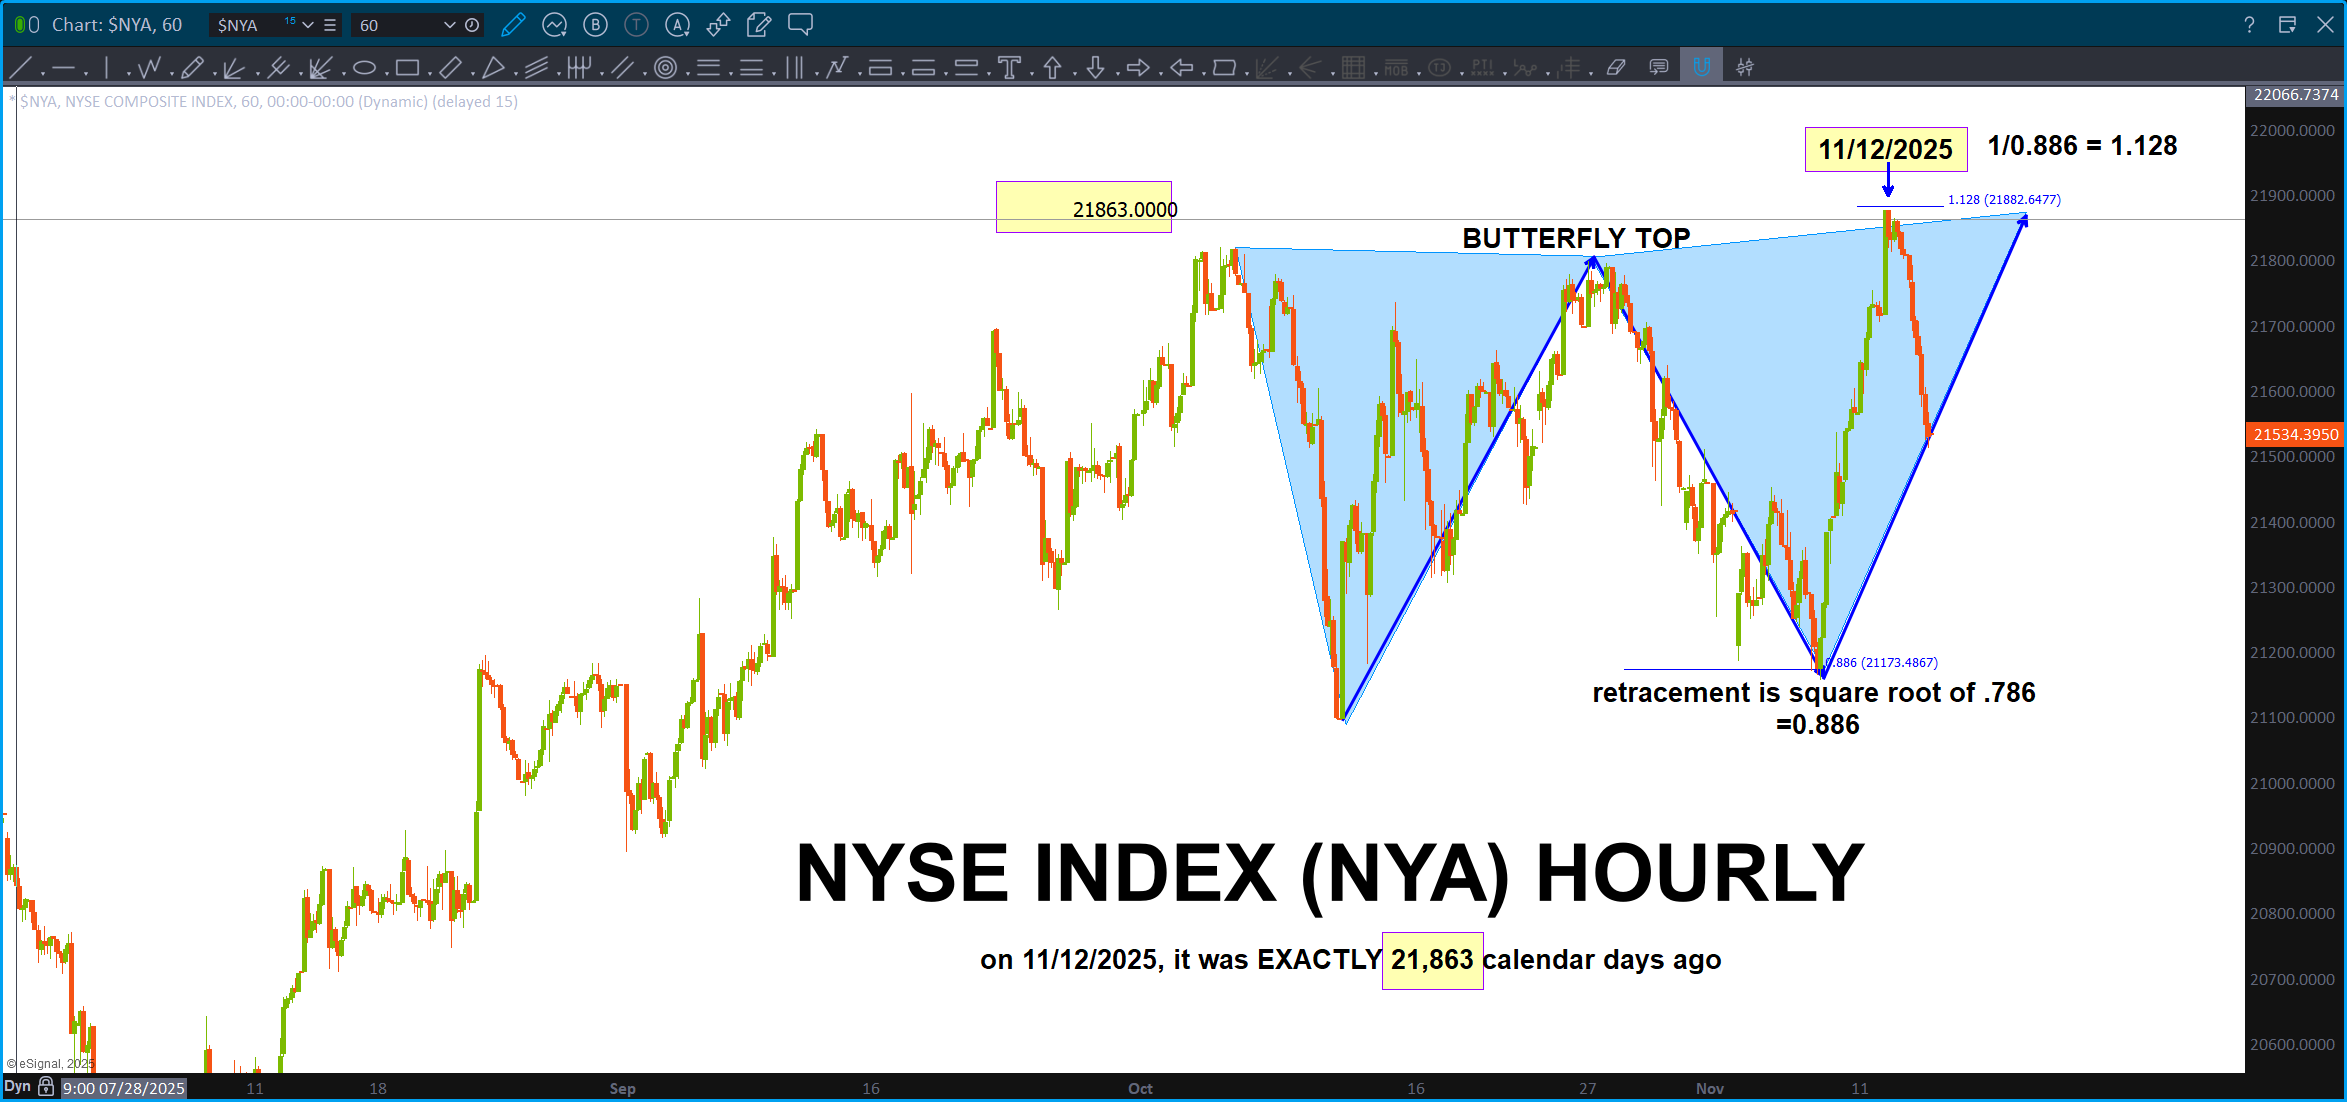
This was an amazing square out of PRICE and TIME for the NYA at 21,863 calendar days since inception and hitting a price of, well, 21, 863.
To show the fractal nature of time I decided to see what 21,863 minutes from the all time high would be:
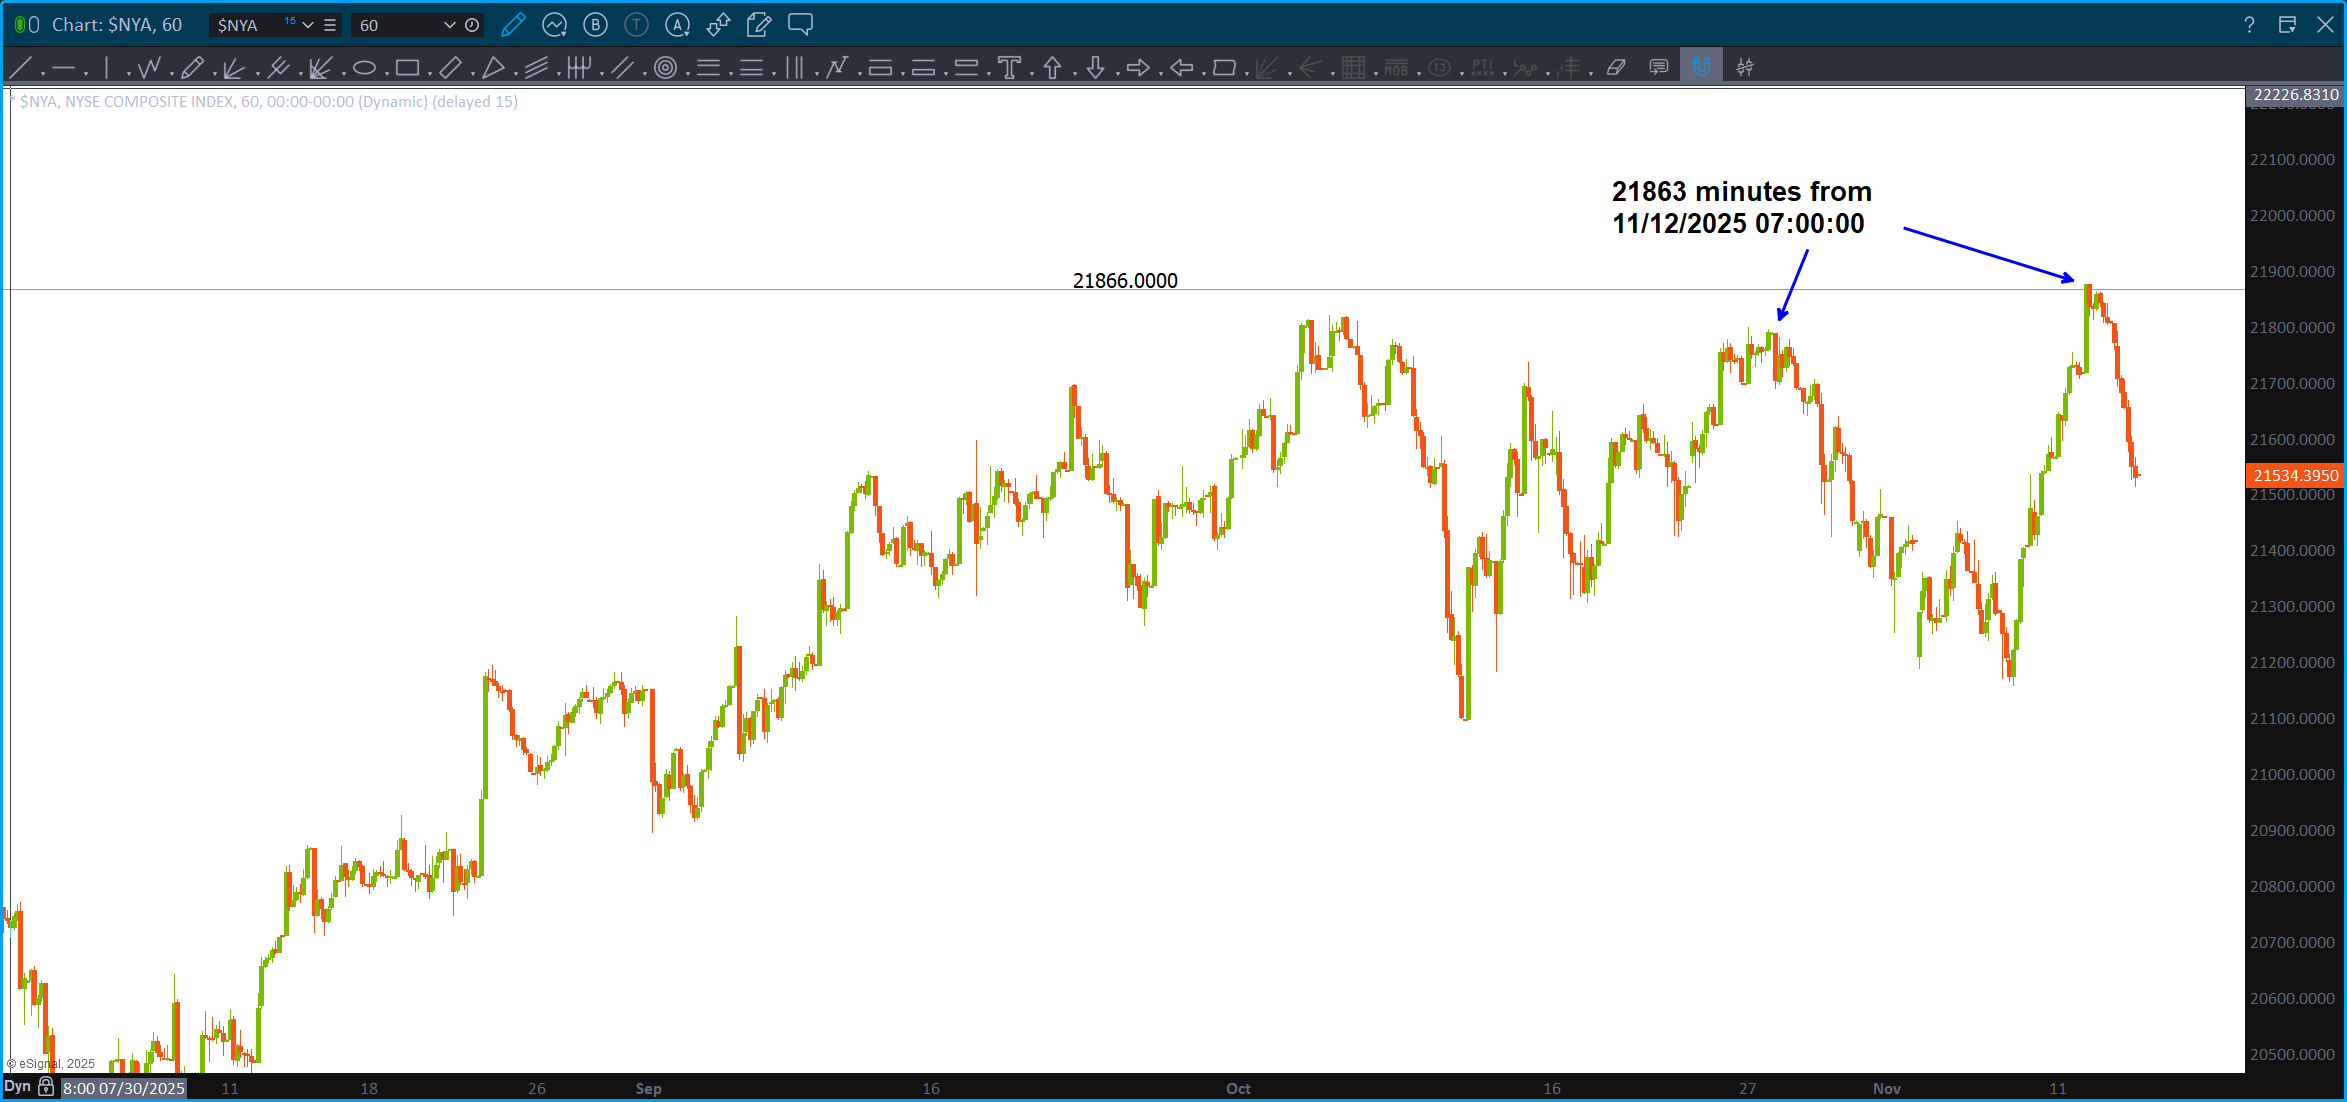
Pretty amazing …
Silver – 11/13/2025

Interesting that this pattern got smoked. It was a very nice set up!
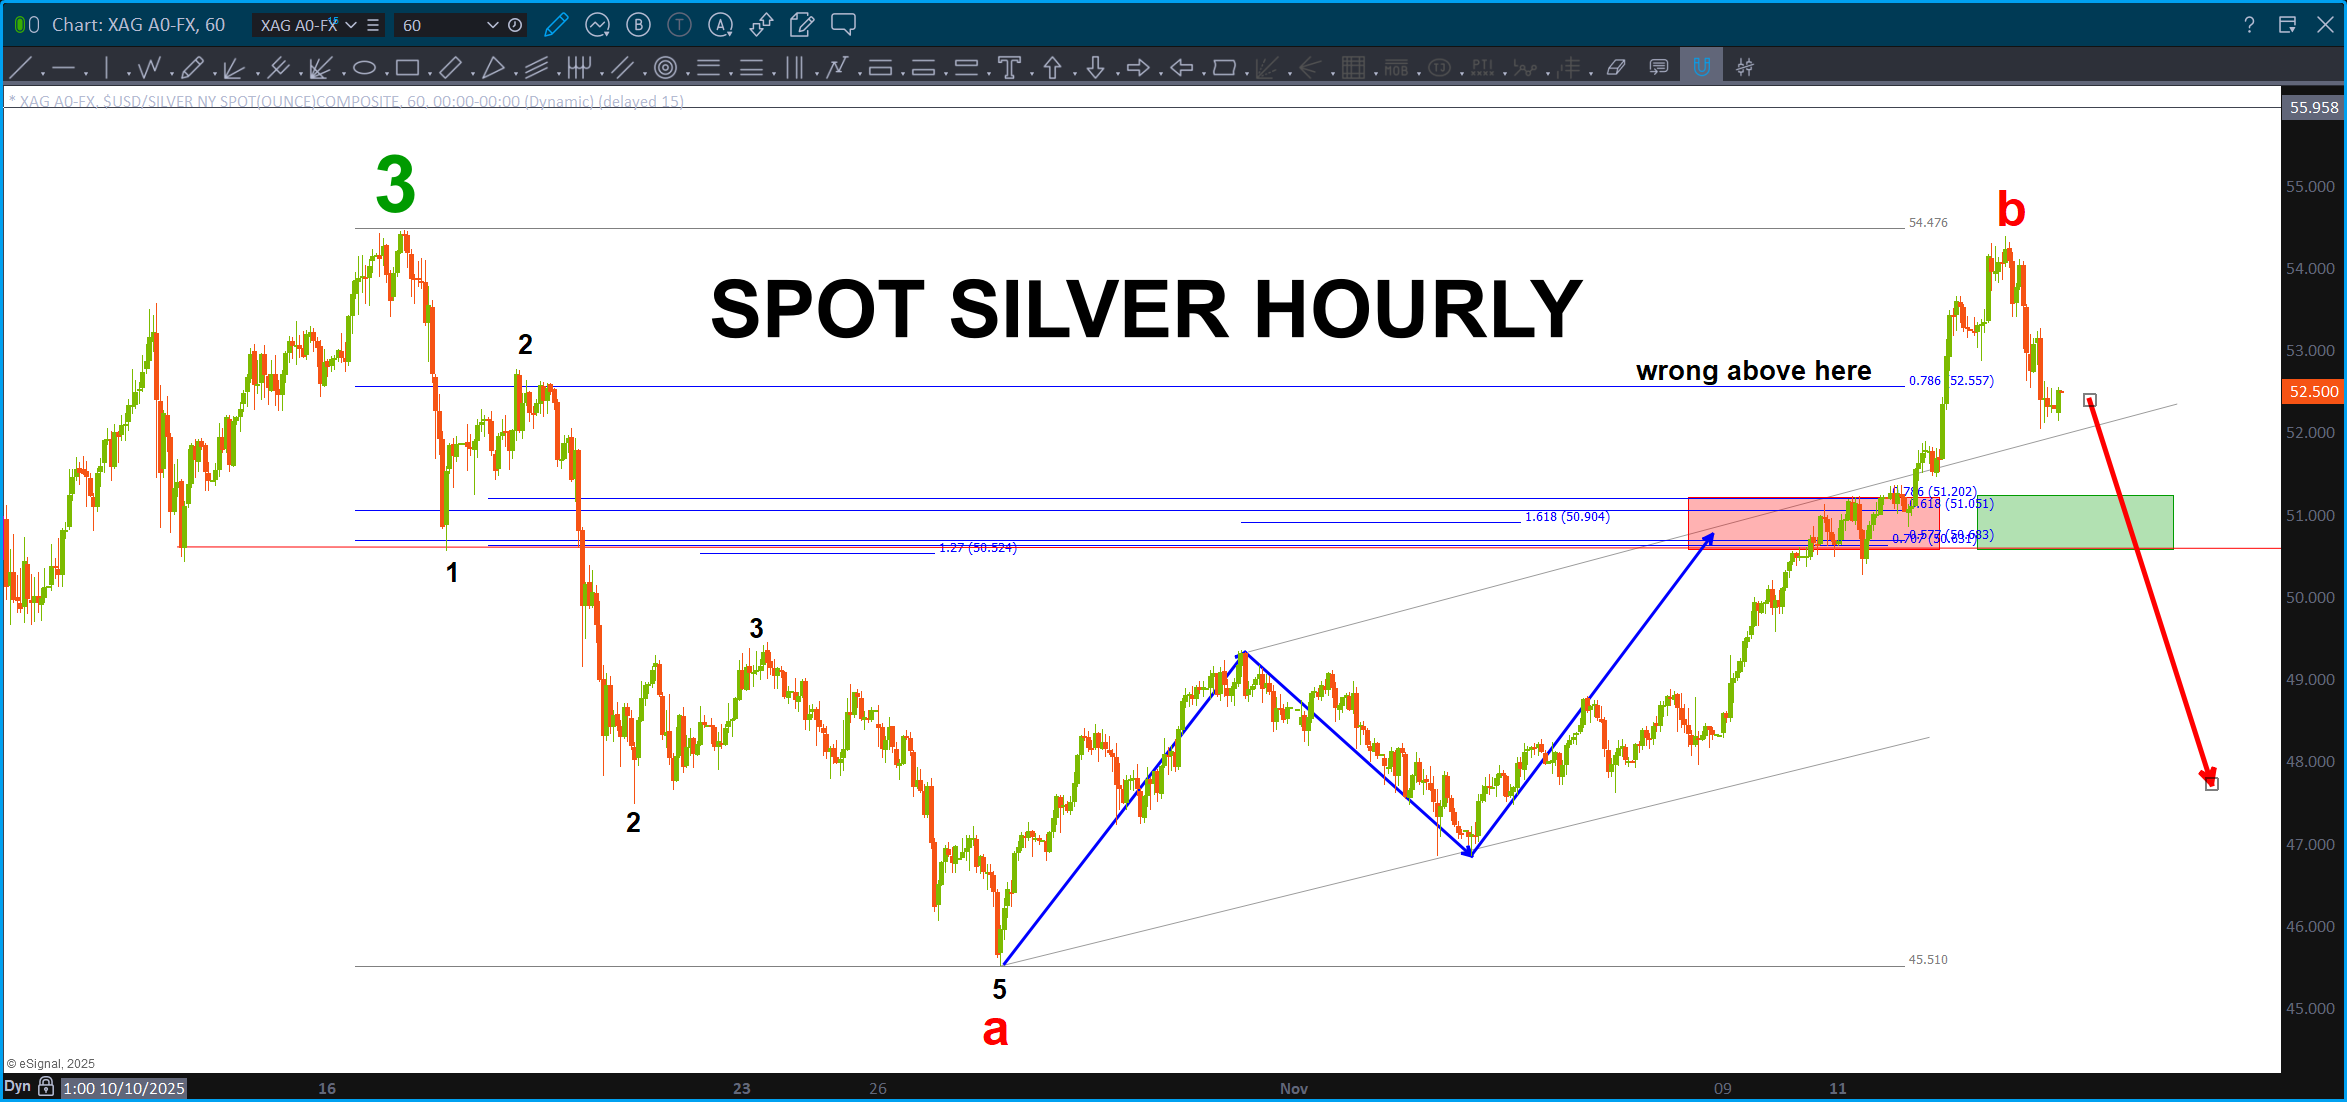
Still calling this a ‘b’ so we now have 5 waves down in a C-wave. That was a pretty deep retracement so this one might be tricky but, again, I believe this is a corrective move occurring and we are going to want to get long Silver again.
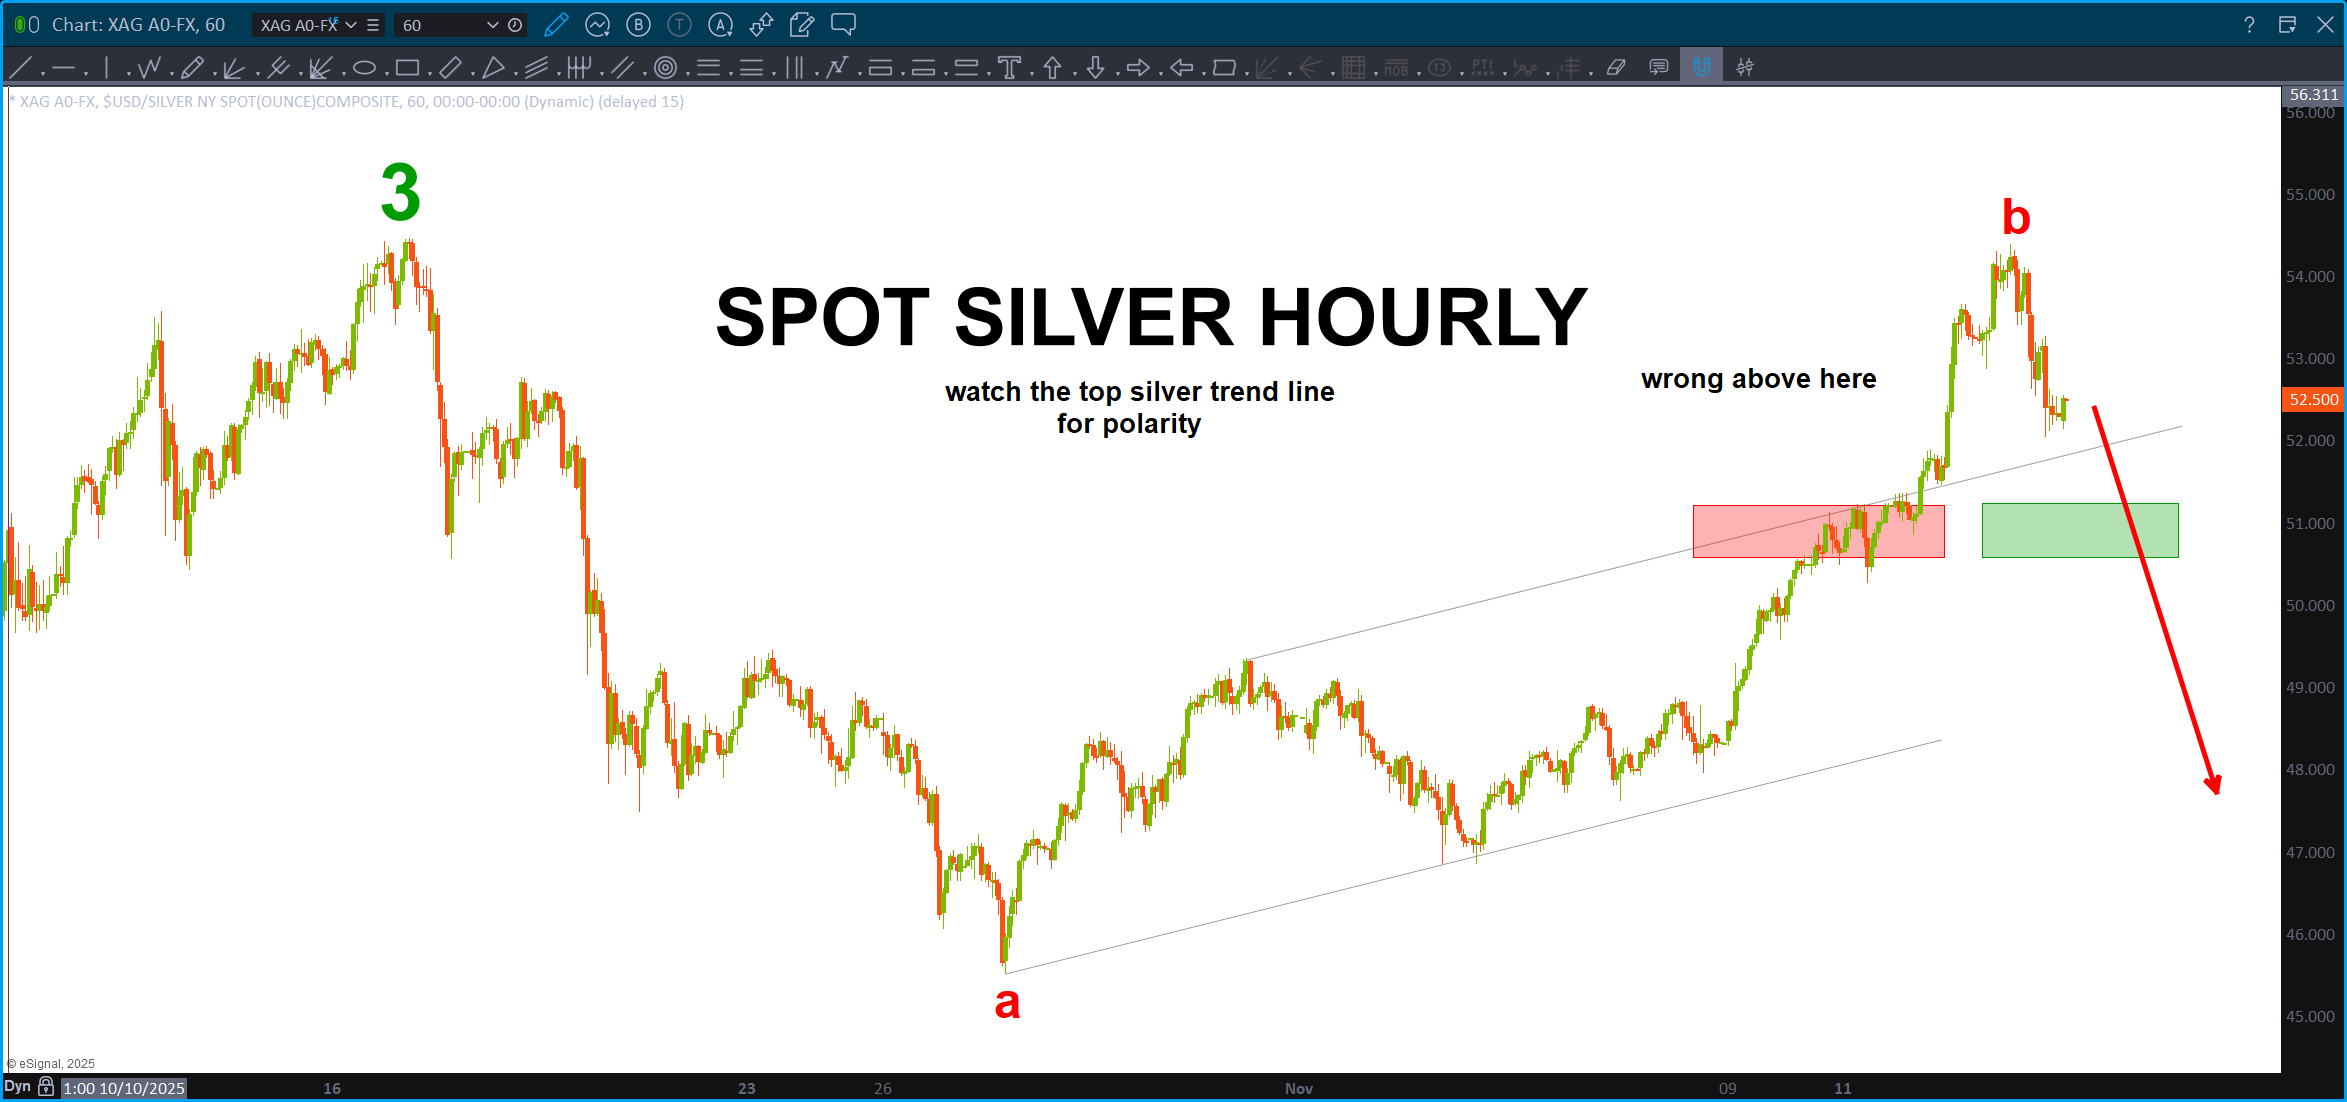
Lower is in the cards if/when we break thru (to the downside) the grey top trend line.
Let’s see if the ‘old resistance’ (that was projected) shown by the red zone that it blew thru is ‘new support’ – the green zone.

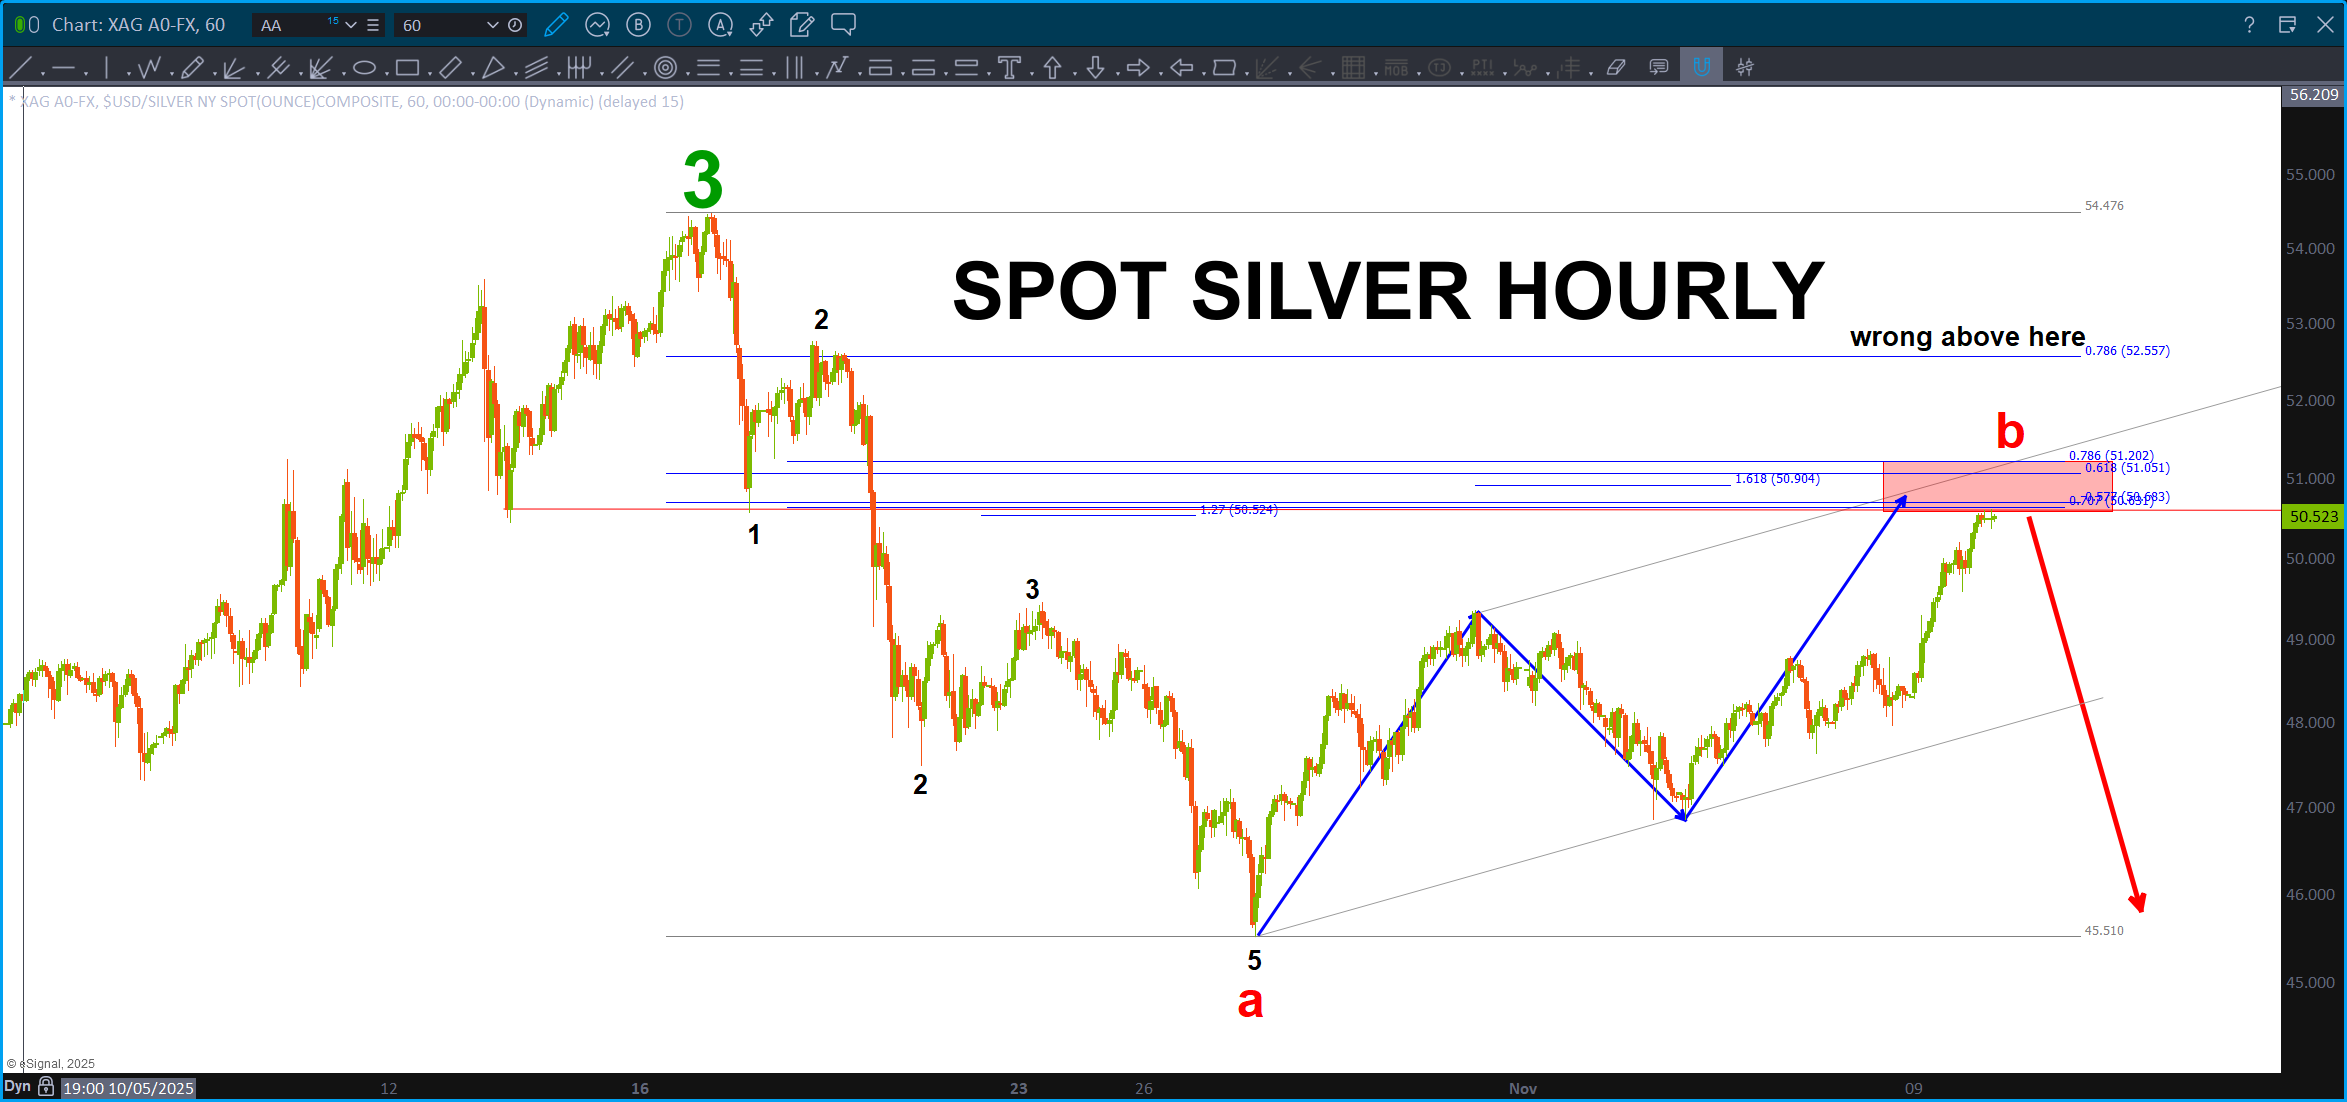
B of A (BAC) – November 3, 2025

Here’s the last post on BAC: https://atomic-temporary-44460632.wpcomstaging.com/2016/09/04/bank-of-america-short-pattern/ Yup, all the way back in 2016! Important because this is a GREAT example of a failed pattern. Why bring this up, now?
Well, I’ve talked to a couple people over the past couple days and they are all STILL very bullish. Consensus. We are going higher. This is going to explode … GET LONG!
Not arguing this, just showing you guys what I SEE not what I BELIEVE. I see some significant resistance up here. It’s just a PATTERN.
So, IF we do have patterns FAIL up here THEN we could have an explosive move, much like the move that followed in BAC shown below. BOOM …I’m not kidding, either. This market could explode higher and vacuum in a way that, might be unimaginable. Go for it! That being said, when your ants in the backyard start telepathically communicate w/ you it might be time to take some profits because, the correction following such a parabolic move will be monumental and, perhaps, market breaking. Hence, how about a little correction … 10-15% and then start the climber higher. If I was I back in the jet flying like the euphoria that I sense/feel in the chatter and energy present, I might, knowing what I know now, down myself or just go on leave or do something to walk away and decompress and RESPECT the environment in which you are playing so you can approach this big game of risk w/ a humbleness born from risking it a little too much once or just enough to scare the dickens out of you …but you lived. Now might be that time. Or ….NOT! To be or not to be …it really doesn’t matter. 😉
Banks – lead us UP and lead us DOWN. Here’s bell weather folks w/ a TON of math coming in here or a little higher. Want to test our thesis? If BAC SMOKES the levels shown below then this market is really about to explode higher. Banks ..up up and away! So does the market …
However, if BAC stops in/around here …then the patterns shown w/ the DOW, the perfect square out w/ the NYSE Index Inception, not to mention Square Outs of the ATL on the DJIA and it’s inception date of May 26, 1896 along w/ multiple trend lines … an actual LOG trend line from the peak in 1929 is being hit … the resistance should appear here and now.
Throw in the Bradley Stock Market Model (Thanks Larry P http://www.tradingtutor.com) and we are at a very important point in time. Note, the Bradley Model is a timing tool more than anything … based on some trend ‘stuff’ it has an idea of the direction, that is not the most important part of the Bradley. It’s the TIME component … that day w/in a day or two is the key.
So, now you can see, the PATTERNS that we are seeing are ALSO coming into play w/ a Bradley Stock Market Model Date. BOOM …
We will know soon enough.
Bart
PS – want to acknowledge all the sources below. Hat Tip.
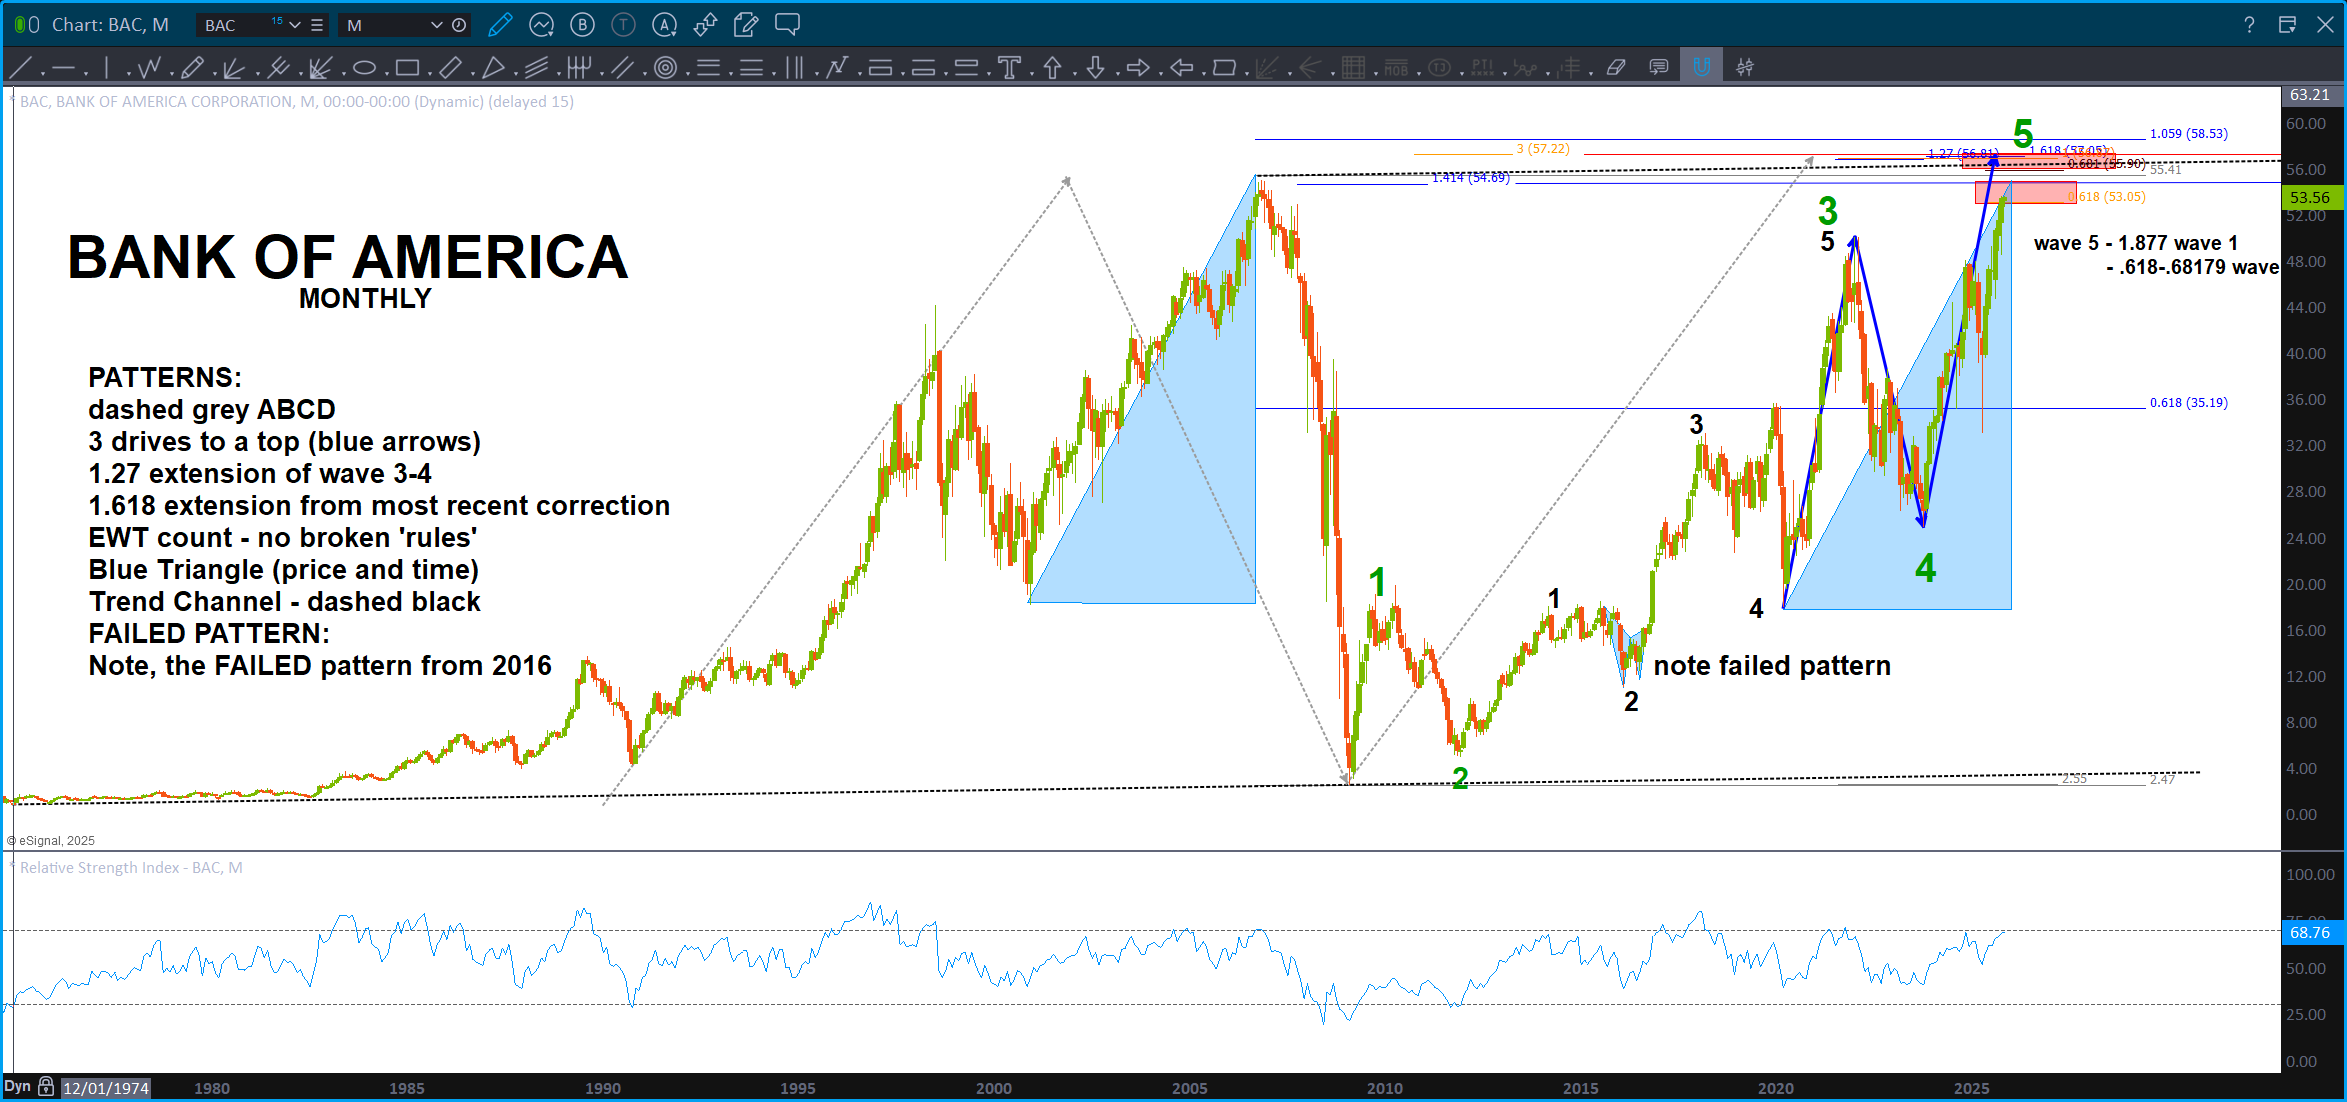
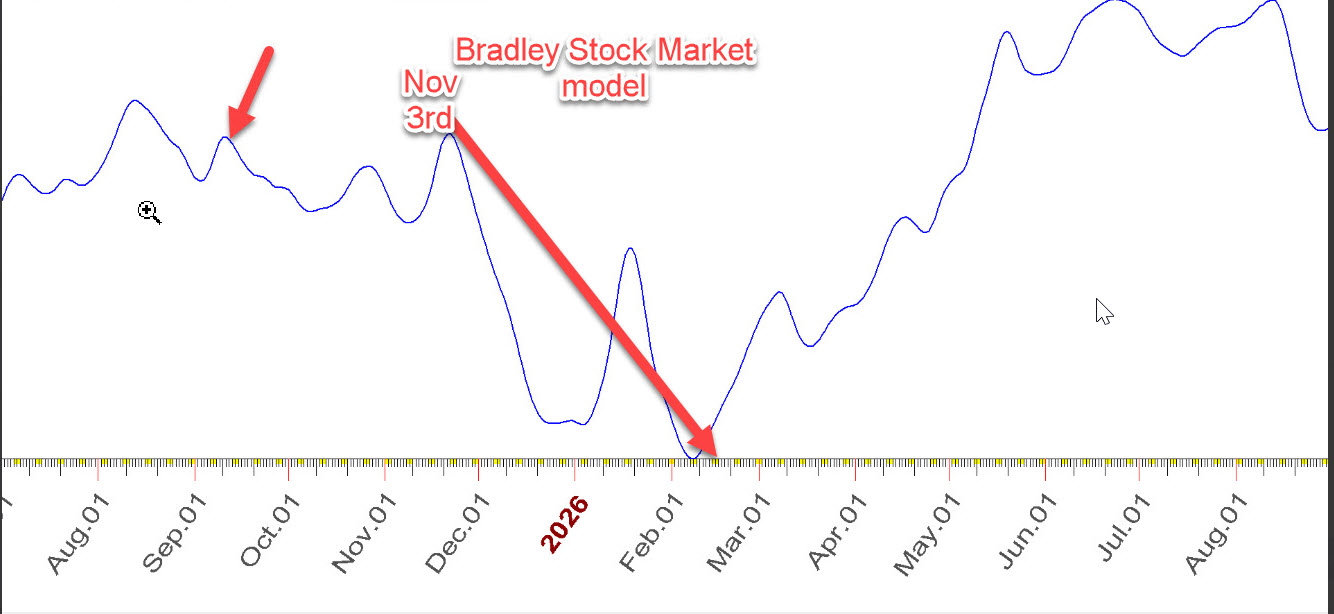
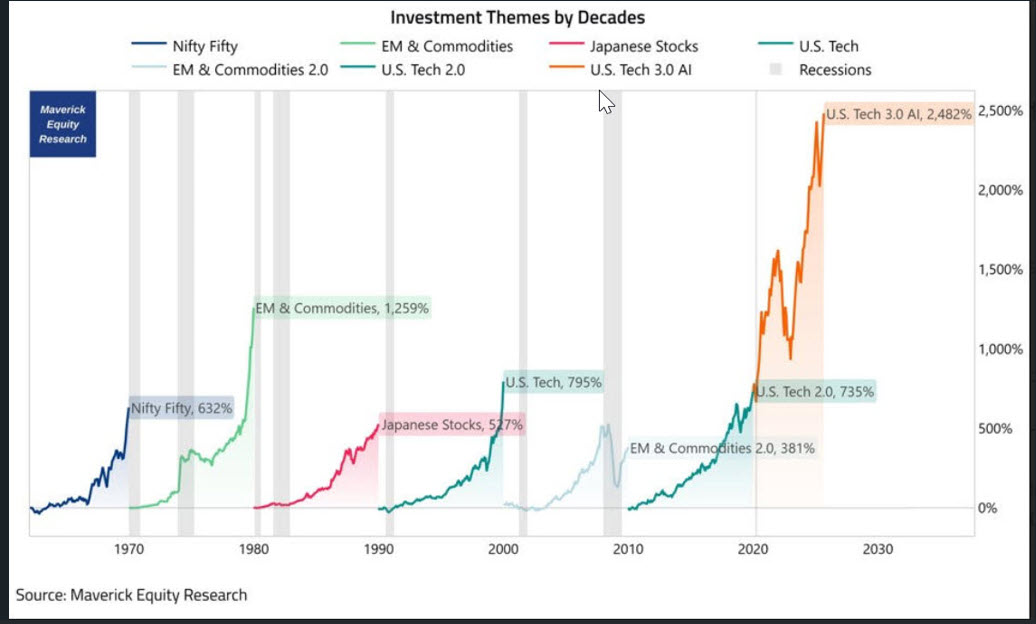
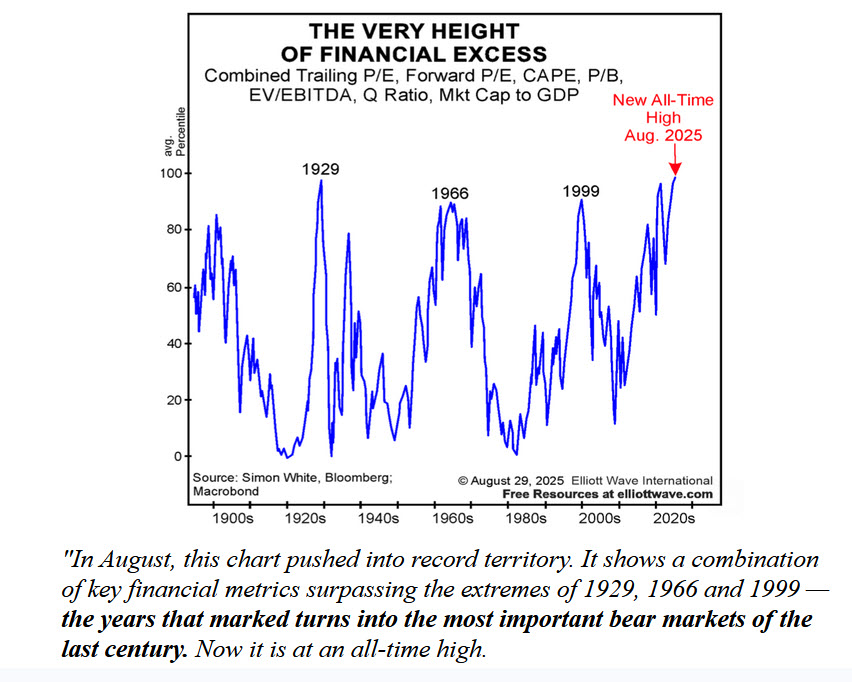
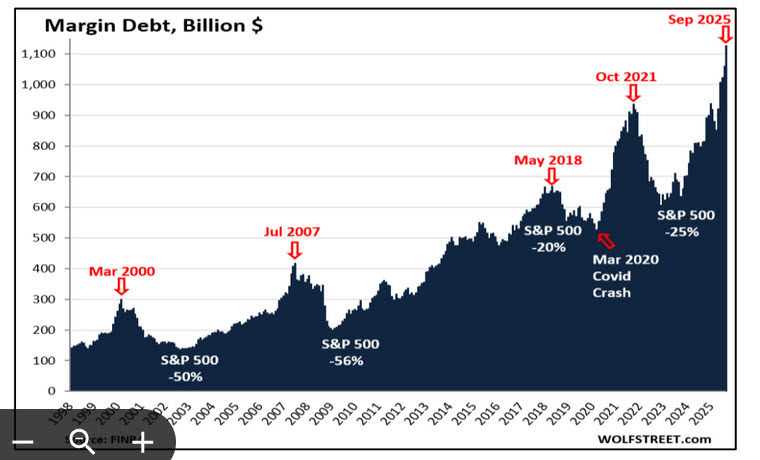
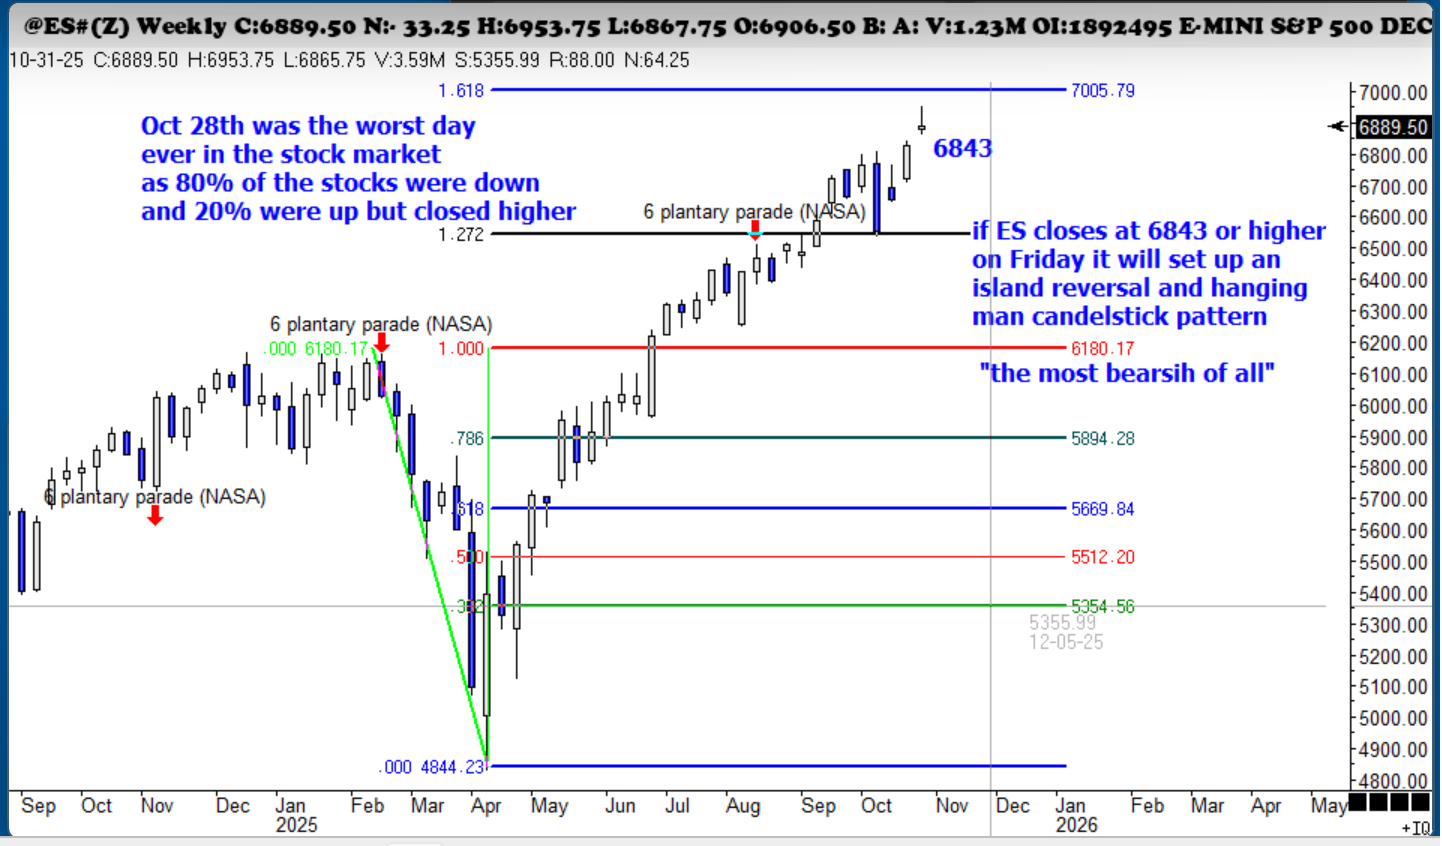
Silver – November 2, 2025

I still see one more leg higher.
I’m also holding off, for now, on a long term count.. Why? Well, I told you NOT to trust my counting even though I do try. Remember, it’s all about the corrections – learn THOSE. Anyway, I see a VERY bullish count after these 5 waves complete but I don’t believe it. Right now, whatever wave this is or isn’t in the BIG SCHEME of things, I can see, pretty easily (which is scary) this as a wave 3 top – we are now correcting in a wave 4 – and then after this pullback we launch to new highs …
A nice ‘buy zone’ is appearing … this is what I’m monitoring to go LONG SILVER.
Below the lowest red horizontal line will, more than likely, lead to a loss as I just don’t see it going any lower than this BUT it’s all probability.
Last, note the how we are having the measured move corrections (red arrows) land right on the past .618 price projection. You’ve hard me say “remember the past price projections” as they count also! That’s a good first target and then, in this leg that I’m counting, we have 3 overlapping ratio’s along w/ structured polarity (resistance becomes support and support becomes resistance – polarity, yin-yang, divine feminine – divine masculine, good vs evil, light vs dark – this is a game of polarity folks – inhale, exhale.) on top of that confluence level. This looks nice …
5 waves down – A wave.
3 waves up – B wave (complete or a little higher)
5 waves down in a pretty nasty C wave into the buy zones as shown
BUY into new highs …
Cheers – Bart
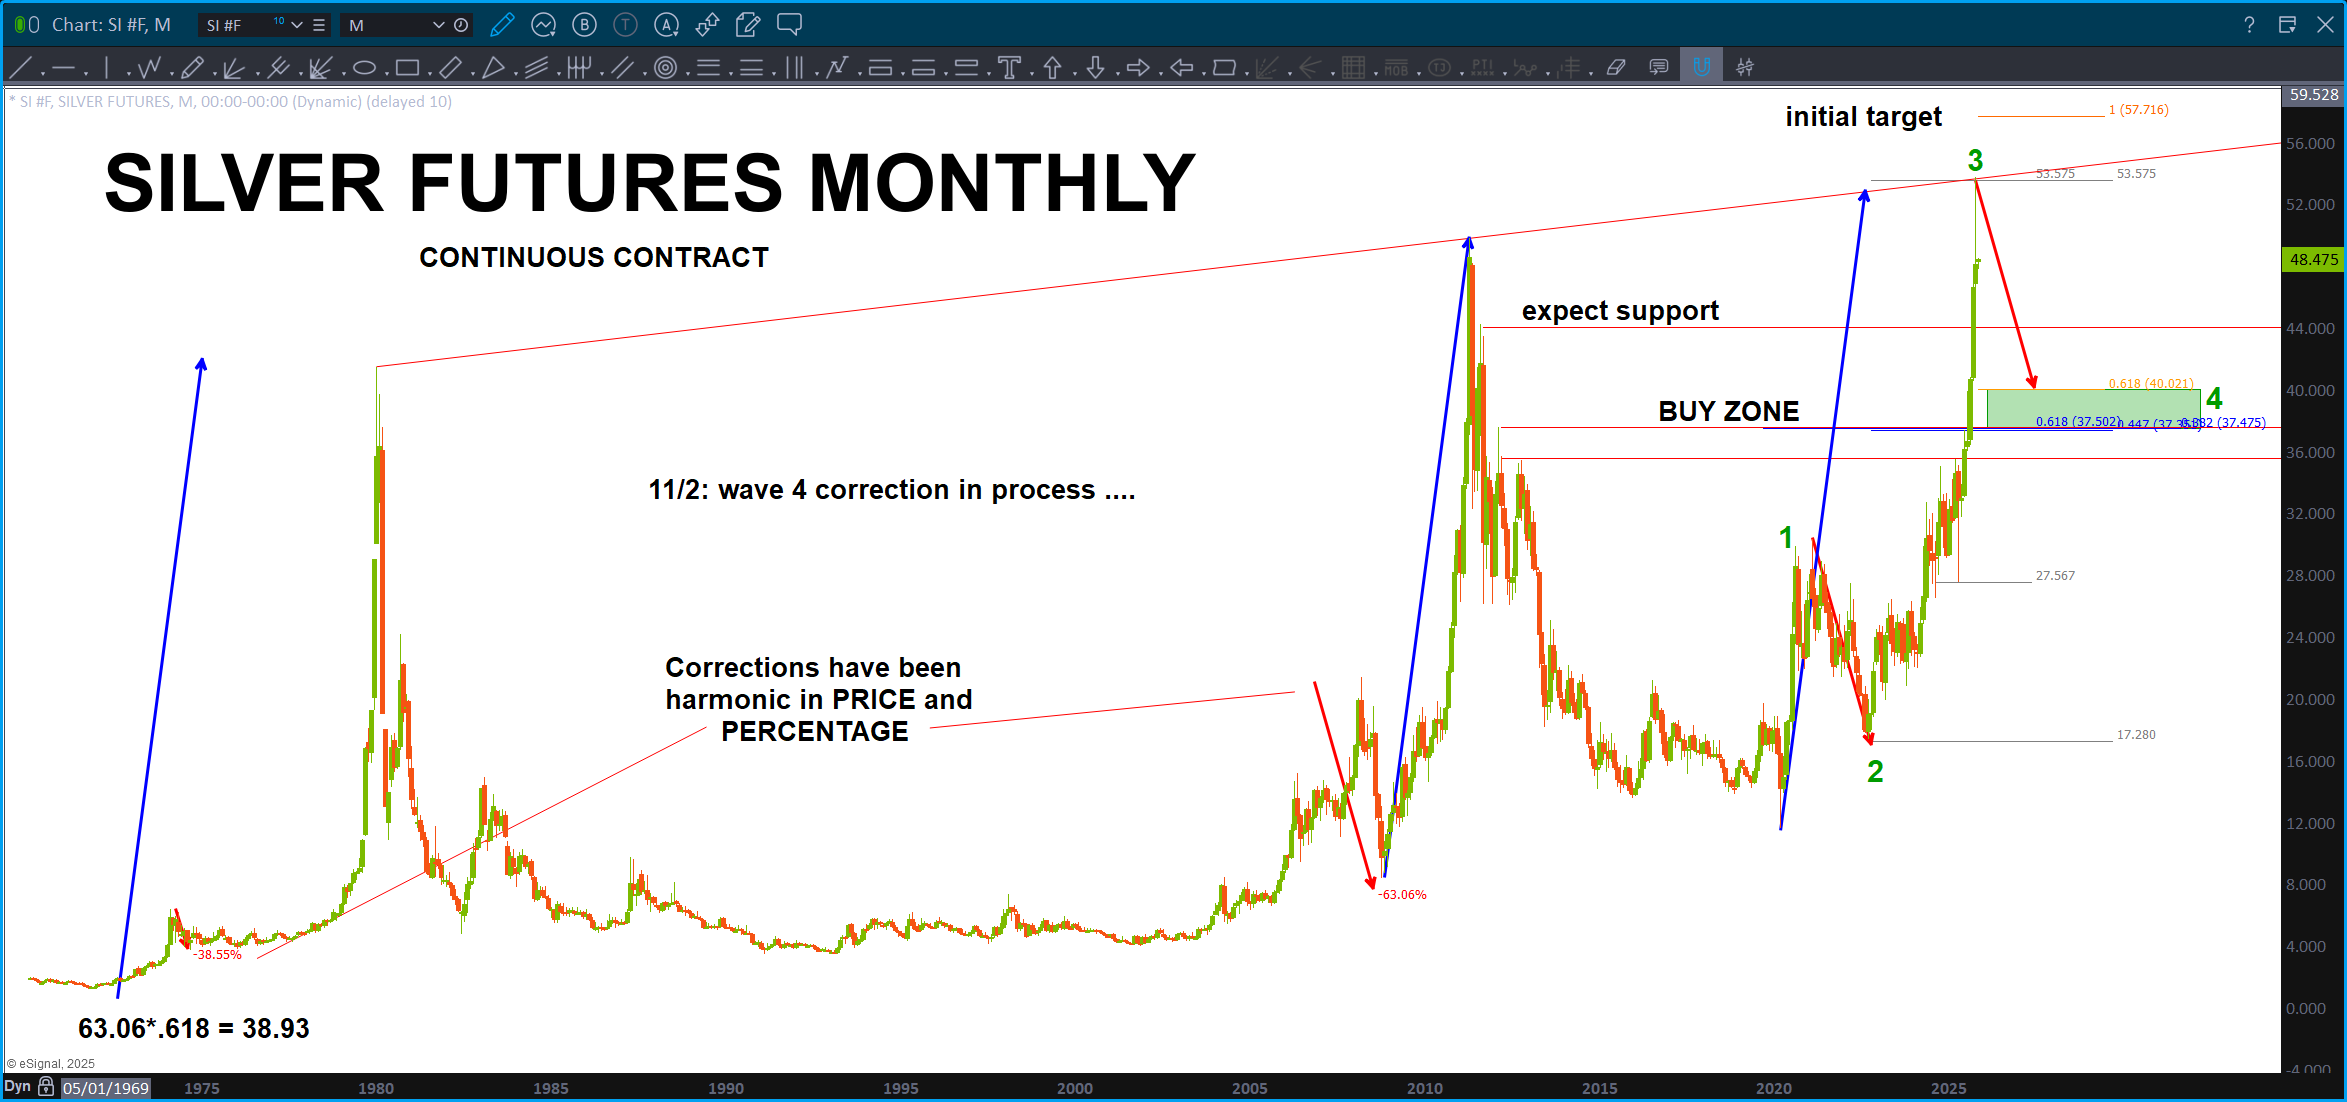
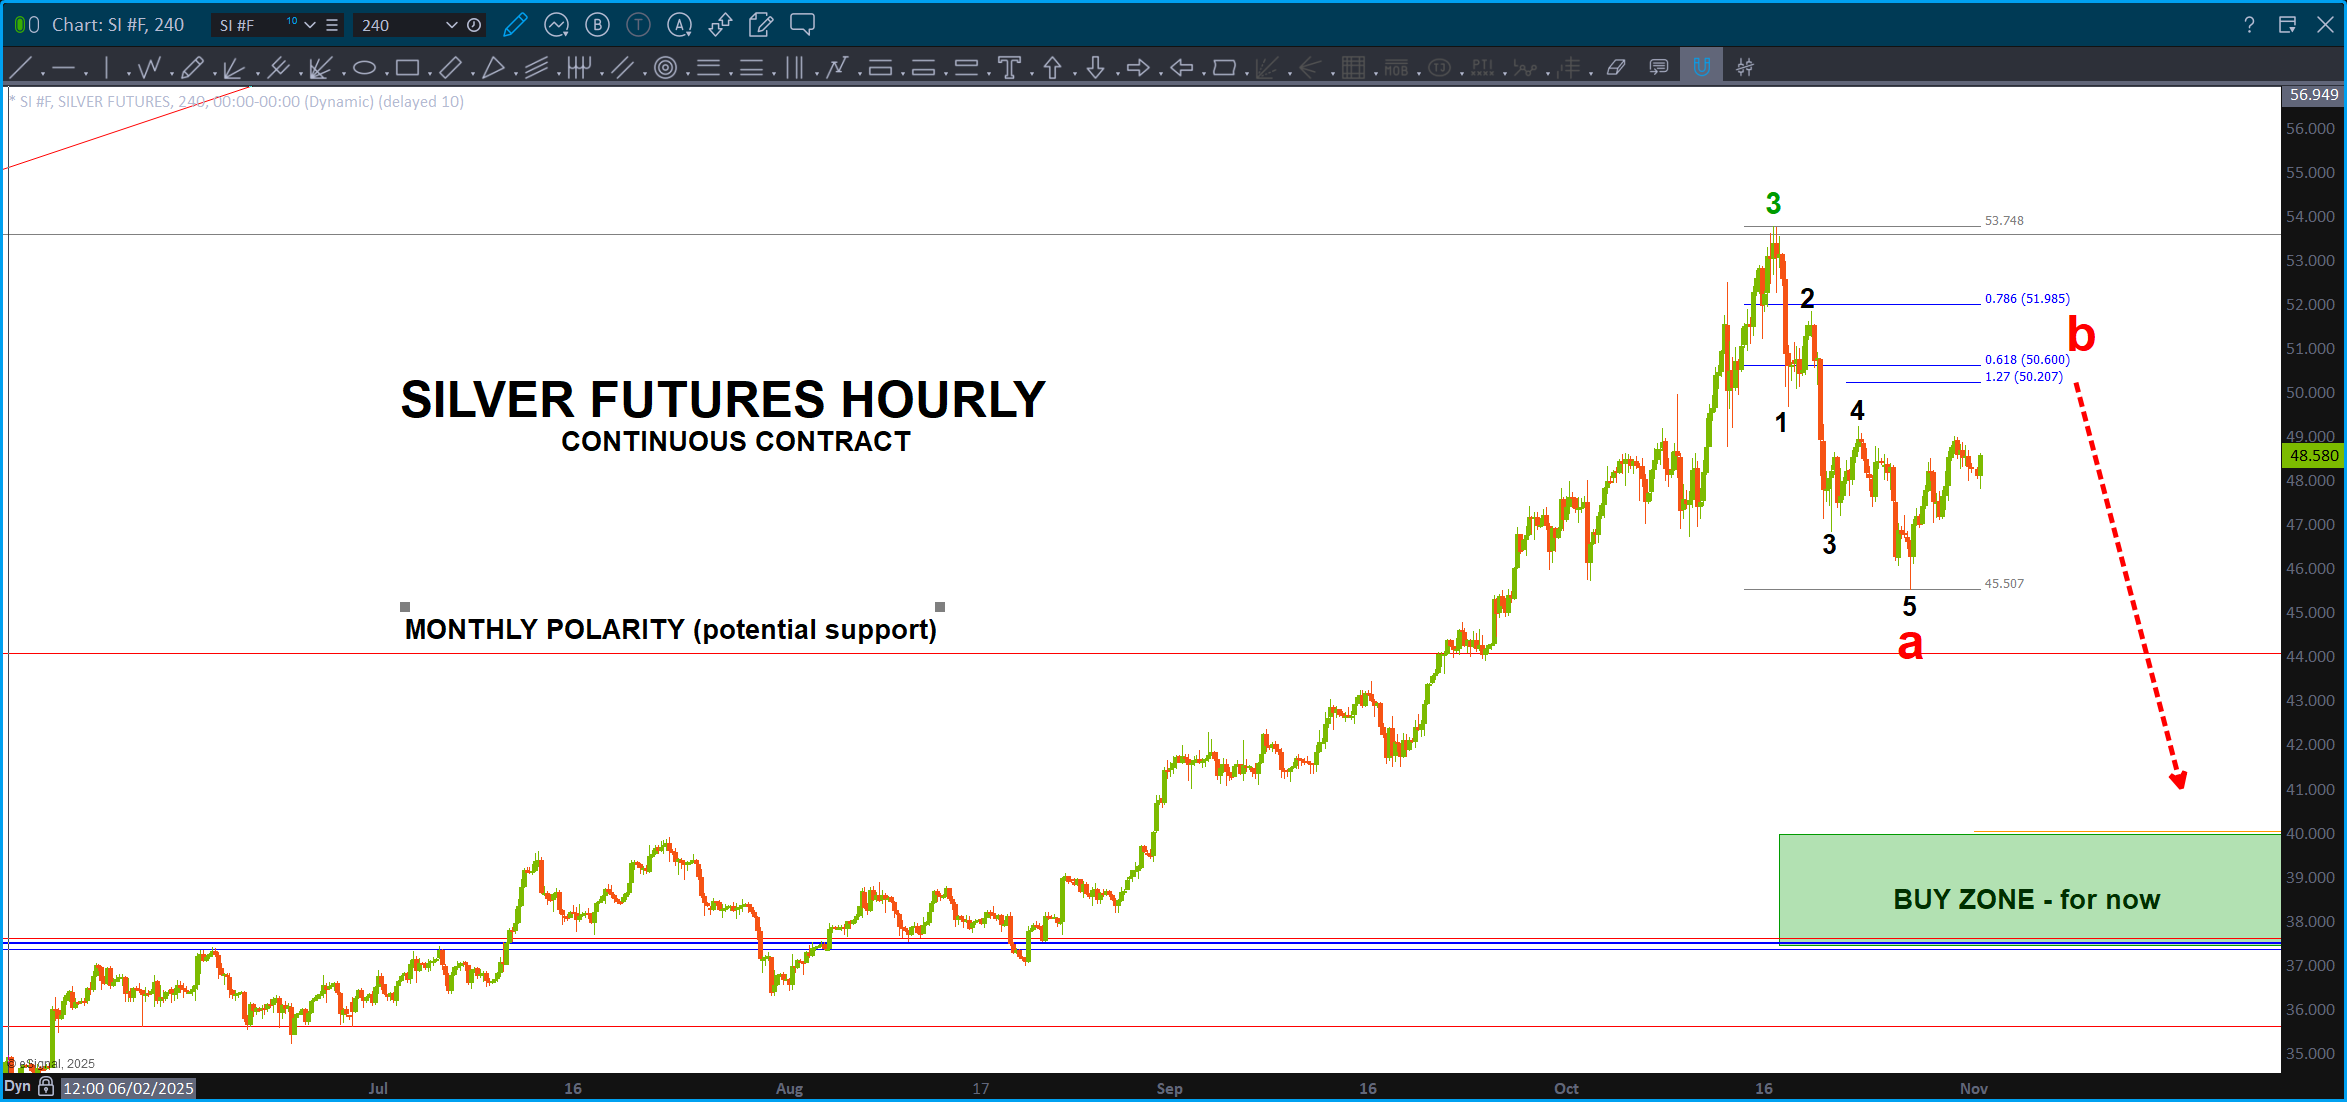
Homebuilders – May 12, 2026

This was an original post from almost 16 months ago – December 13, 2024. Wow, it has taken a while .. now, the news is all about the housing markets. What a lag … anyway, we have a near perfect BUY pattern on the Homebuilders ETF XHB so IF the homebuilders fail at this level then, its probable we have a housing correction coming.
See how patterns work … ?
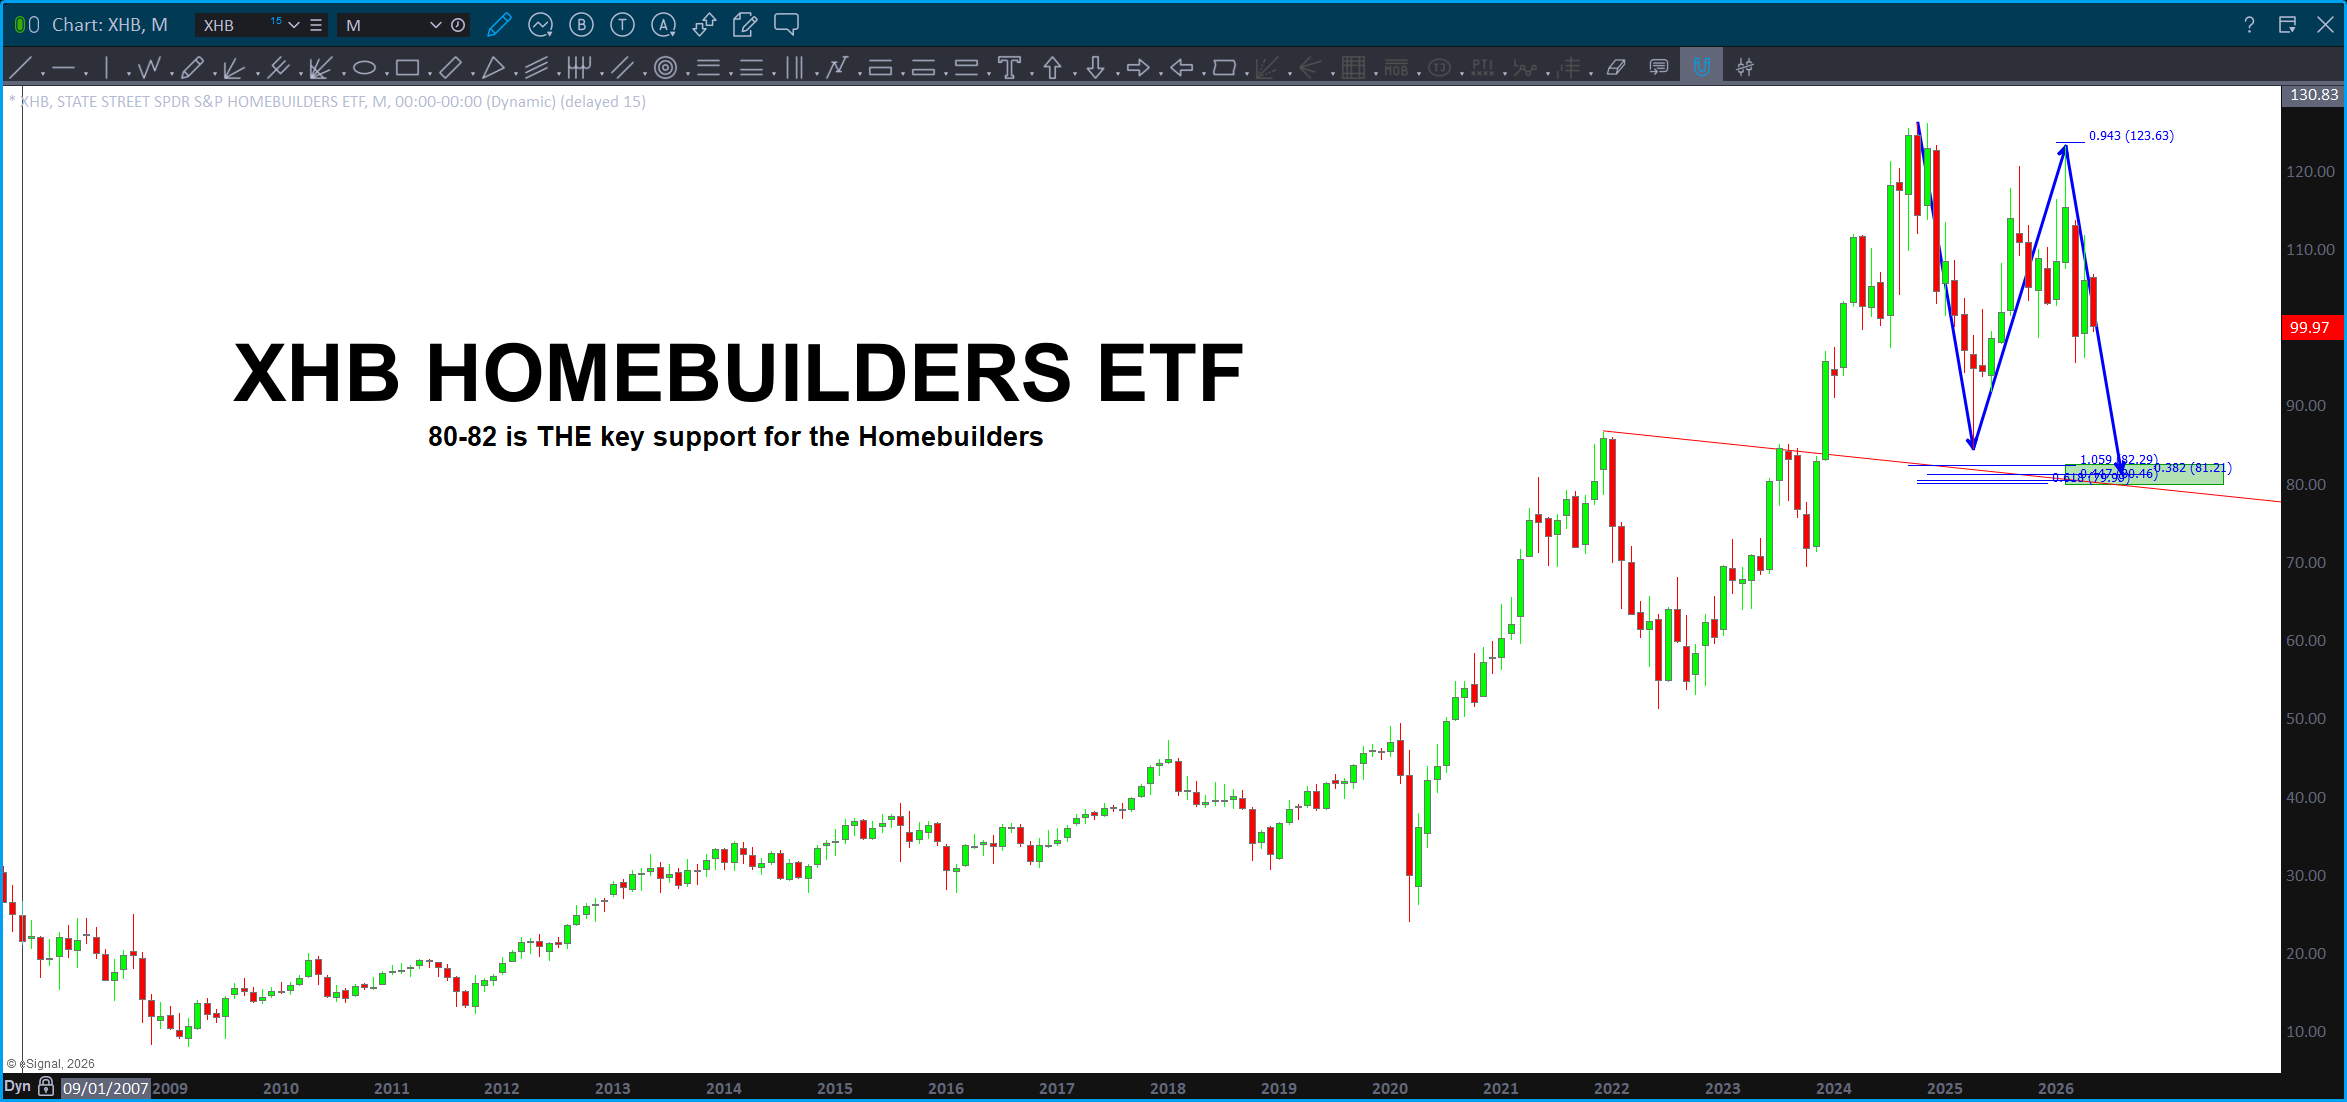
Homebuilders – December 13, 2024
First, happy birthday to my wife …! She’s the bomb!
Second, certainly looks like the XHB has topped or is topping for now …
Got into a little trance doing this one …
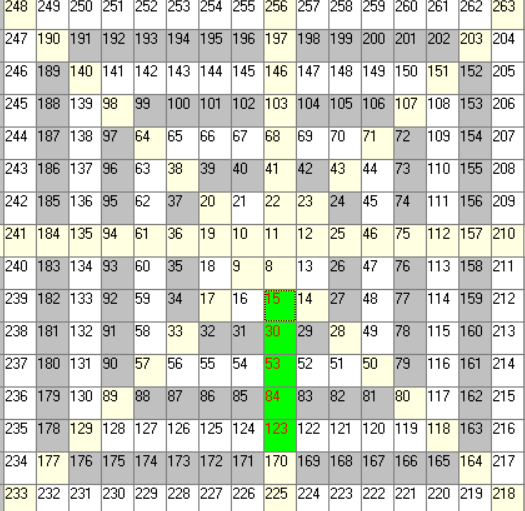
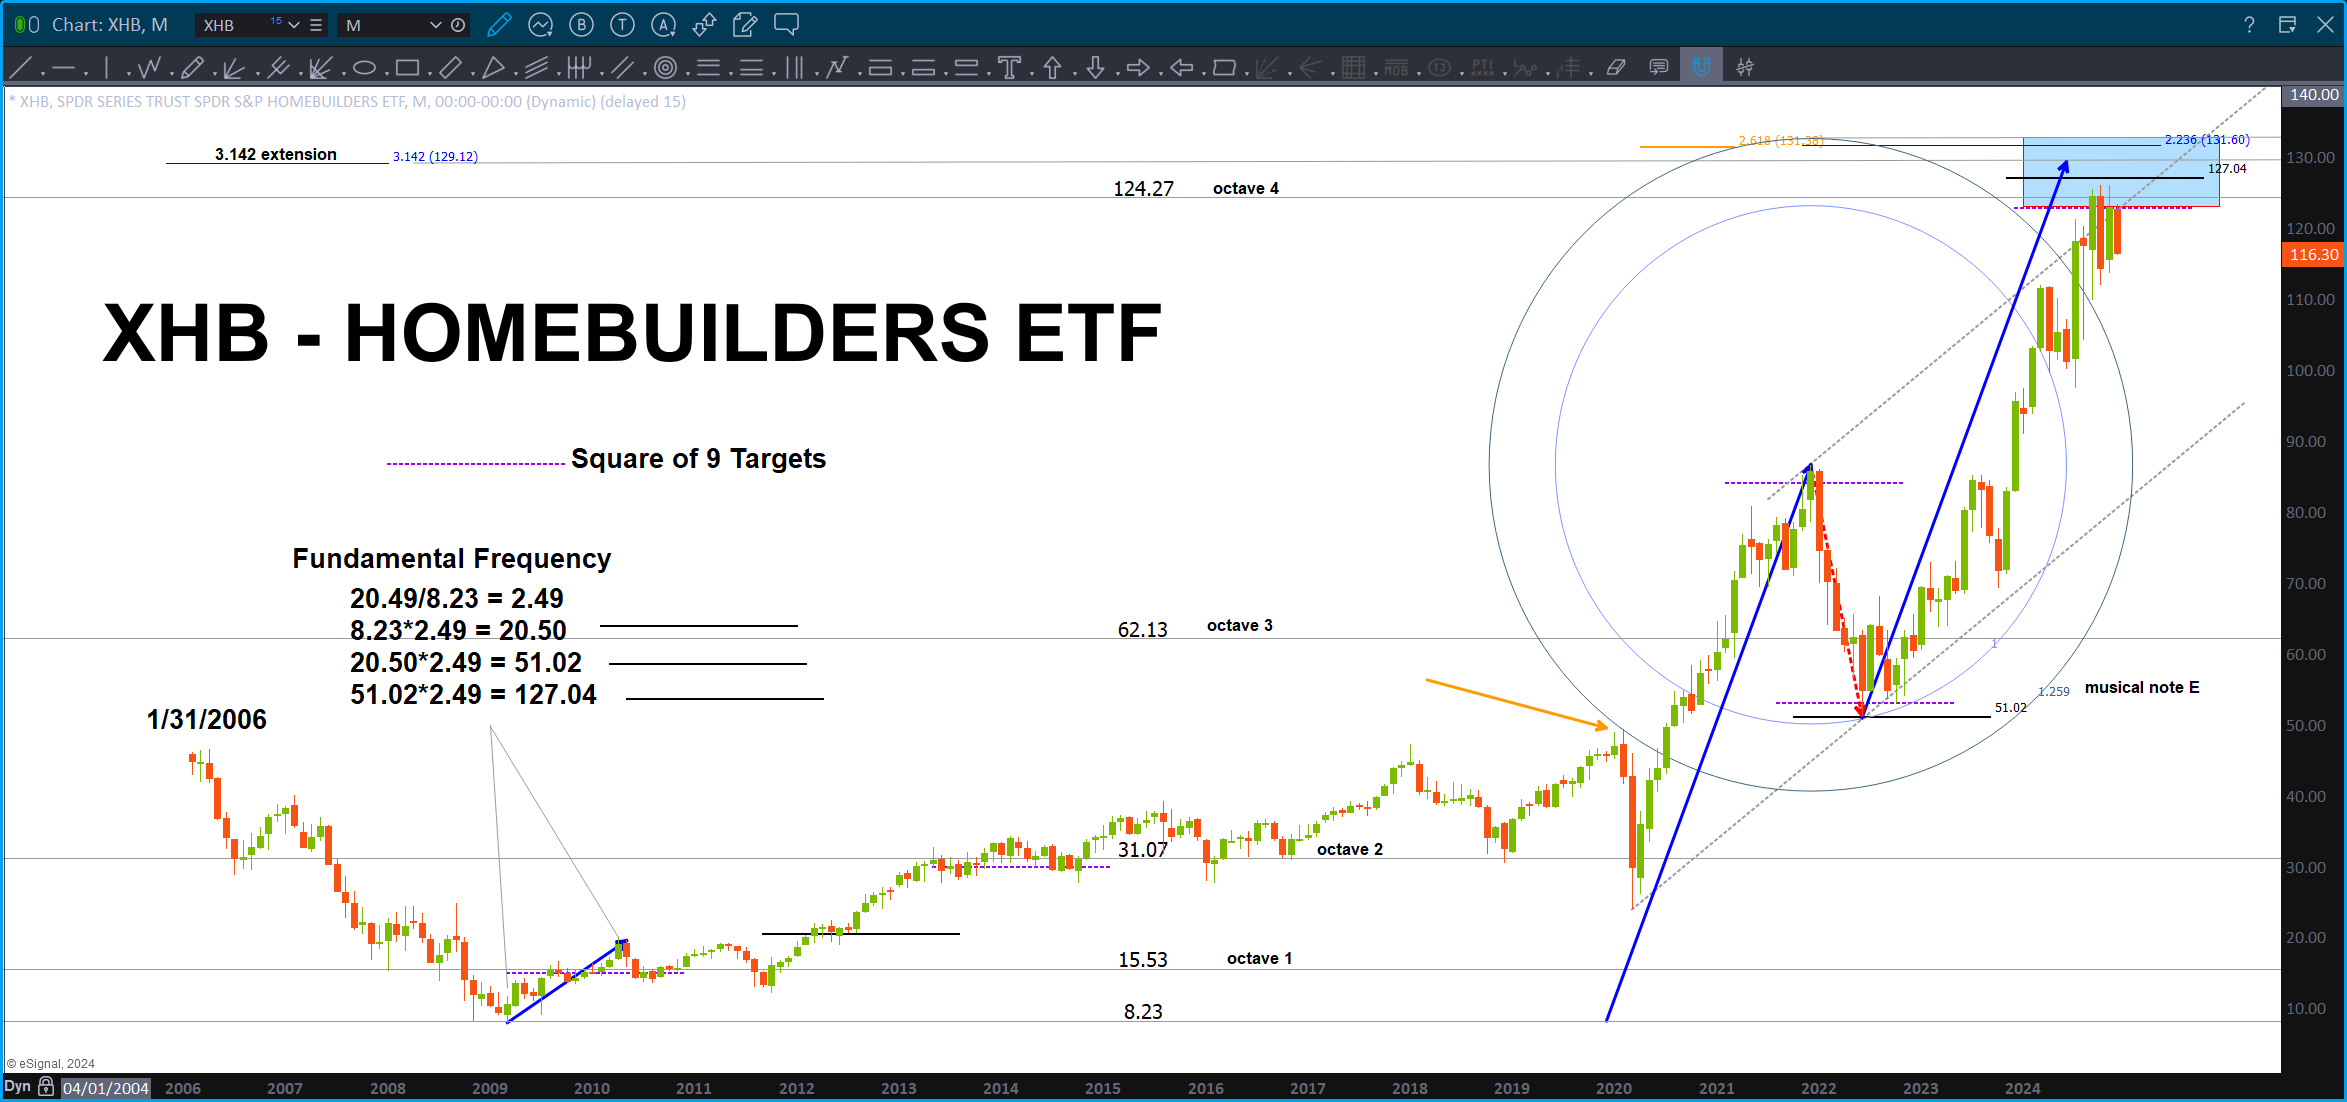
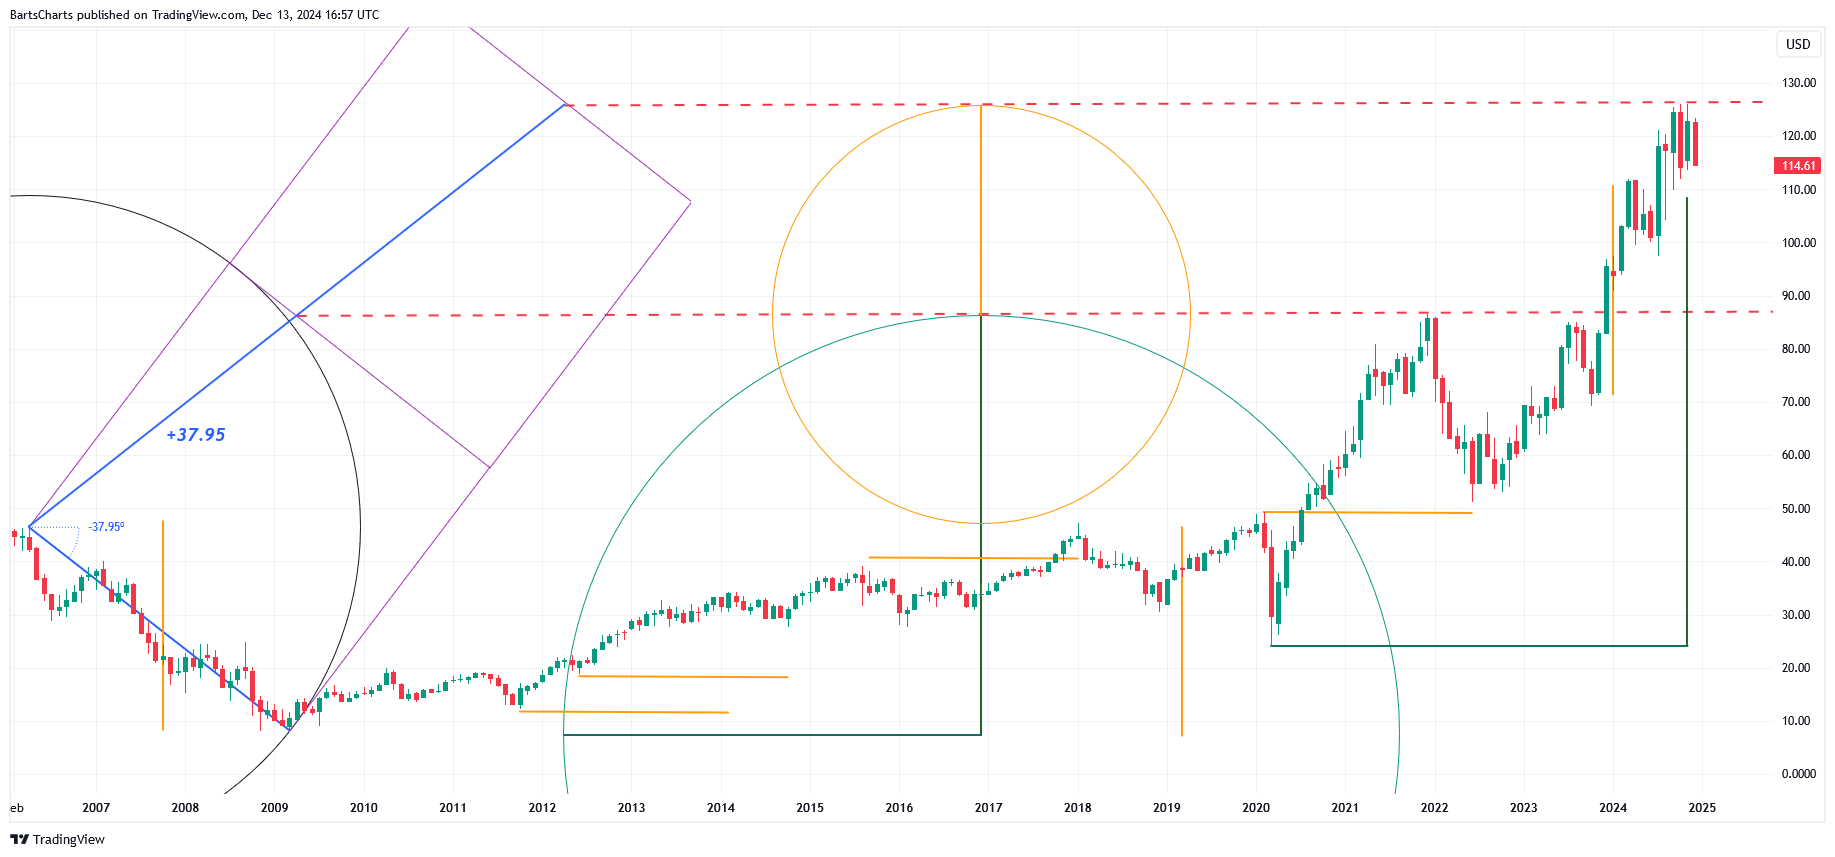
Wheat – July 15, 2026

Original Post – November 27, 2023
Well, unfortunately, I made a rookie mistake because w/ all the measured moves – just below – I should have thrown up a 0.886 retracement level. I didn’t and missed a Wheat entry. I’m already long DBA …
Folks, I’m thinking we are going to have one hell of a price increase in the cost of goods coming up … we do have a perfect storm approaching from the perspective of:
and of course:
this super cycle was already starting and then the big wave:
the fertilizer issues w/ the Straits is gonna be huge …
So, get long the ‘softs’ w/in agriculture … grab an etf like DBA (I’m long DBA already) or WEAT or just google it but, yeah, you can mess around w/ technology or take the tried and true method of catching a nice commodity wave because when they come and you can get in early, they can take you for one hell of a ride. That’s why I love to get in the wave using my SUP – we get in early. We get that primordial wave feeling of riding the echoes of the big bang thru the medium of a surfboard and water and it’s a blast! I’m feeling this one peeps and have already caught this wave WAY outside and I love to grab a party wave with my ex-girlfriend (wife) or son so you might want to jump aboard this wave.
Ding ding commodities departing …

Corn here … or perhaps a little lower?

Let’s ride this wave …

Cheerio –
Bart


________________________________________________________________________________________________________________________________________________________________________________________________________________________________________________________________________
As I continue to track wheat we can see where more “measured moves” and projection PATTERNS are creating a very powerful BUY zone for wheat. That being said, it’s still a pretty far down there so patience is the key.
I hawked the DBA ETF (https://g.co/finance/DBA:NYSEARCA) for 2 years and got in prety much close to the low and am still in it long. So, if you go research it, you will find Wheat being a major commodity component in it’s weighting.
Would be “nice” to see DBA bottom down at that pattern level and Wheat to be at/around the the zone shown below for a GREAT BUY ….
I patiently wait and hawk and occasionally take a look at to see if my thesis is true OR I have to get out the earser and relook at the chart w/ a refresh pair of eyes.