Gold
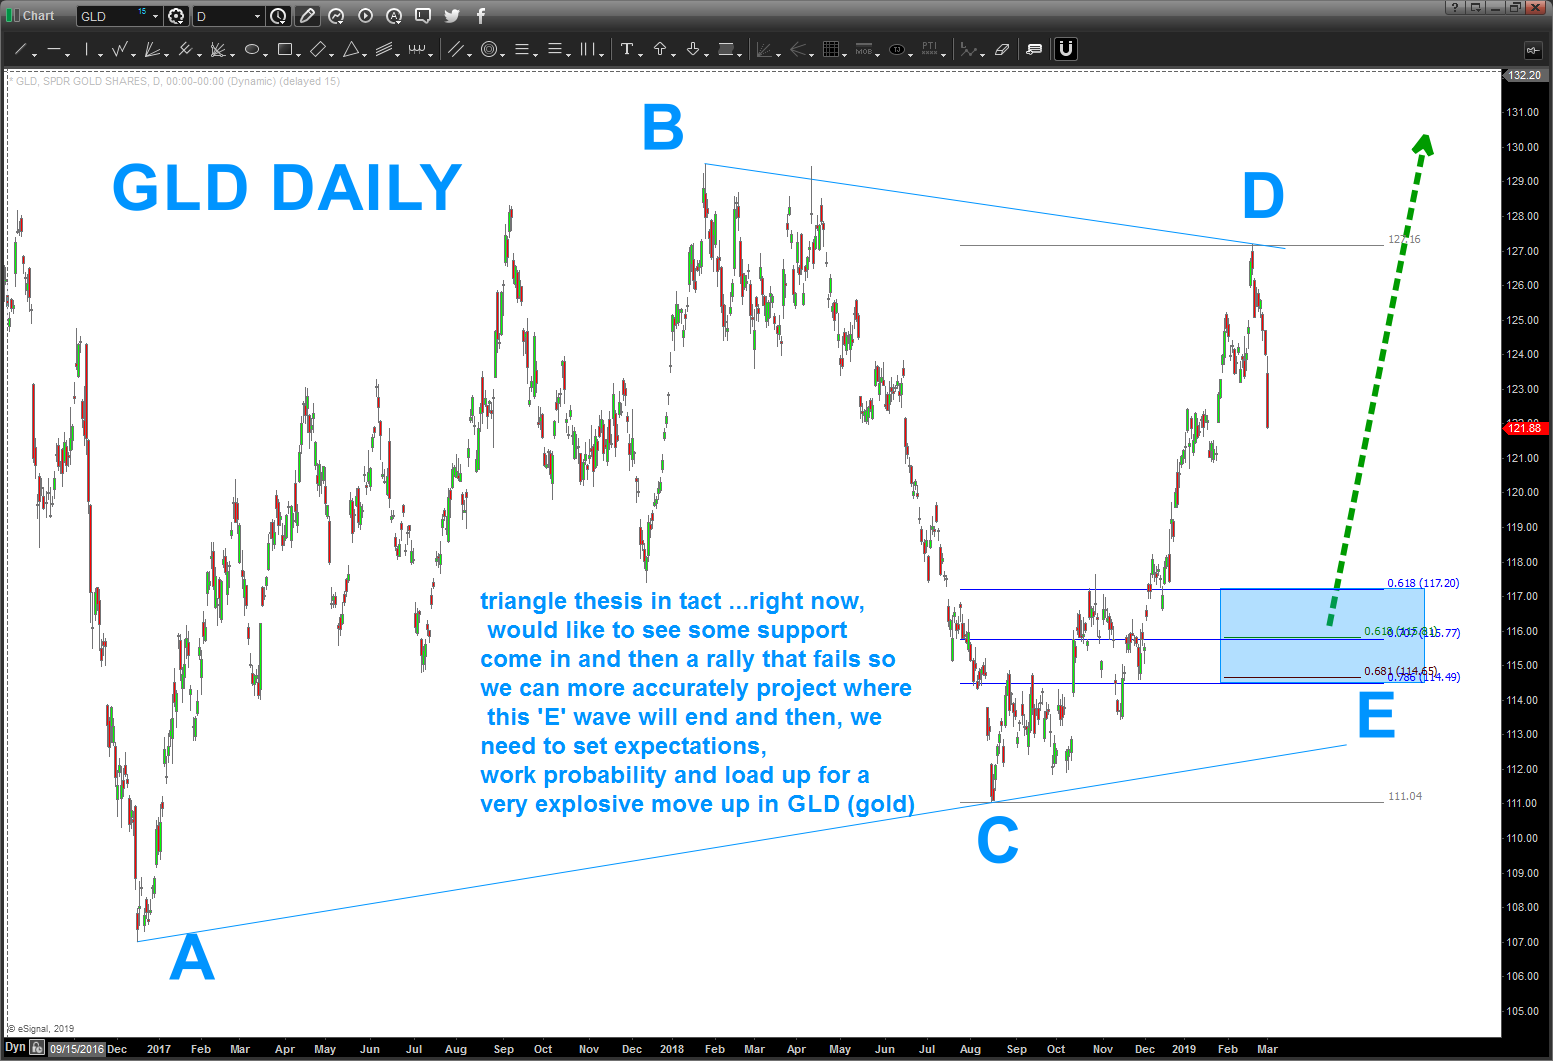
have been pretty silent about gold as it has gone up and down and up and down again and again … and, most recently, it’s started back down. folks, this is a complicated correction in Gold. And, mind you, its just that – a CORRECTION in a multi year down trend. here’s the thesis – we are the last wave of a contracting triangle which will then cause a very very strong move to the upside .. but, for now, I believe that will end a C wave and the a-b (triangle) – c correction will be over and another leg down in Gold will begin. now, mind you – this is going to all take months or a year or so to complete but it’s the best interpretation that I can think of, for now … so, near term, if your bullish (which I am near term and am already long) get ready to BUY gold once this ‘e’ leg of the a-b-c-d-e triangle is complete.

Hey Bart,
It is a funny thing with the charts for the precious metals. We can never be sure if a certain move is the C phase or the D phase, etc. until after the fact. Hindsight is 20-20. My point is charting as a forecasting tool has serious limitations.
Per my take on the charts, silver will lift off in about 10 – 15 years from now. The only trouble for me is that I may not be alive to see it.