Math we like … EUR vs JPY
believe it or not, I learned to trade as a SPOT Fx dude ..no kidding. No stocks, no futures, no ETF’s out of the Navy I jumped right into the INSANE world of SPOT FX …
I still trade the SPOT MARKET … I’ll check out the majors, then the crosses and see what’s the scoop. no kidding, I once heard that ALL the world bonds and commodities and stock markets would have to operate for 90 days non-stop to match the liquidity of ONE DAY on the Currency Market. YEW …
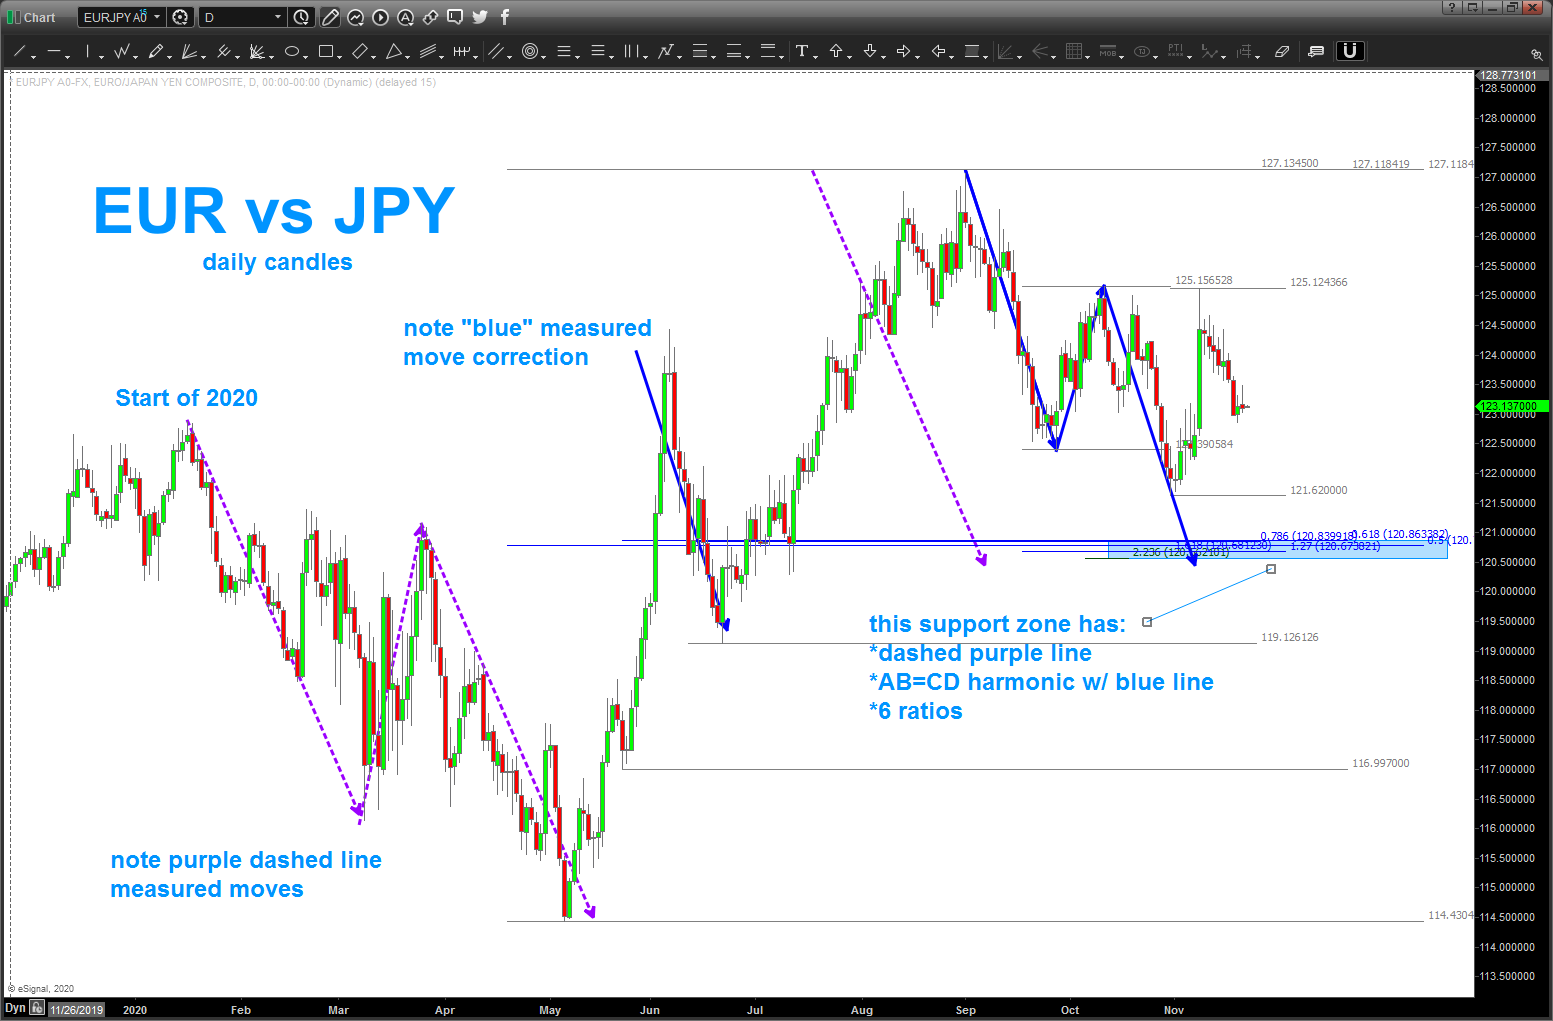
in this case we have a currency pair as the EURO vs the Japanese Yen. chart goes up the Euro is stronger. chart goes down the Yen (versus the Euro) is stronger … it’s as simple as that.
I’m cruising the charts waiting to get locked down in CA and saw a neat chart to my eye. I just started working this chart and …boooooom … we find a level as depicted.
Let’s make this easy, when we have a LOT of math in a really TIGHT area we HAVE to take a swing at the bat … now, that being said, that is some nice thrust from the 121.62 area but I think that last thrust up was the end of a flat correction. so the recent wave down, should (trust my count or not 🙂 not sure I do or I don’t to be honest 🙂 ) go to our targeted BUY ZONE. Say 120.50-121.
let me know if you have any questions on how the levels were derived …
oh, in the spot fx world, w/ SO MUCH math in one area, I usually give myself 30 pips below – max- for my stop out. w/ the liquidity of the FX and the math as shown, go down to a 1 minute chart for the entry .. seeing these levels hit, instantaneously watching the reaction and to think that w/ a home computer and some PATTERN work the entire world STOPPED selling EUR vs JPY and started BUYING EUR vs JPY. still amazes me … I’m always surprised to see this insane way to look at anything rational about the markets work from time to time ….
good weekend to you – Bart