Markets – April 27, 2026

BLUF: I am still in a defensive mindset and will remain so until a SELL PATTERN is triggered on the XLP/NYA or the low that was made a few weeks ago is taken out to the downside.
The technology sector continues to launch into the upper limits of a historic run. My good friend, Larry P (www.tradingtutor.com) put out his weekly newsletter and yesterday he wrote:
“The Sox index has been up 18 days in a row. The odds of this
happening are over 300 to 1. The S&P 500 broke all records this
week by going up for 15 days in a row. That’s the most since
records began in 1897. In the last 126 years, it’s only happened
four times.”
He also put out this chart around the ‘expected’ cycles for the rest of the year:
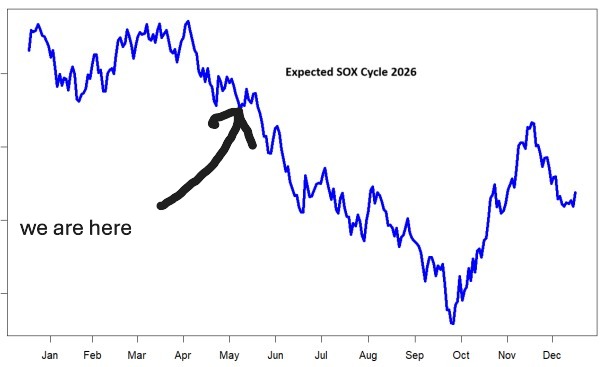
Here’s the expected cycle for the S&P 500:
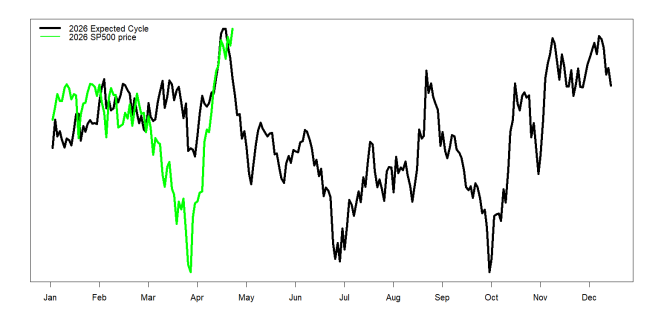
So, when we look at the NASDAQ what do we see:
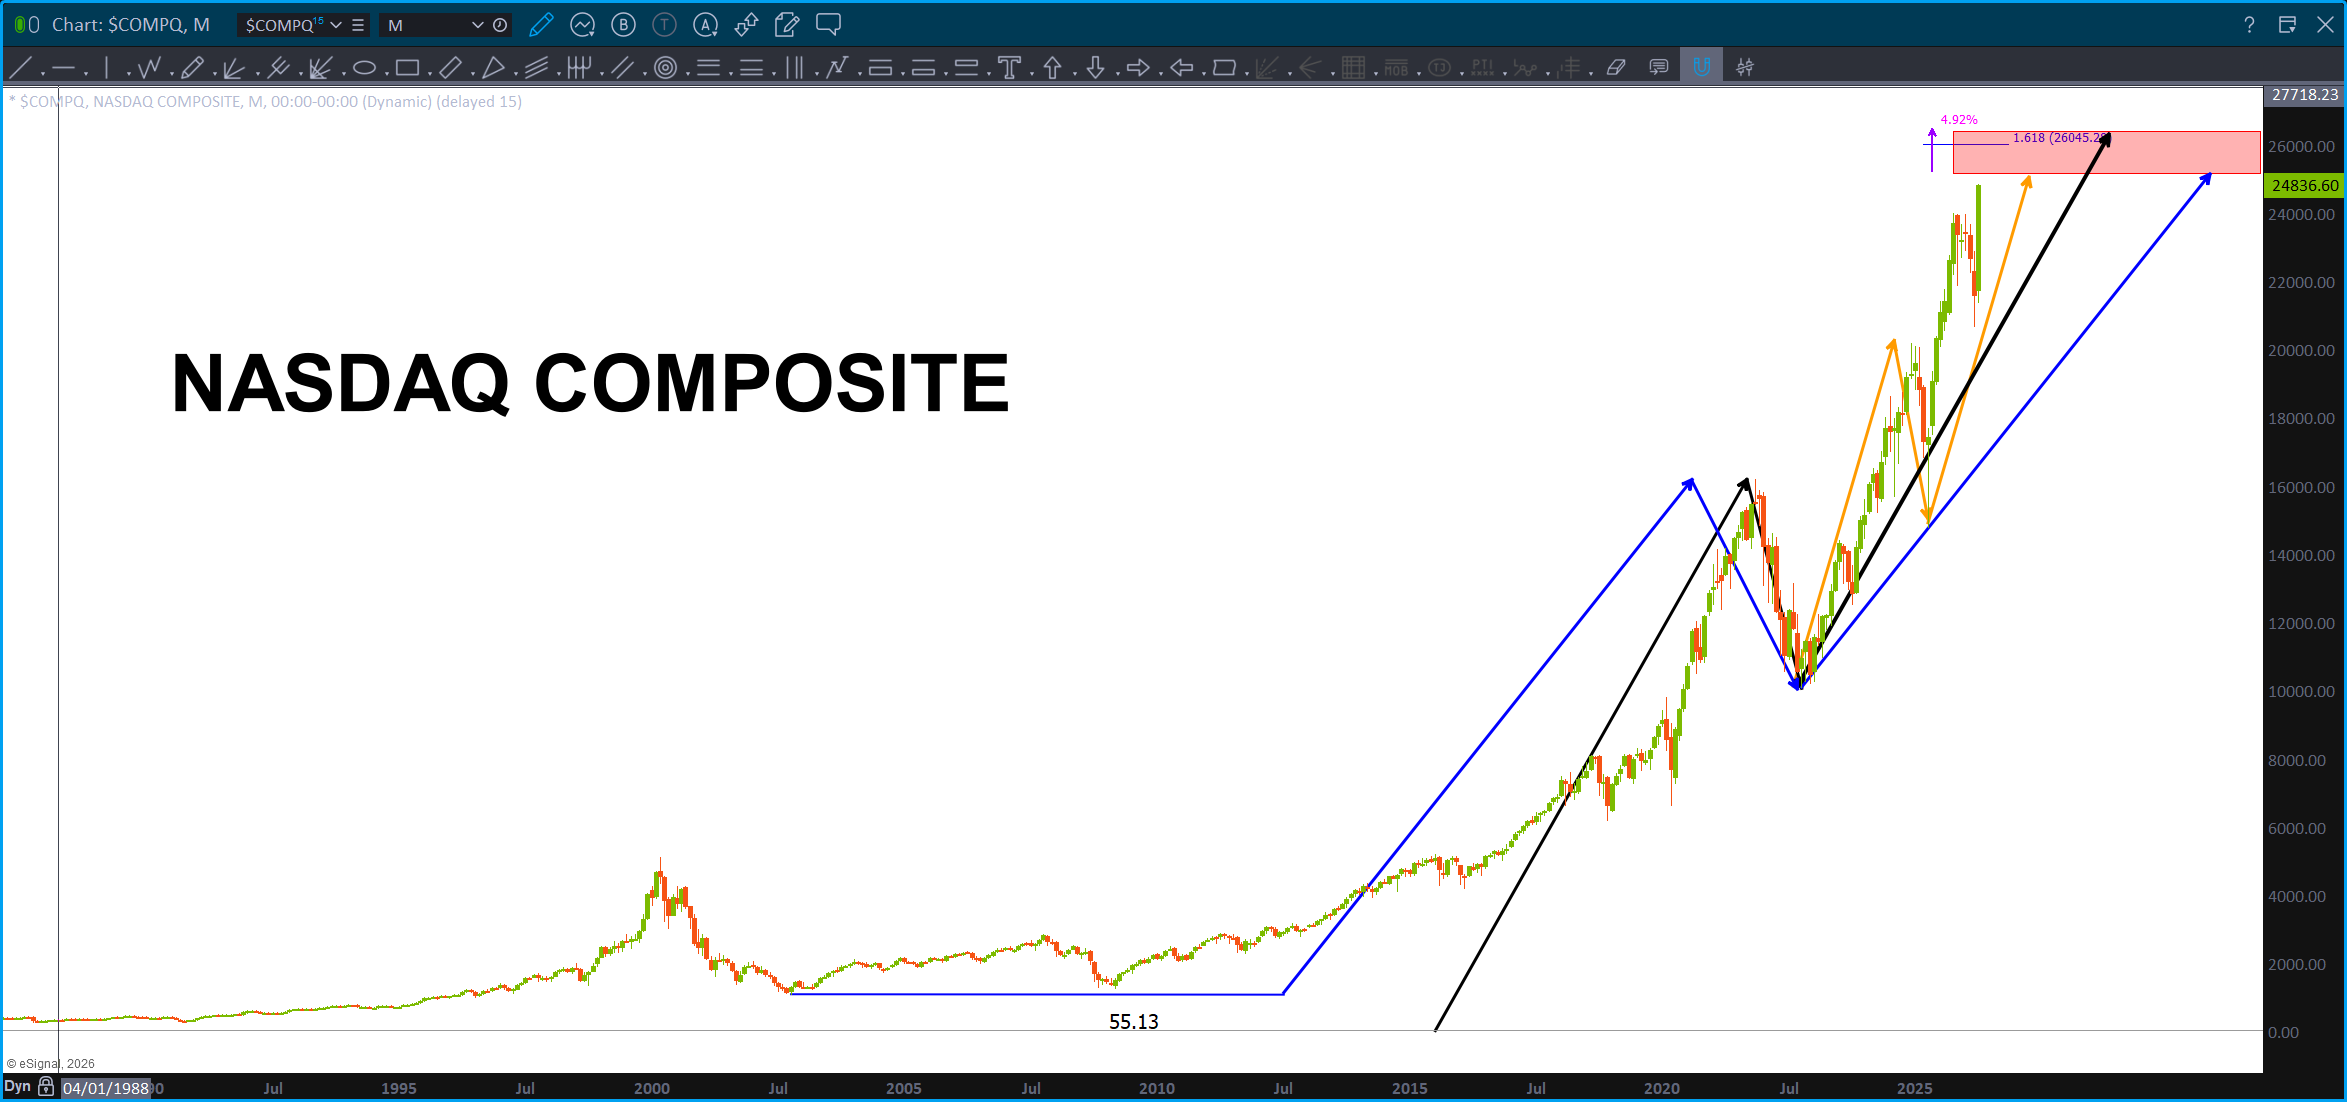
From the all time low in/around 55 we project w/ the ‘black’ line and we have a target zone just a little higher. Additionally, we project w/ the ‘orange’ line and the ‘blue’ line from the 2002 low we get the same target zone. The entire band is around 4% so w/ the cycle shown on the SemiConductor Index and the targets on the NASDAQ, I expect significant resistance.
Most of the targets derived have been resistance but nothing has stopped it for a big correction.
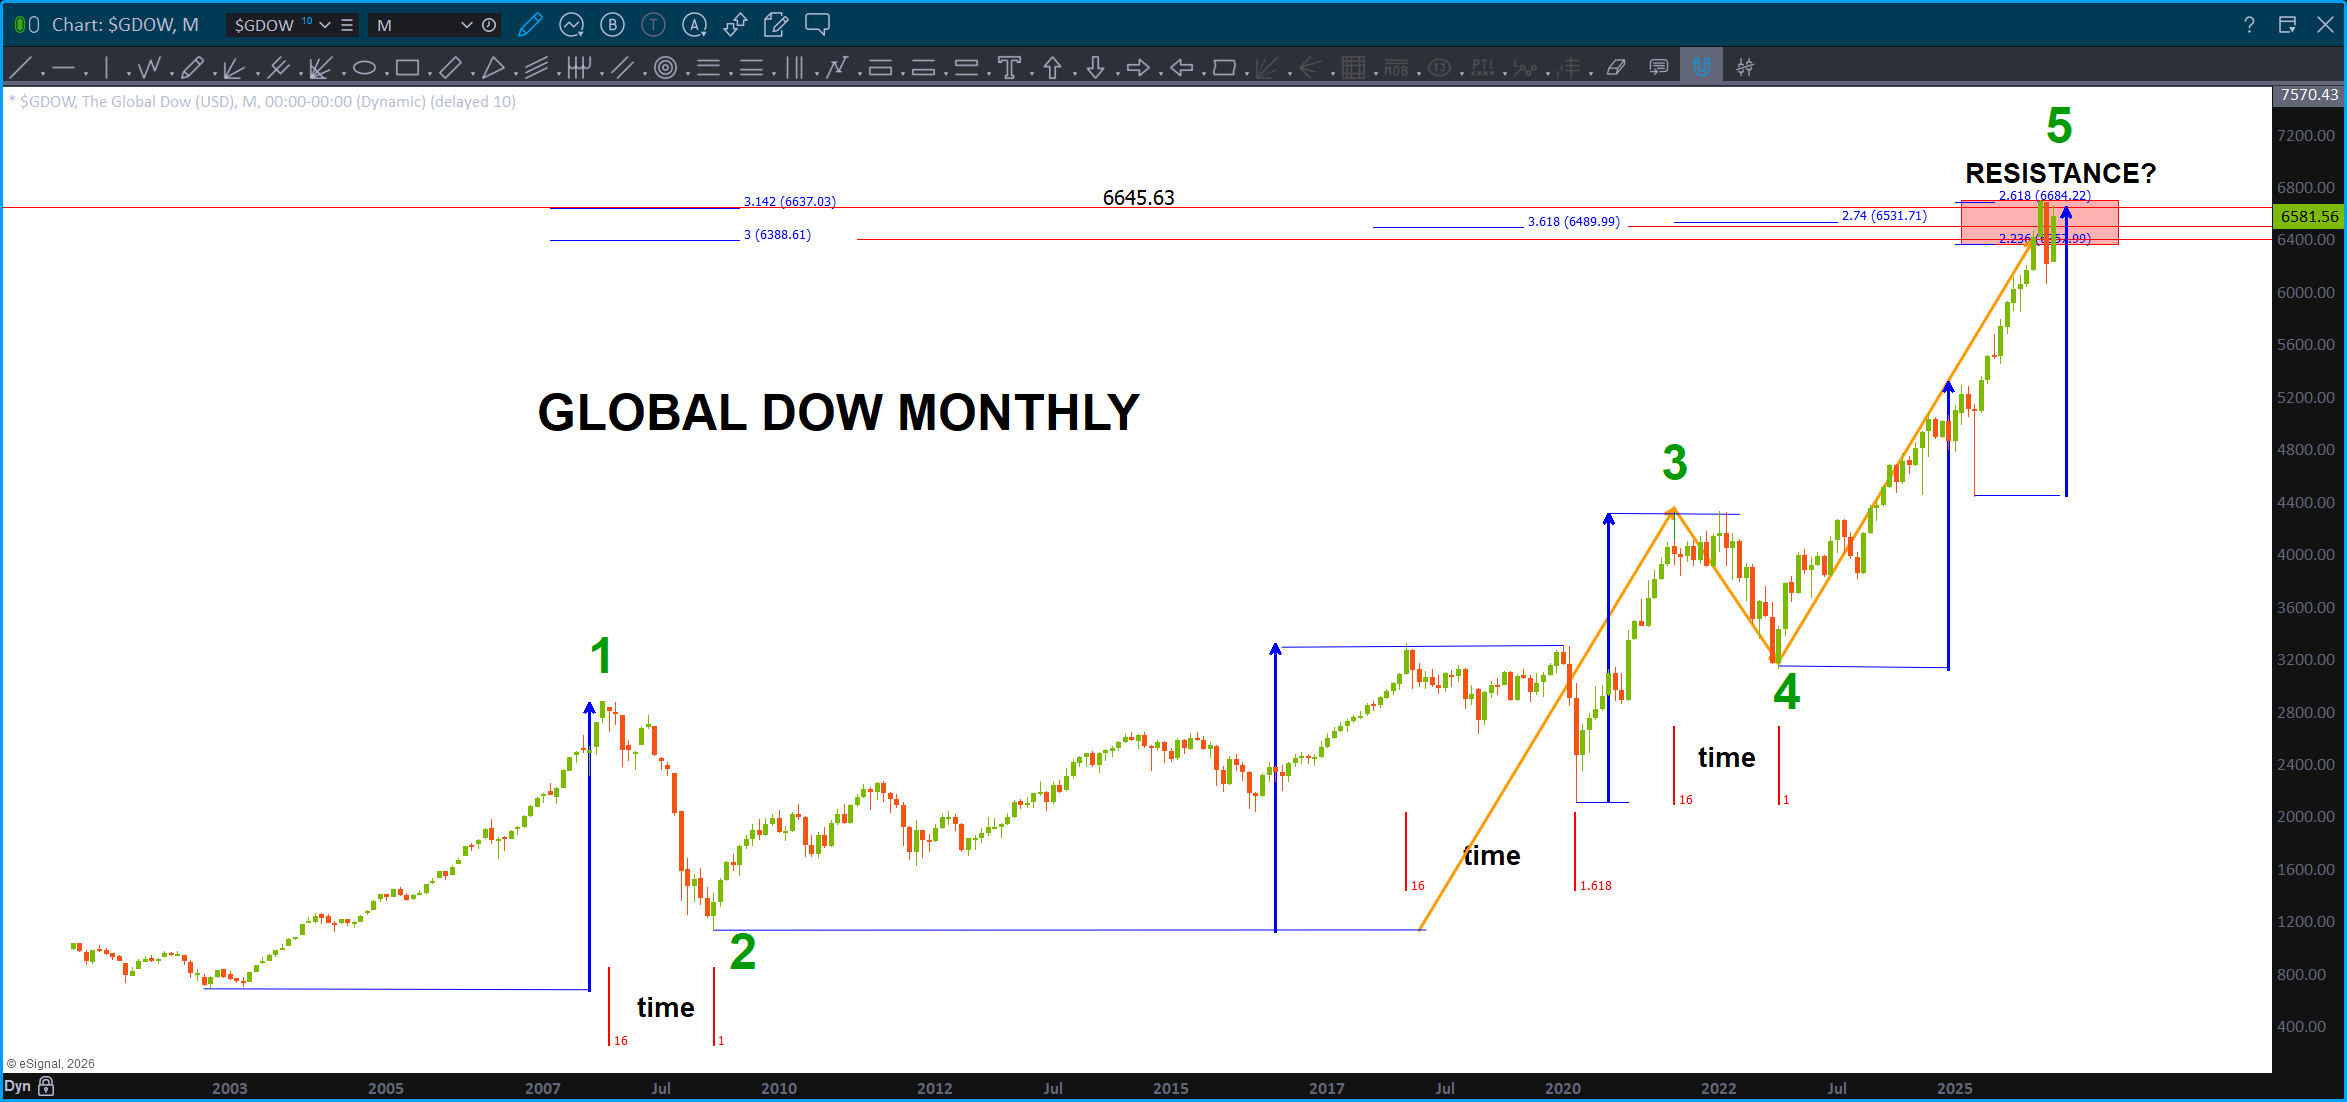
Above is the Global Dow … measured moves hit, perfectly. Take note, each time we have completed a measured move in PRICE (blue arrows) the market has corrected, at a minimum 16 months. Over a year folks …this has happened EVERY year for the past 25 years. If you look at the one measured move (between waves 4 and 5) you will see a very sharp correction after the initial top and then blast off into the latest resistance. Is this going to happen again? Believe we will see, soon.
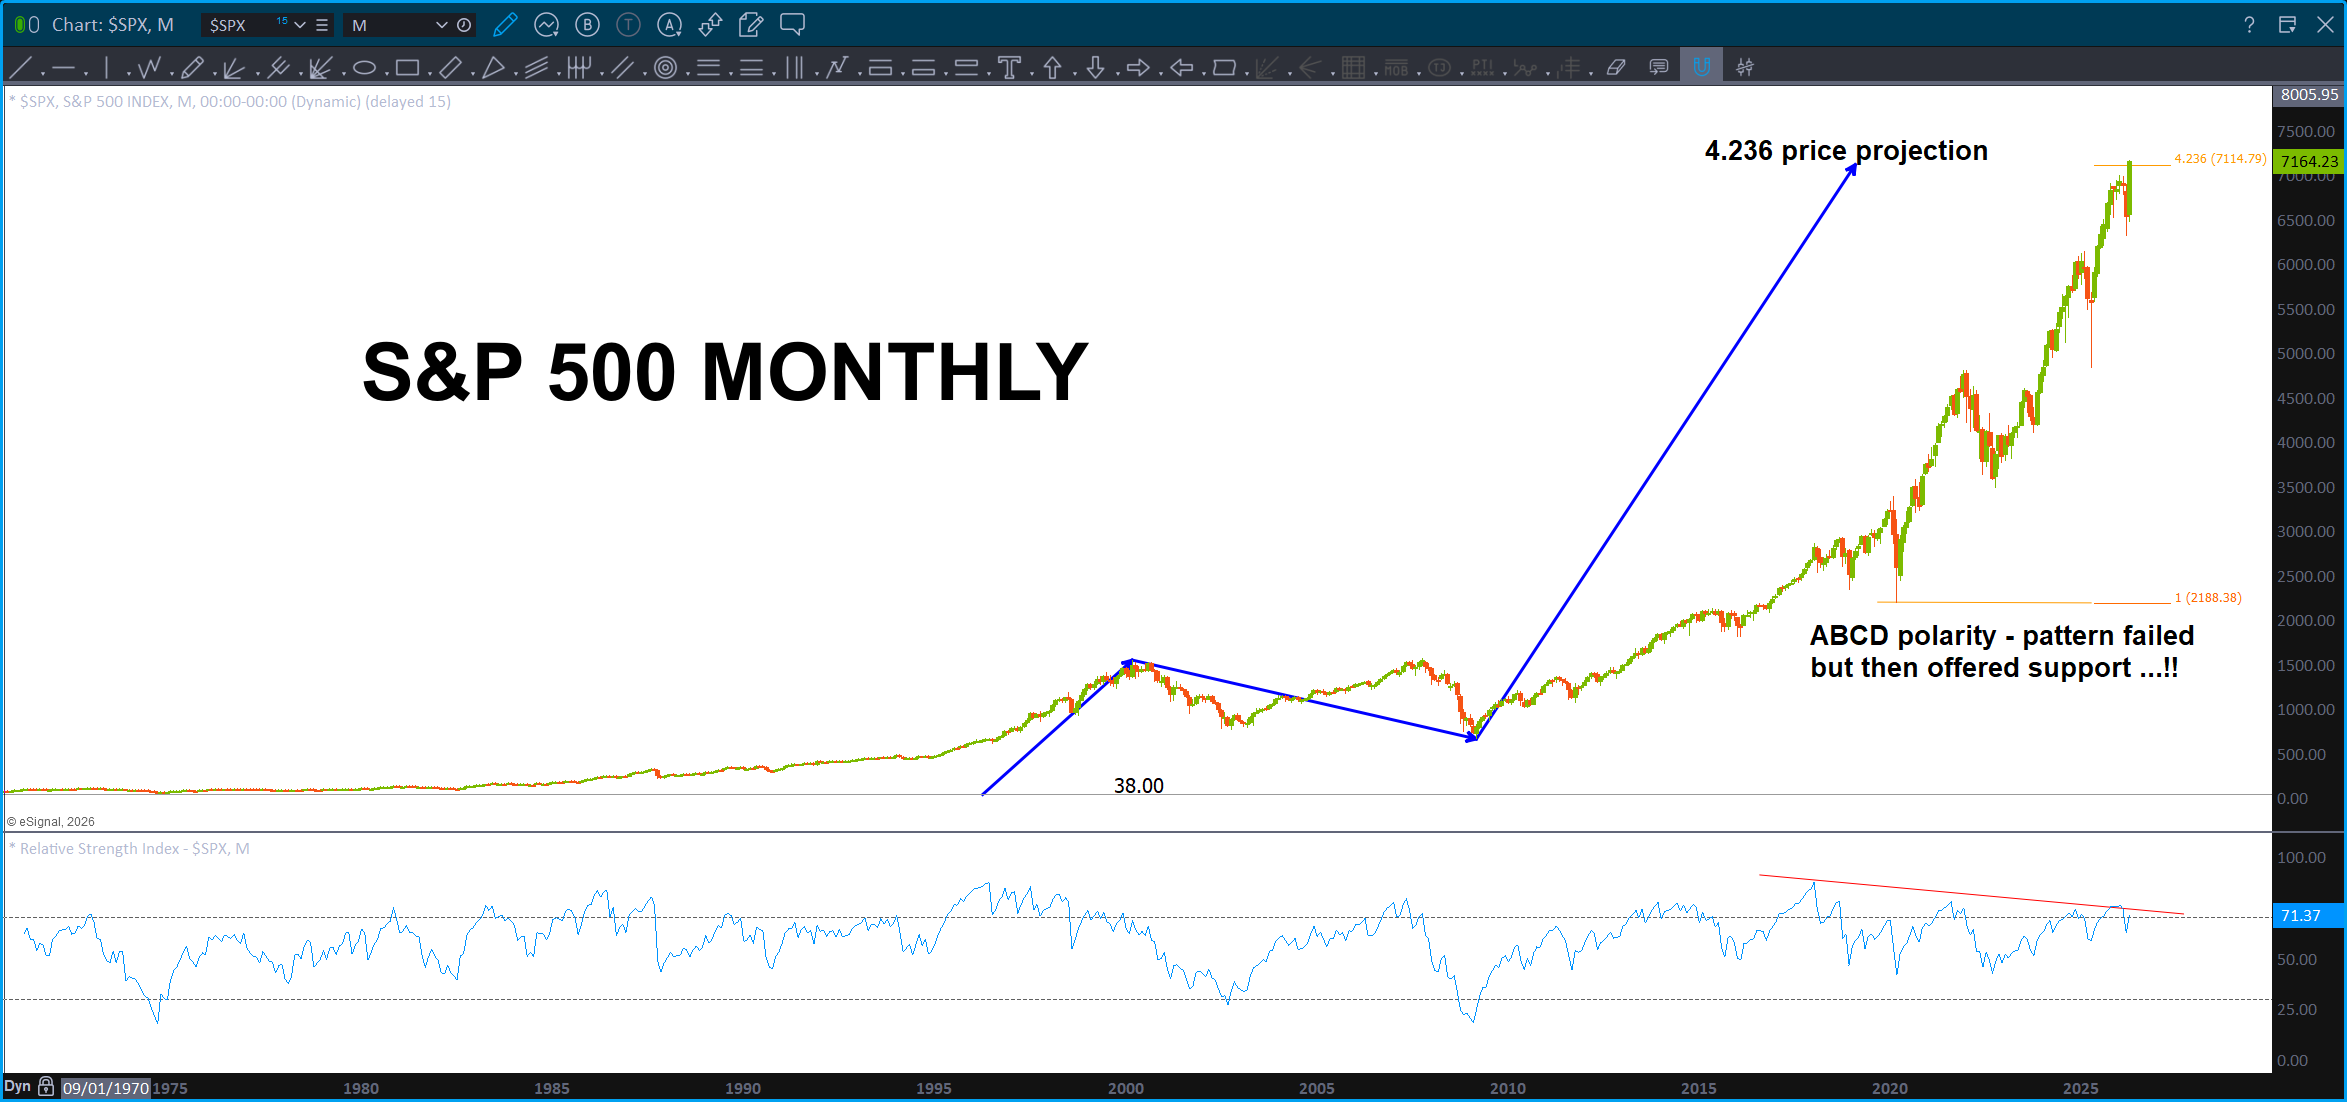
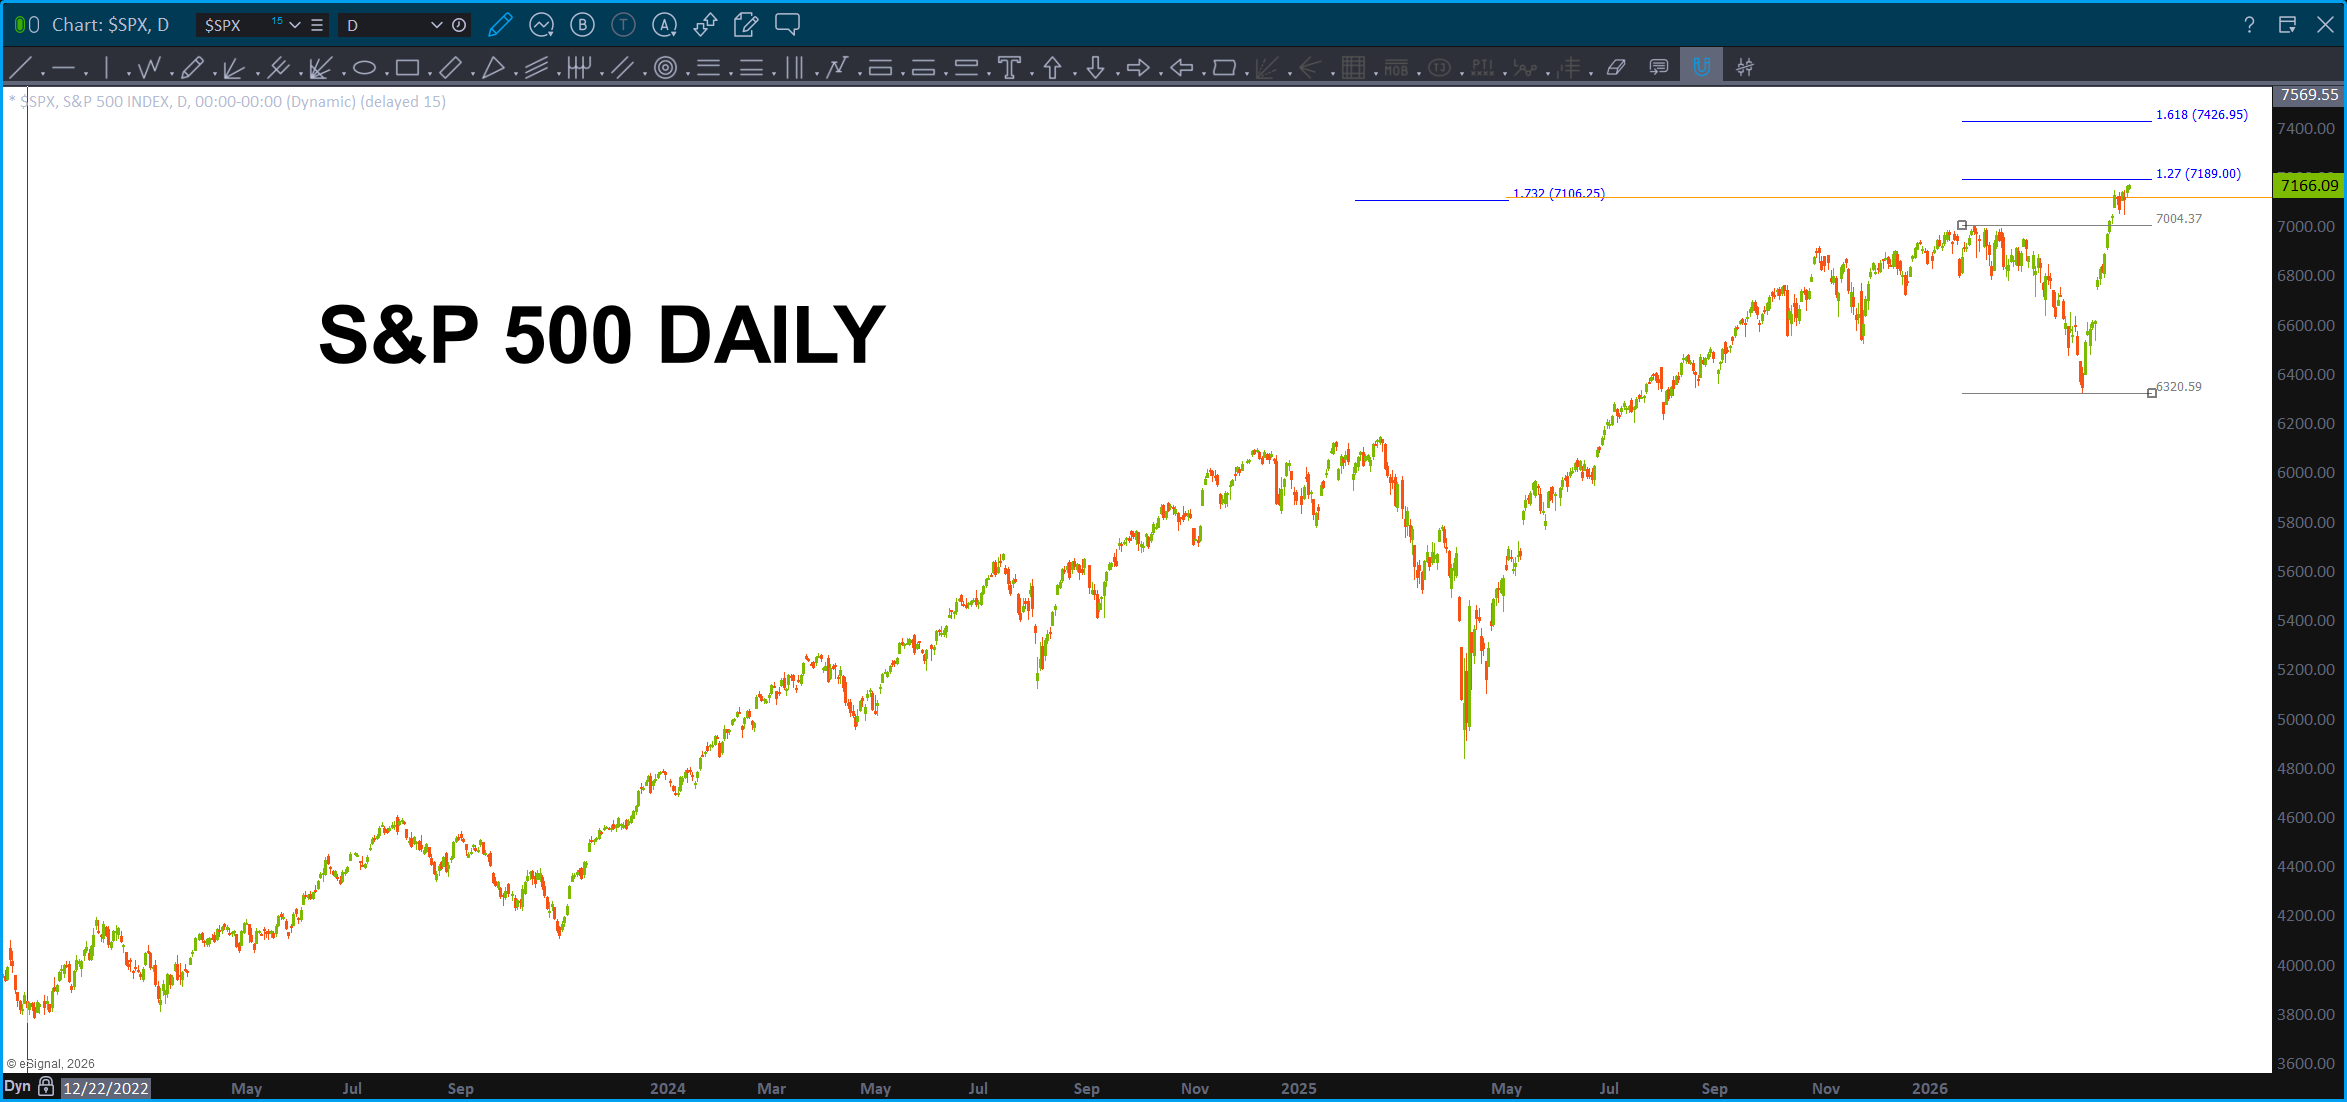
S&P 500, above, hitting 4.236 price projection from initial seed vector – all time low to high in 2007. Note, the gap left behind on the daily is, supposedly, one of the largest gaps ever.
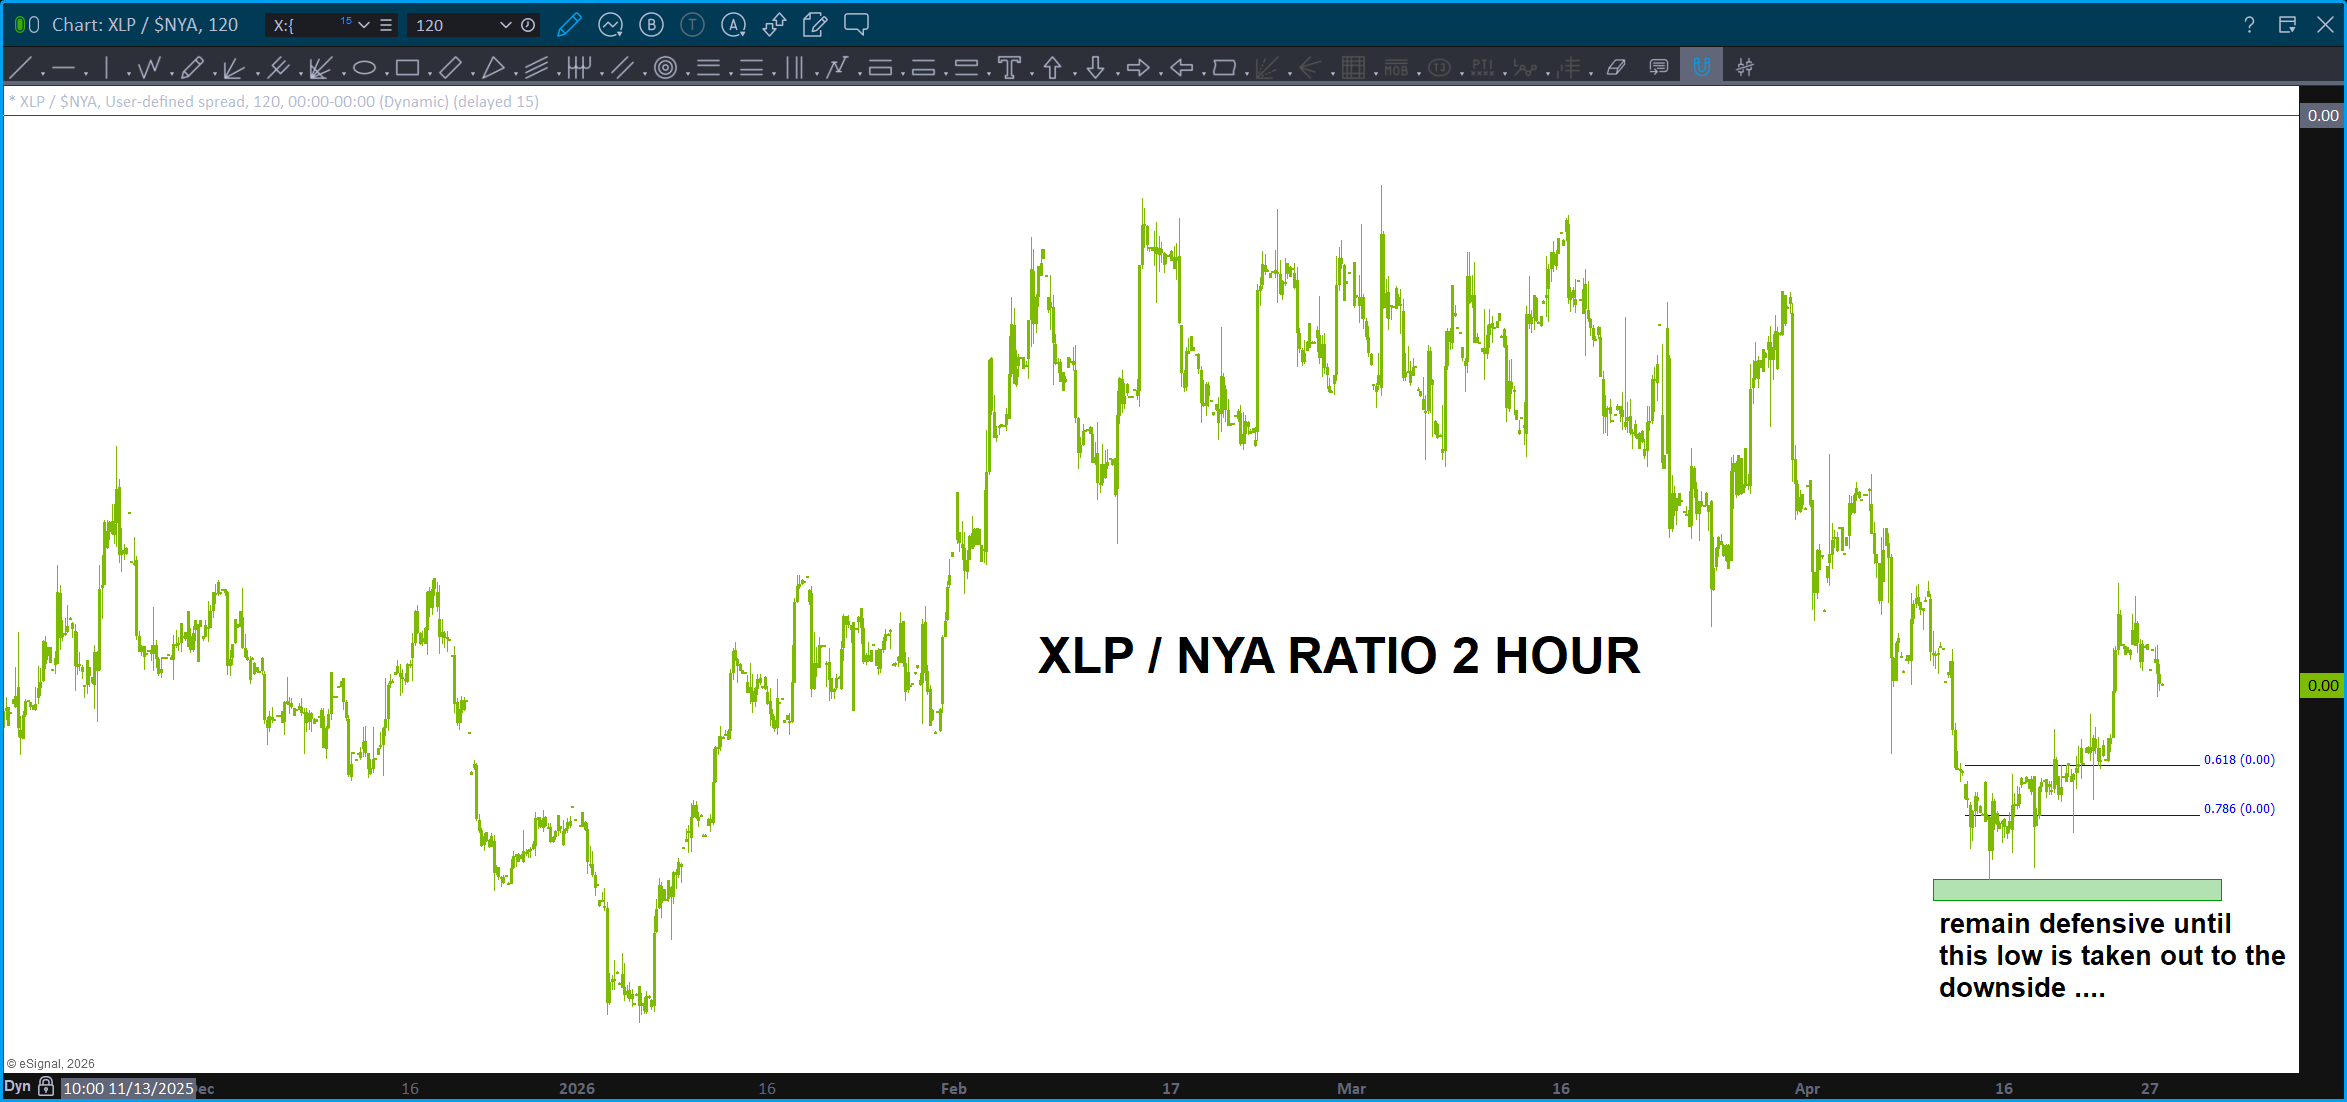
Here’s our trusty ratio .. take note, it has NOT made new lows even though some indices continue to climb the wall of worry … overall, I would be defensive w/ stocks and not chase this market … until we take out the low on the ratio (green shaded area) be careful.
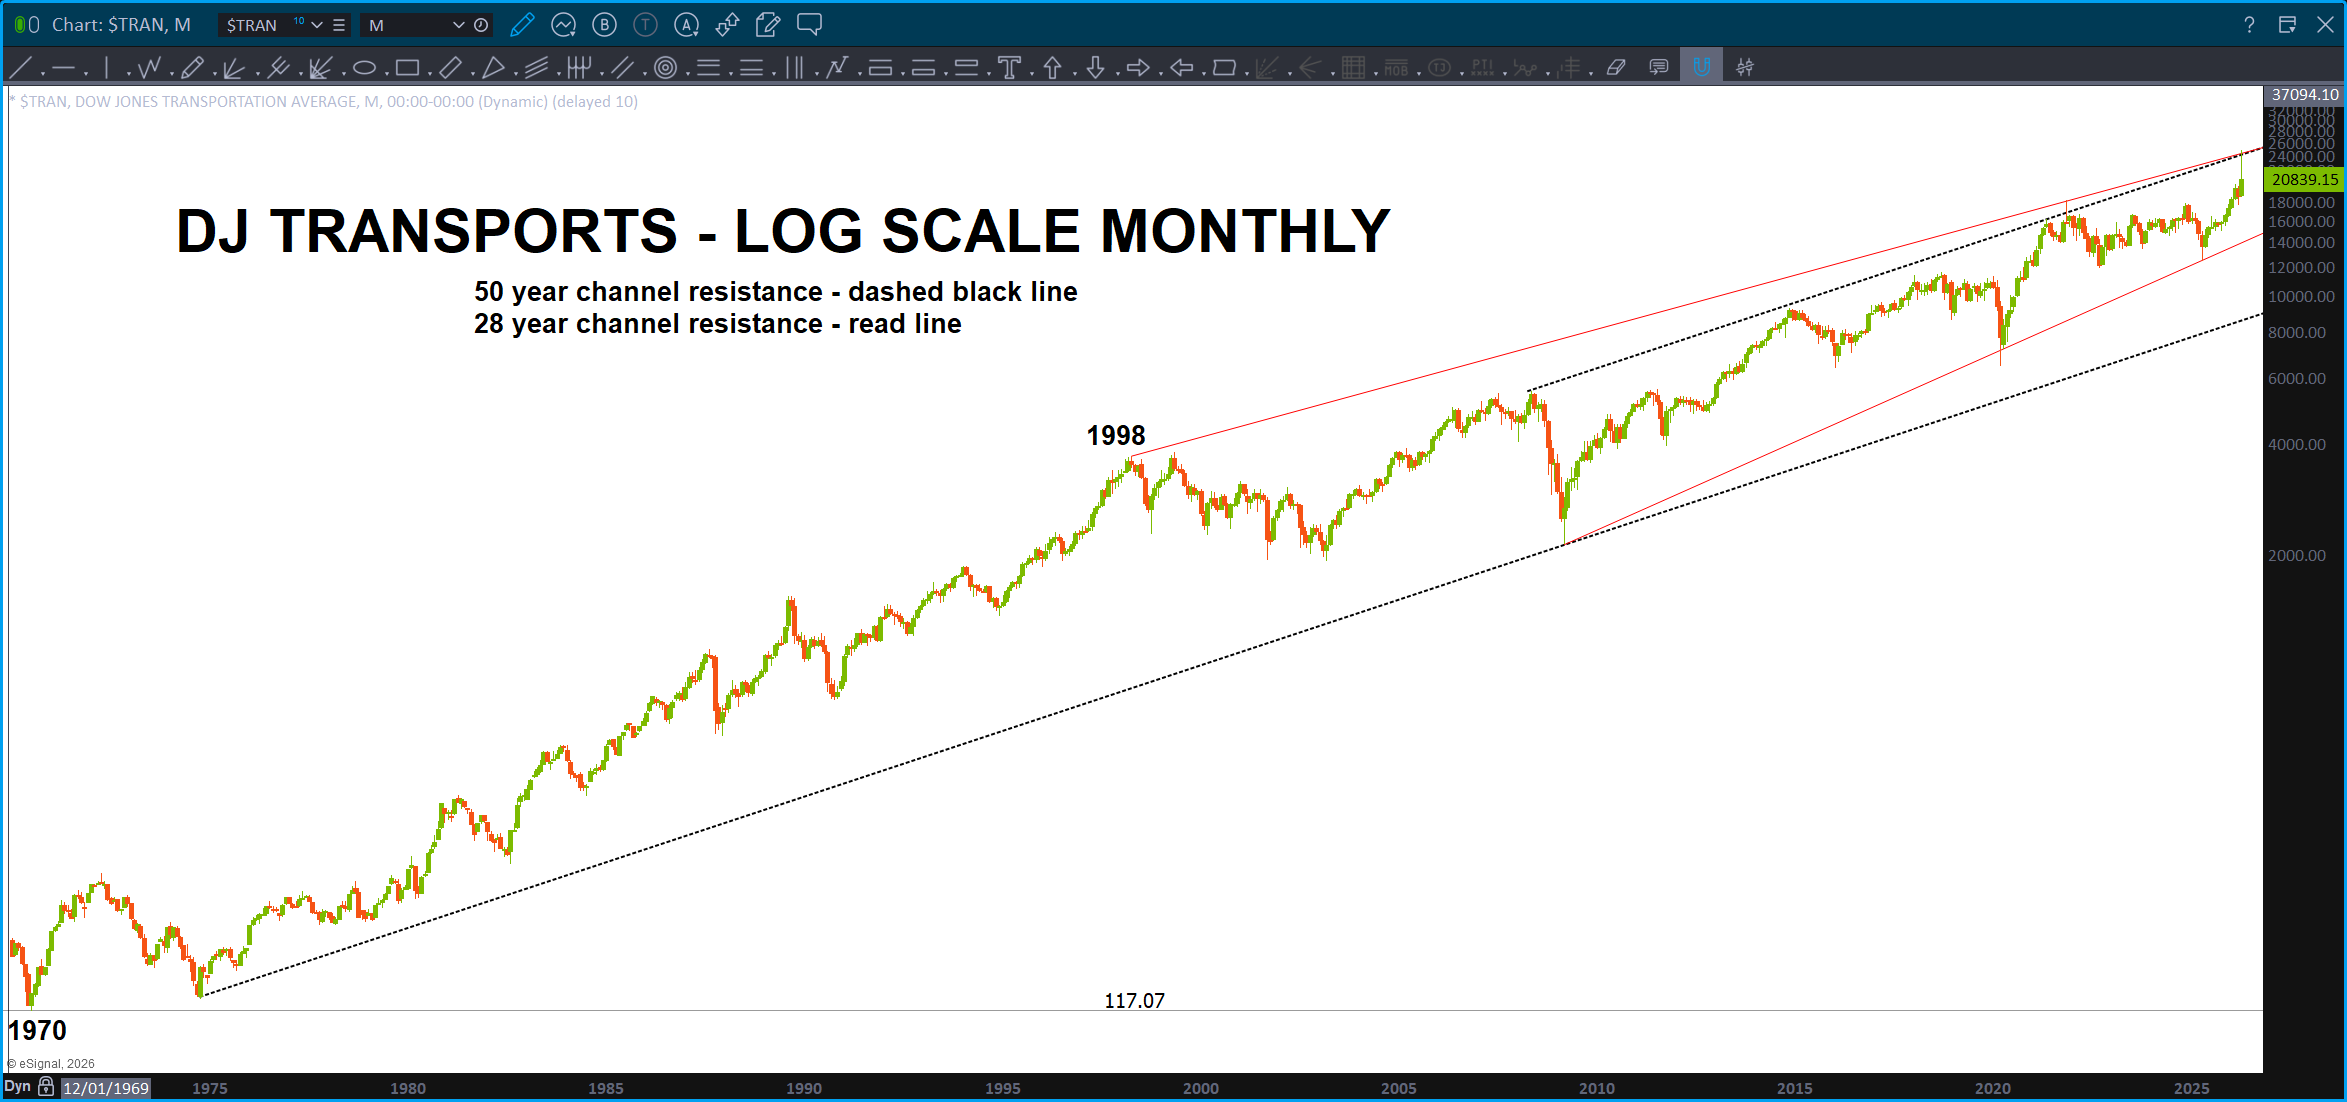
The DJ Transports took off to smack right into a 50 year trend channel (log) and has immediately reversing …
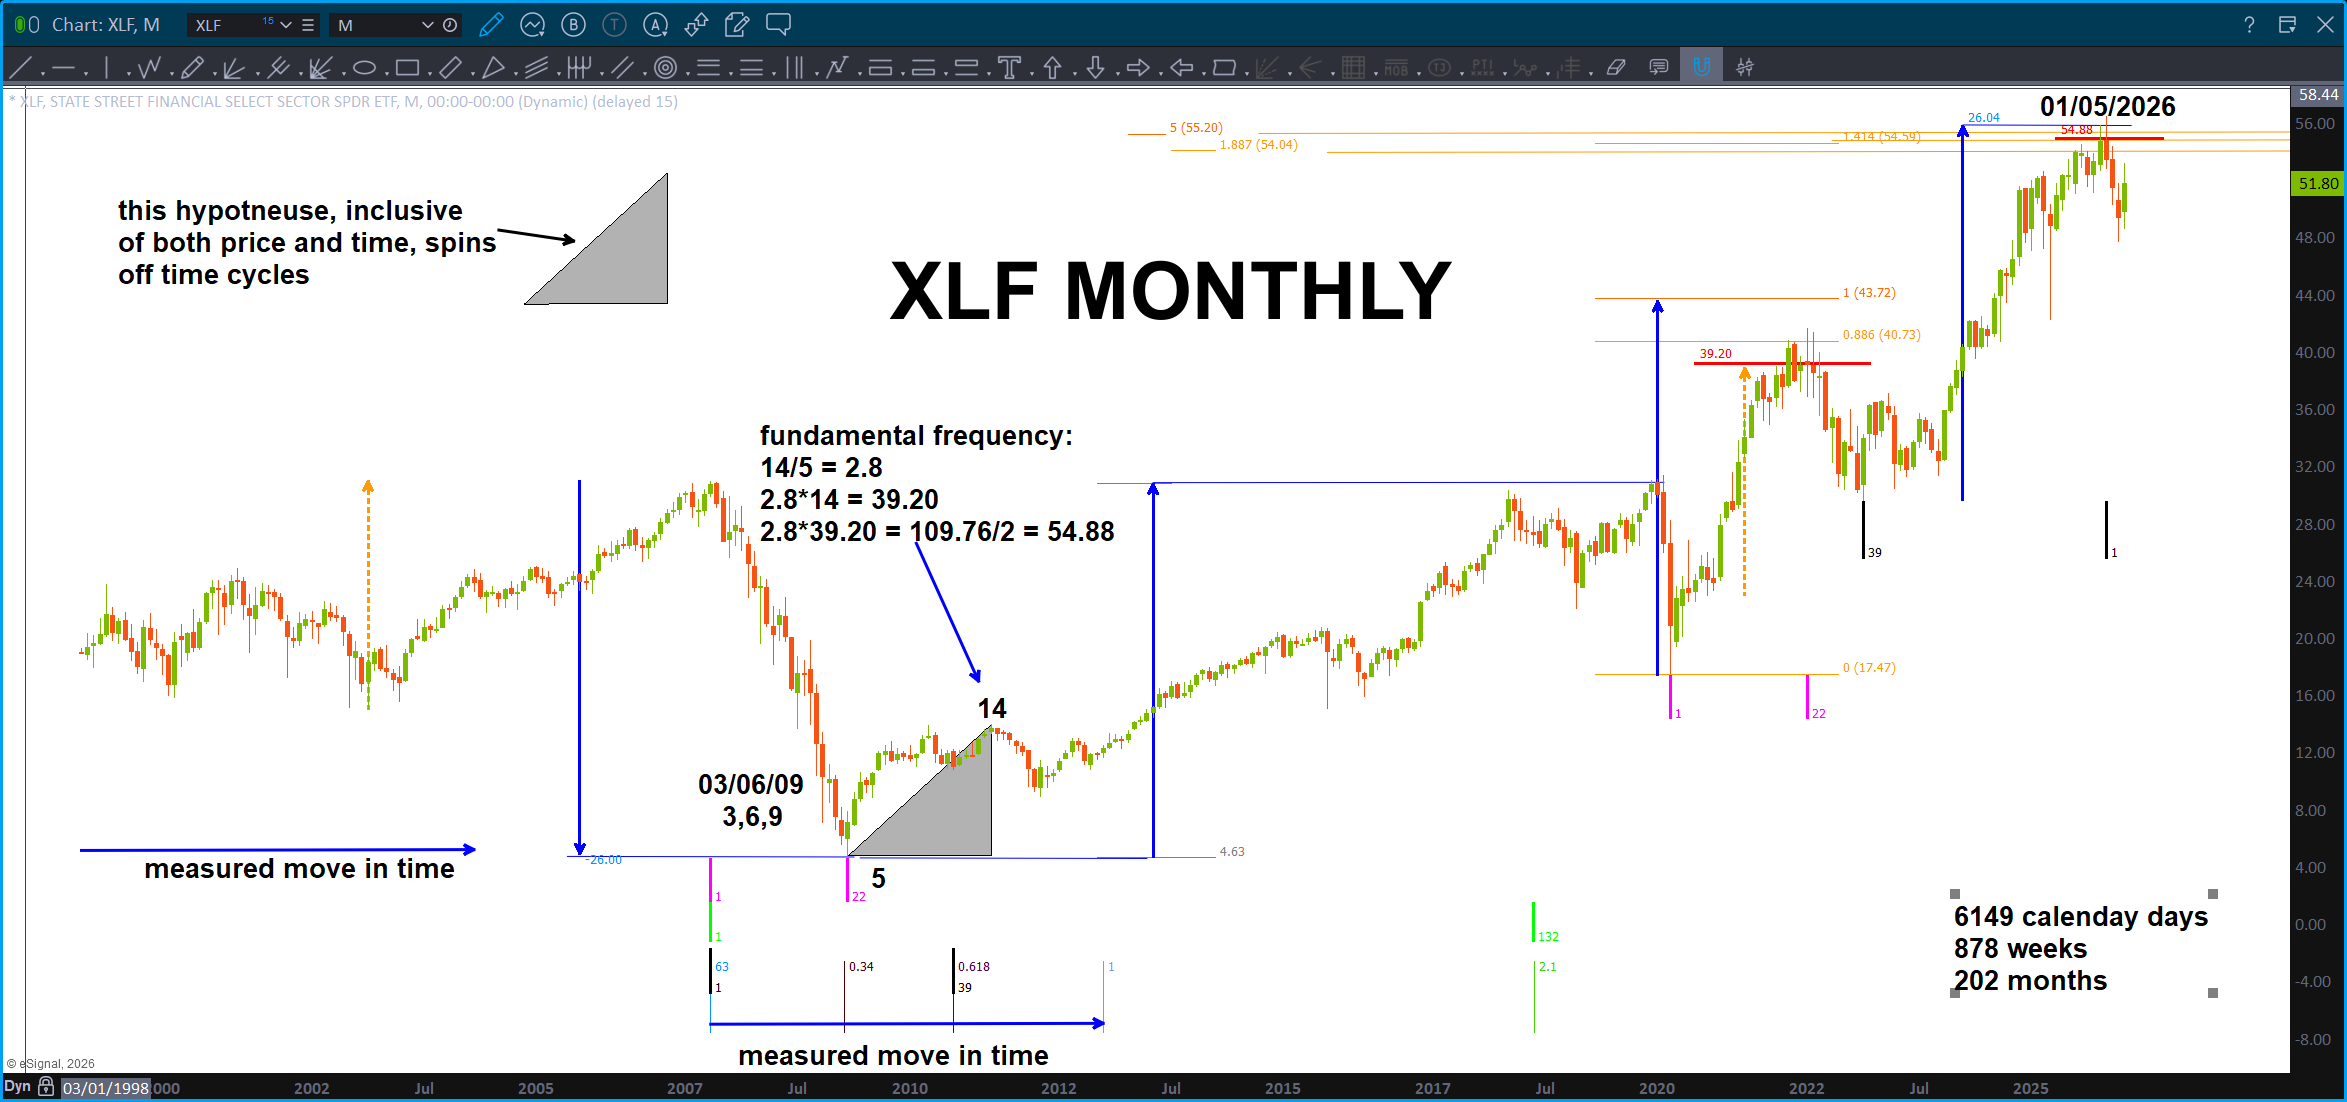
As we have discussed, many times here, the Banks/Financials lead us UP and lead us DOWN. Right now, the XLF has NOT made new highs.
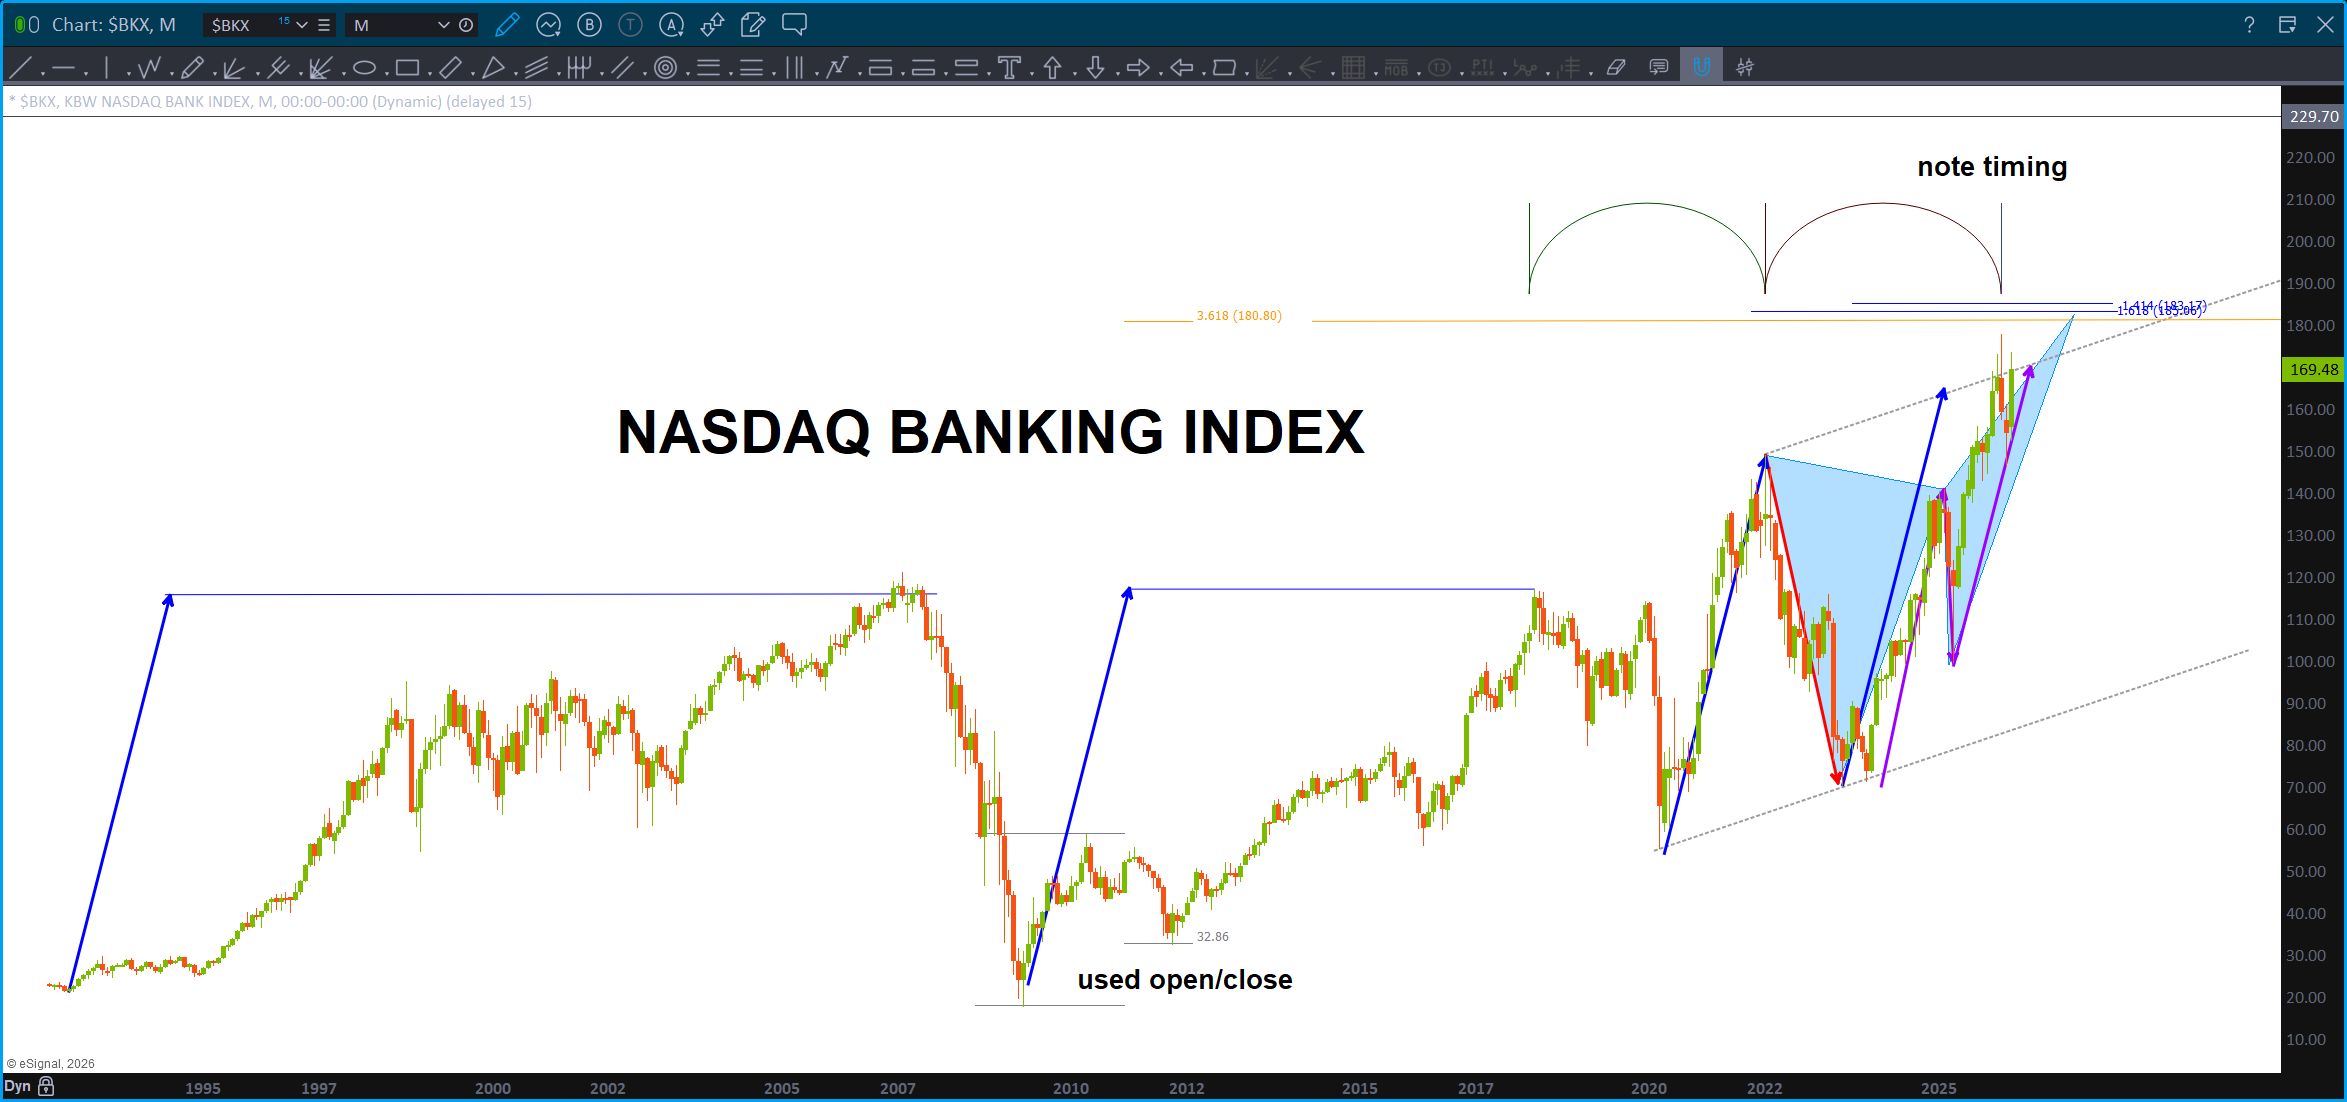
NASDAQ Banking Index … no new highs.
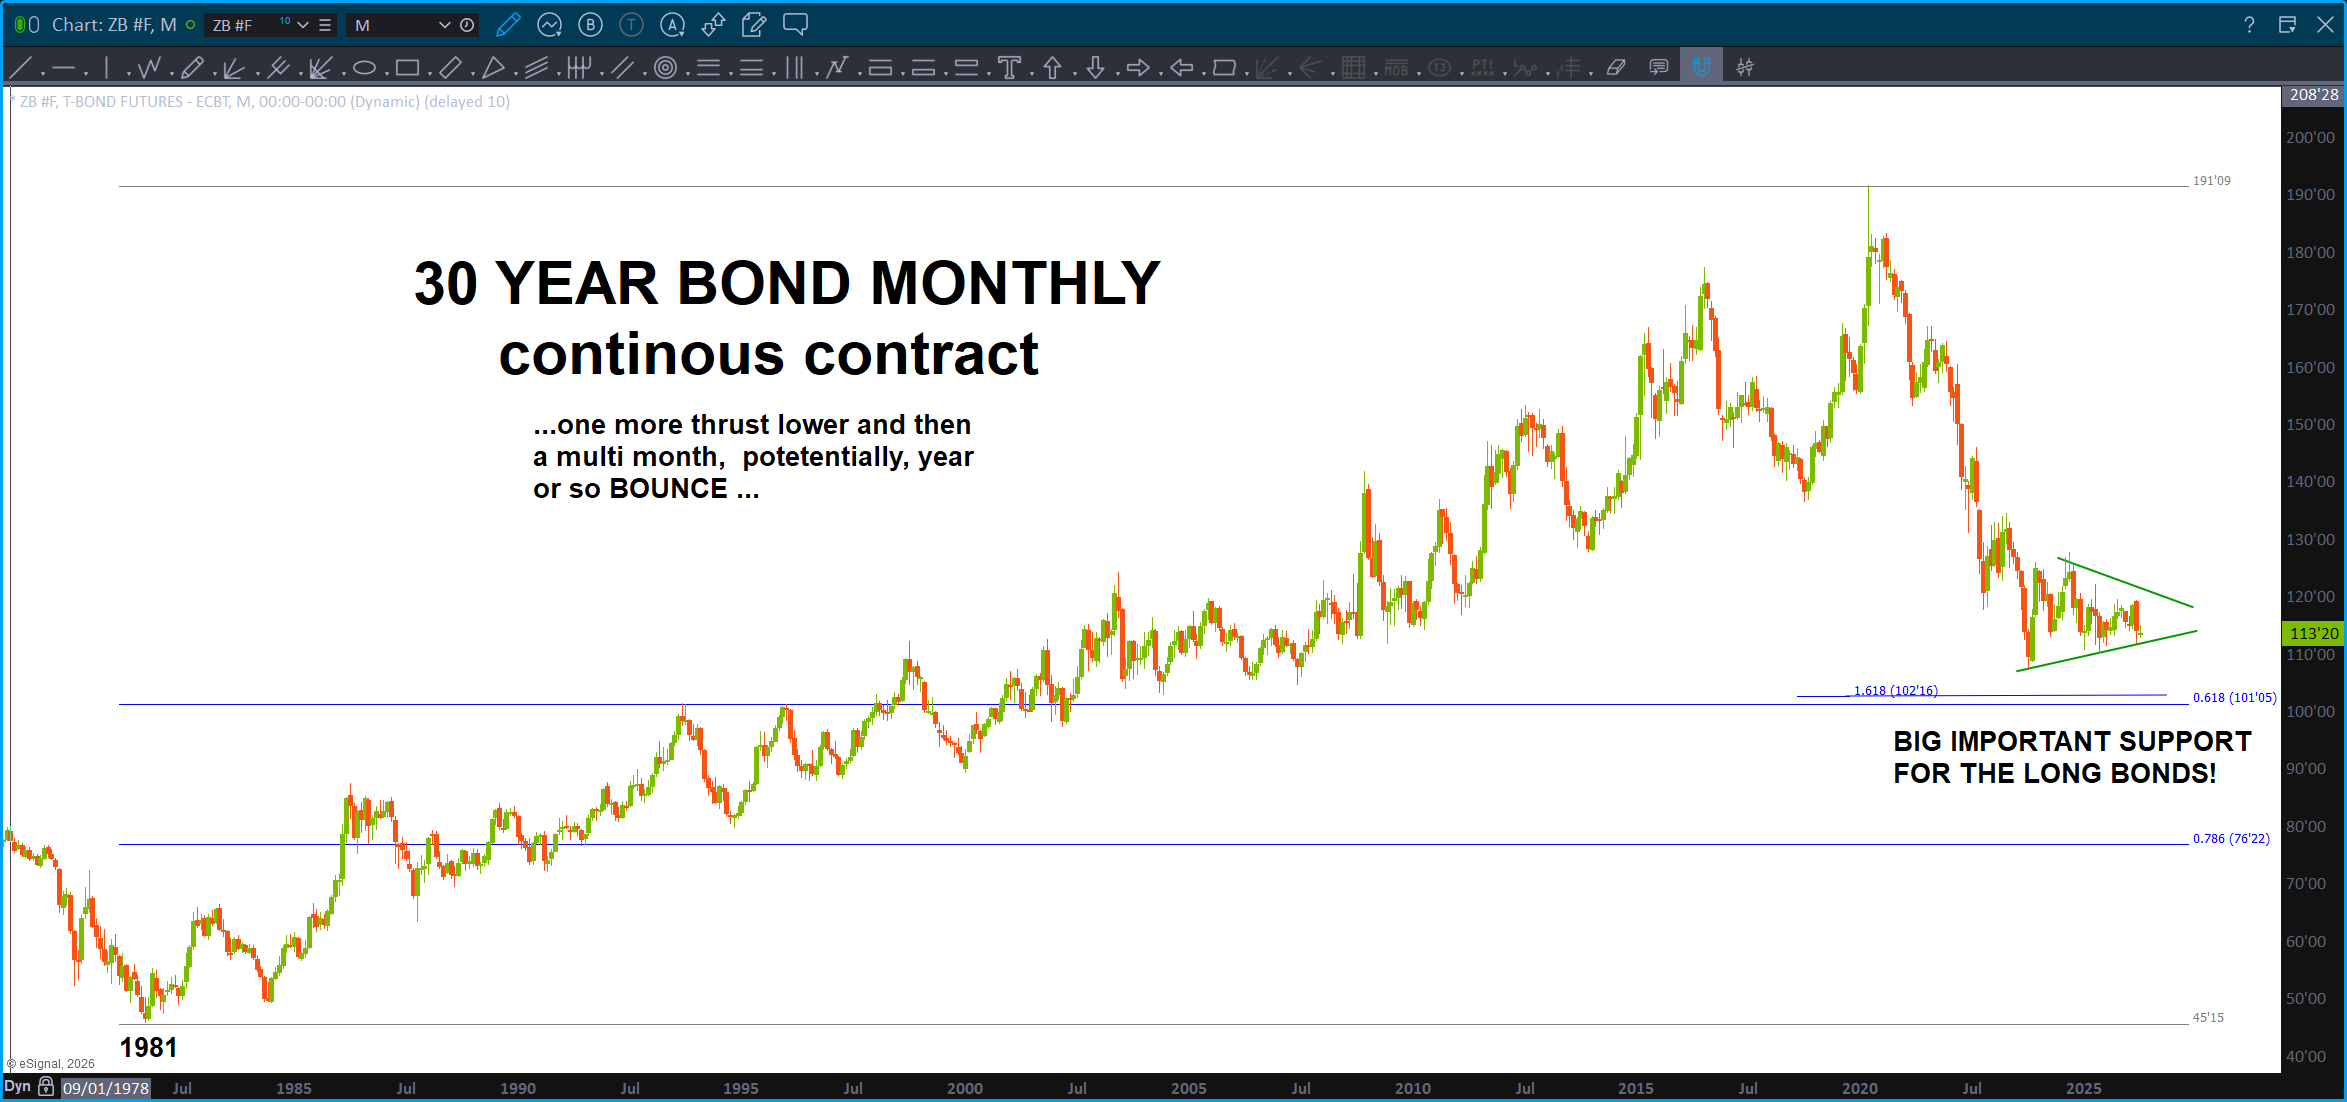
In the fixed income world, our opinion has not changed. One more thrust lower out of the multi year triangle and then major support at the .618 retracement from the 1981 low.
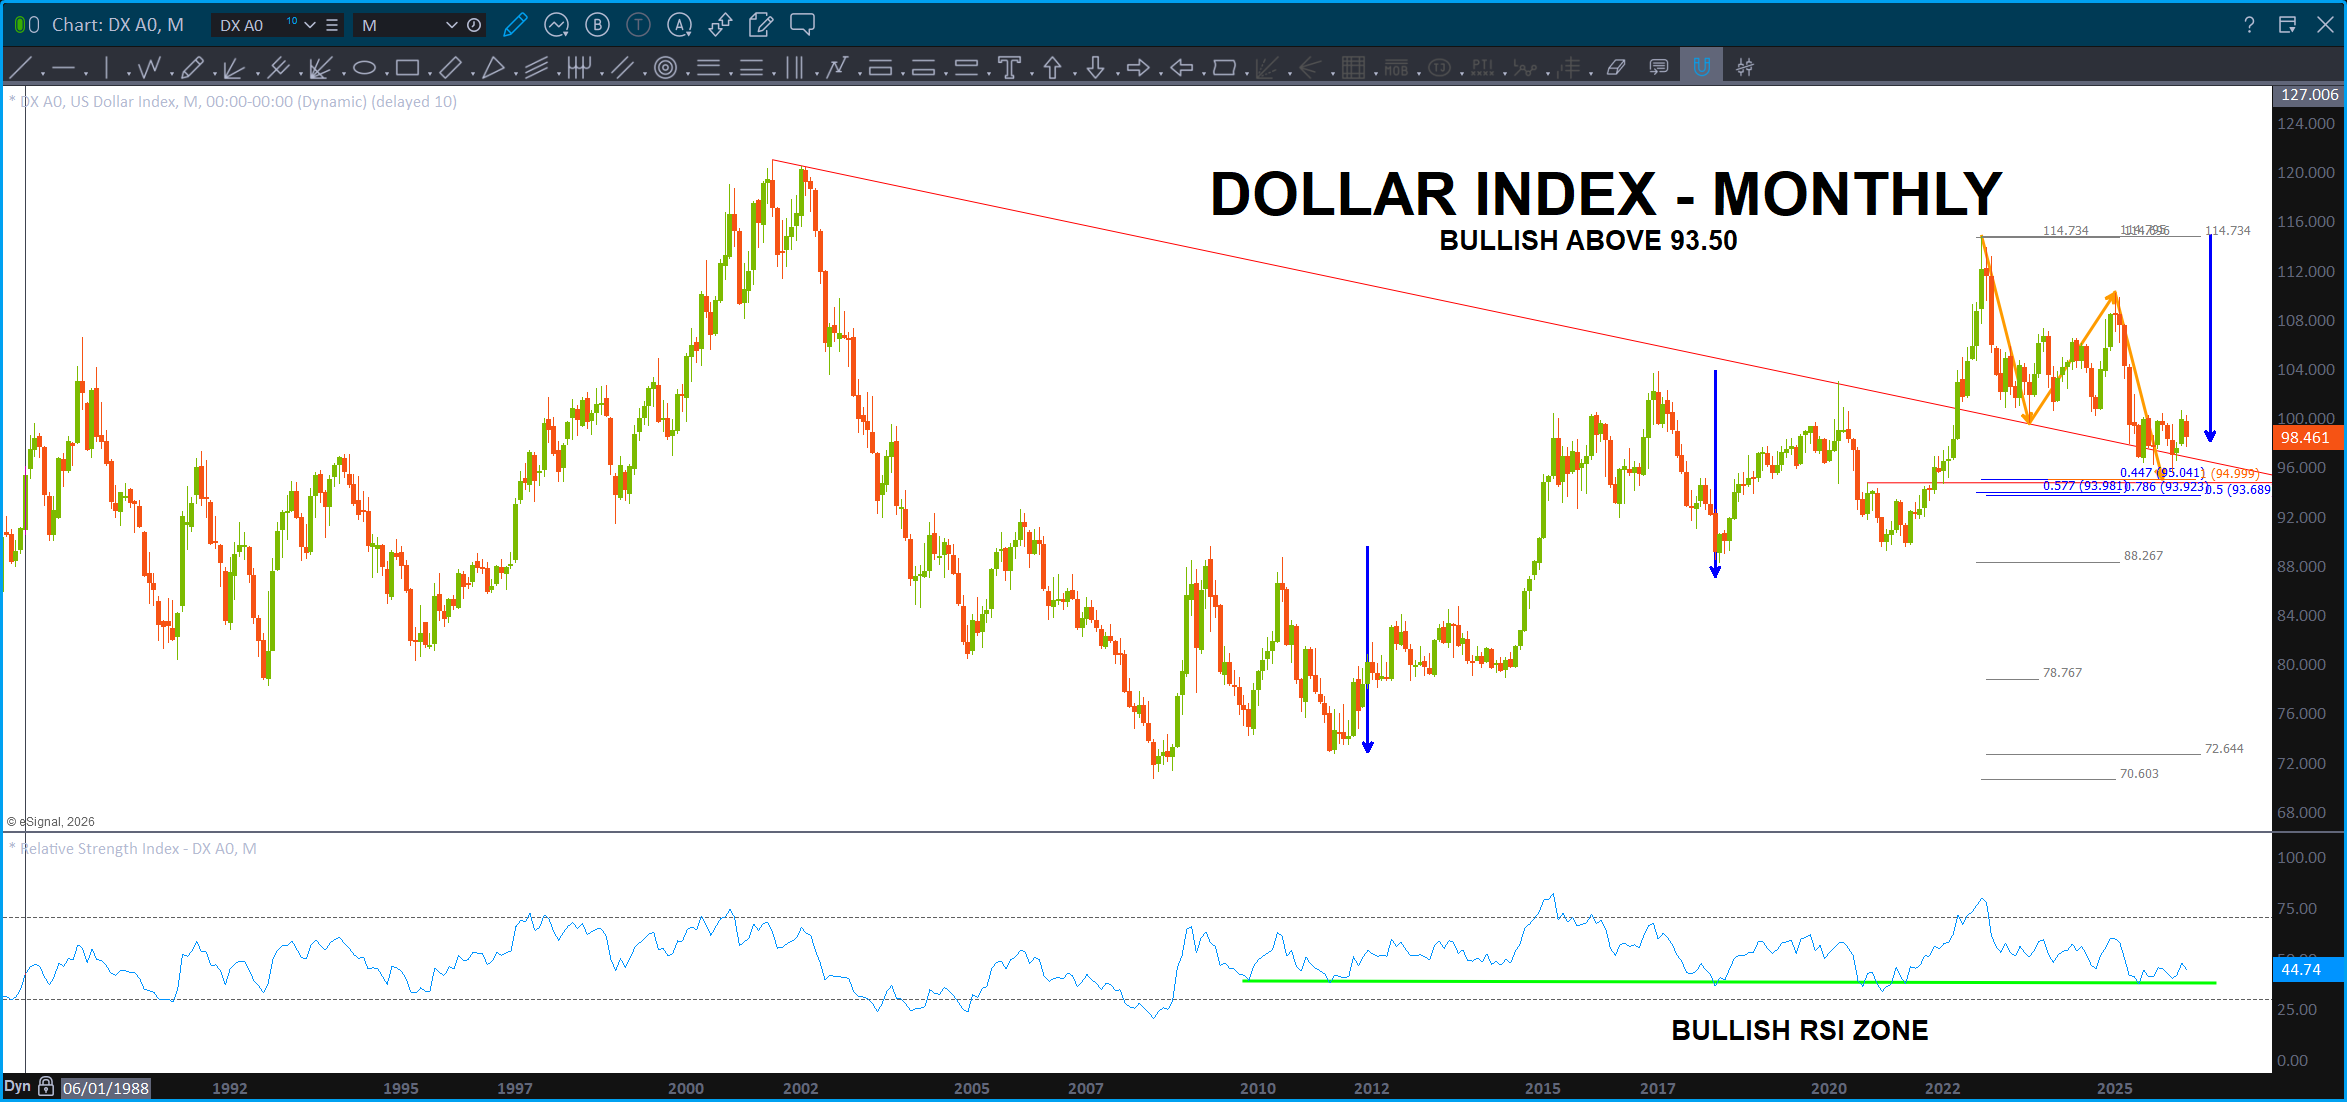
The rally cries for the demise of the dollar and all that … not seeing it as long as we stay above the 93.50 zone shown below, I’m a dollar bull.
The semi-conductor industry has been exploding …
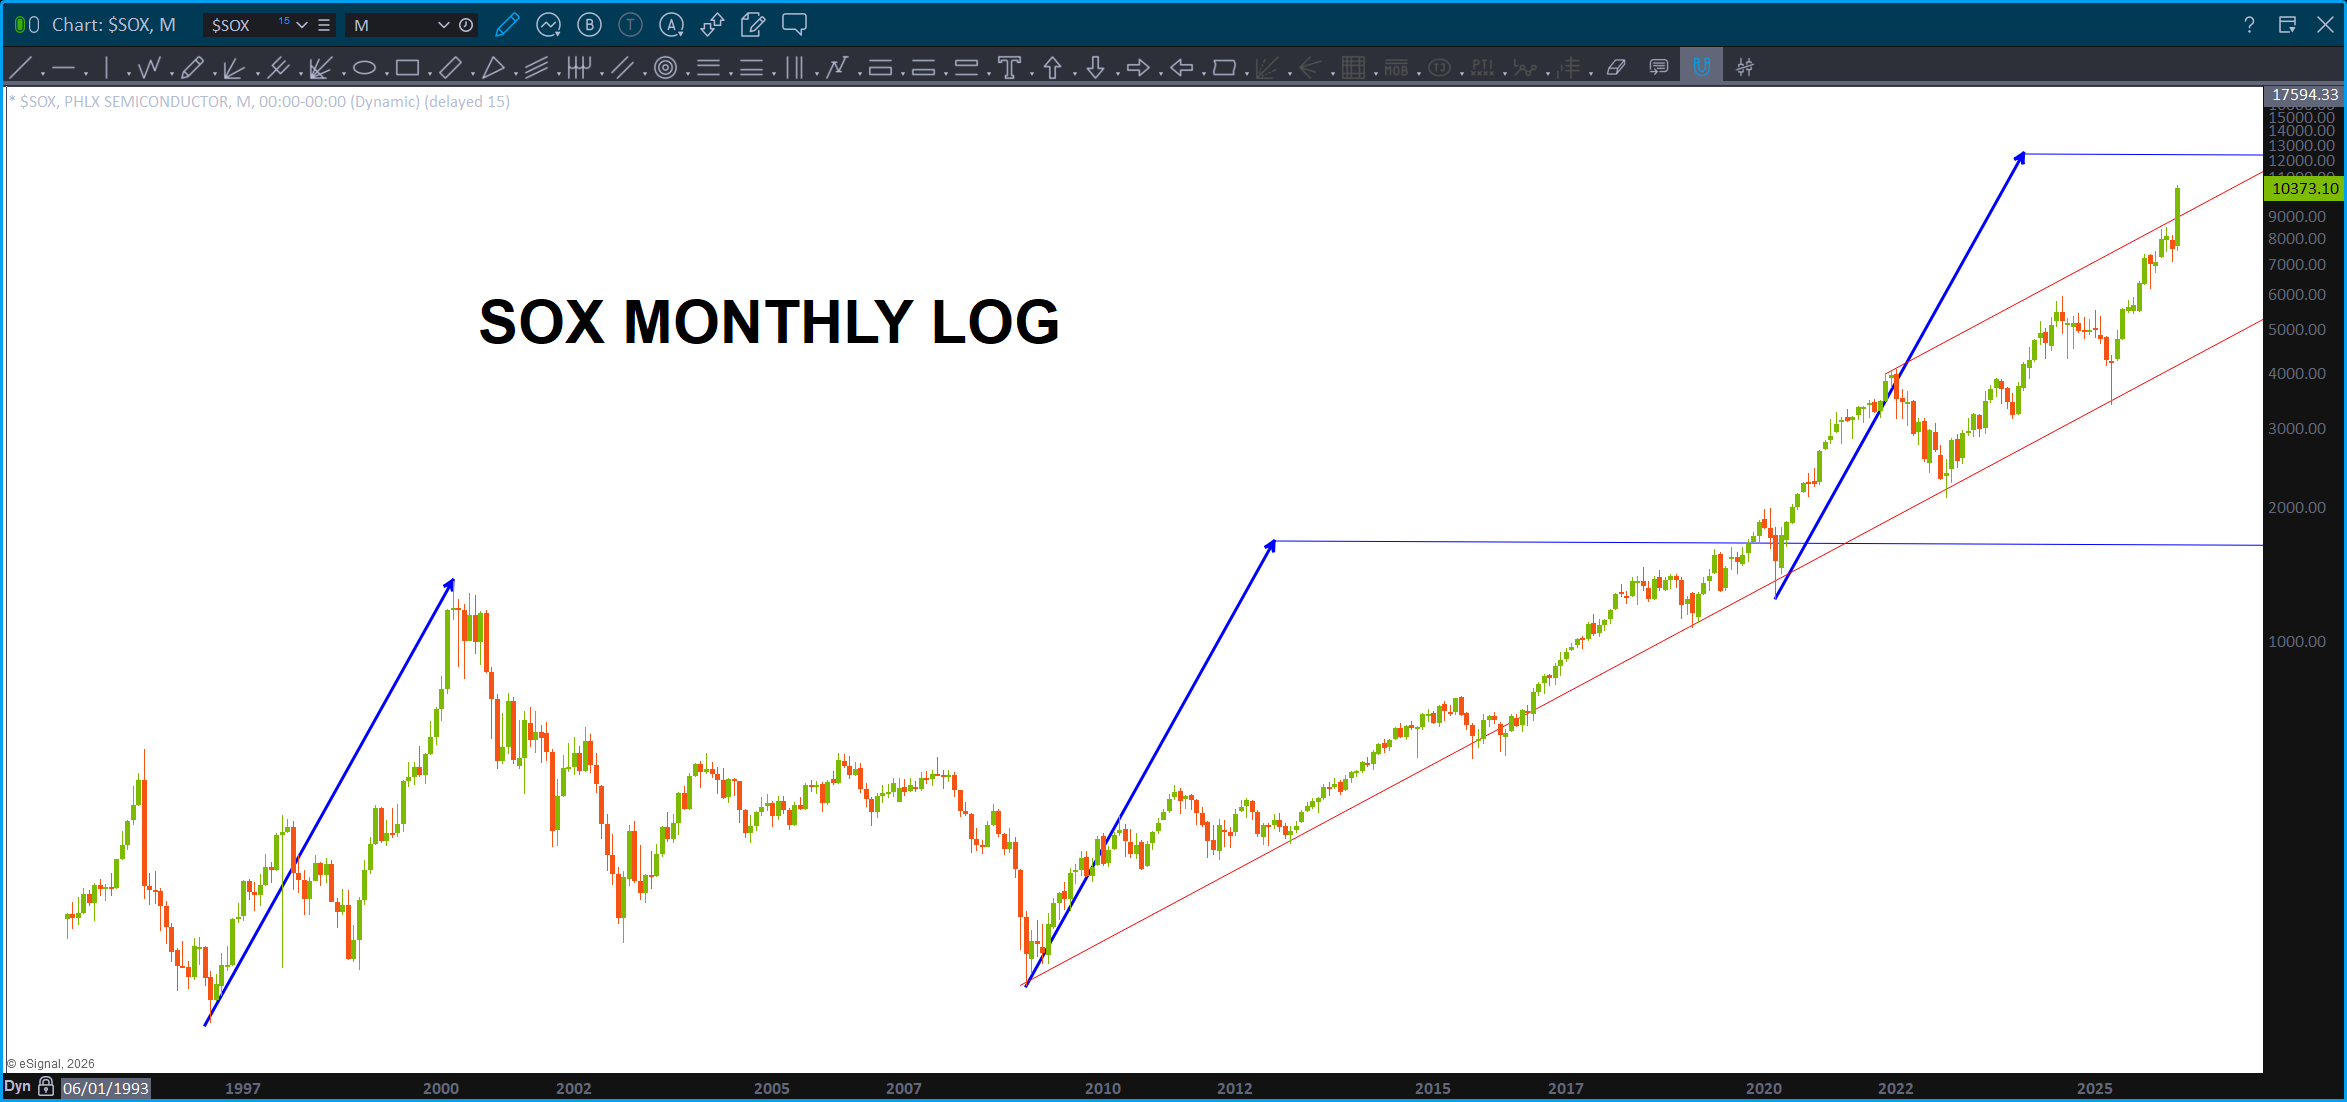
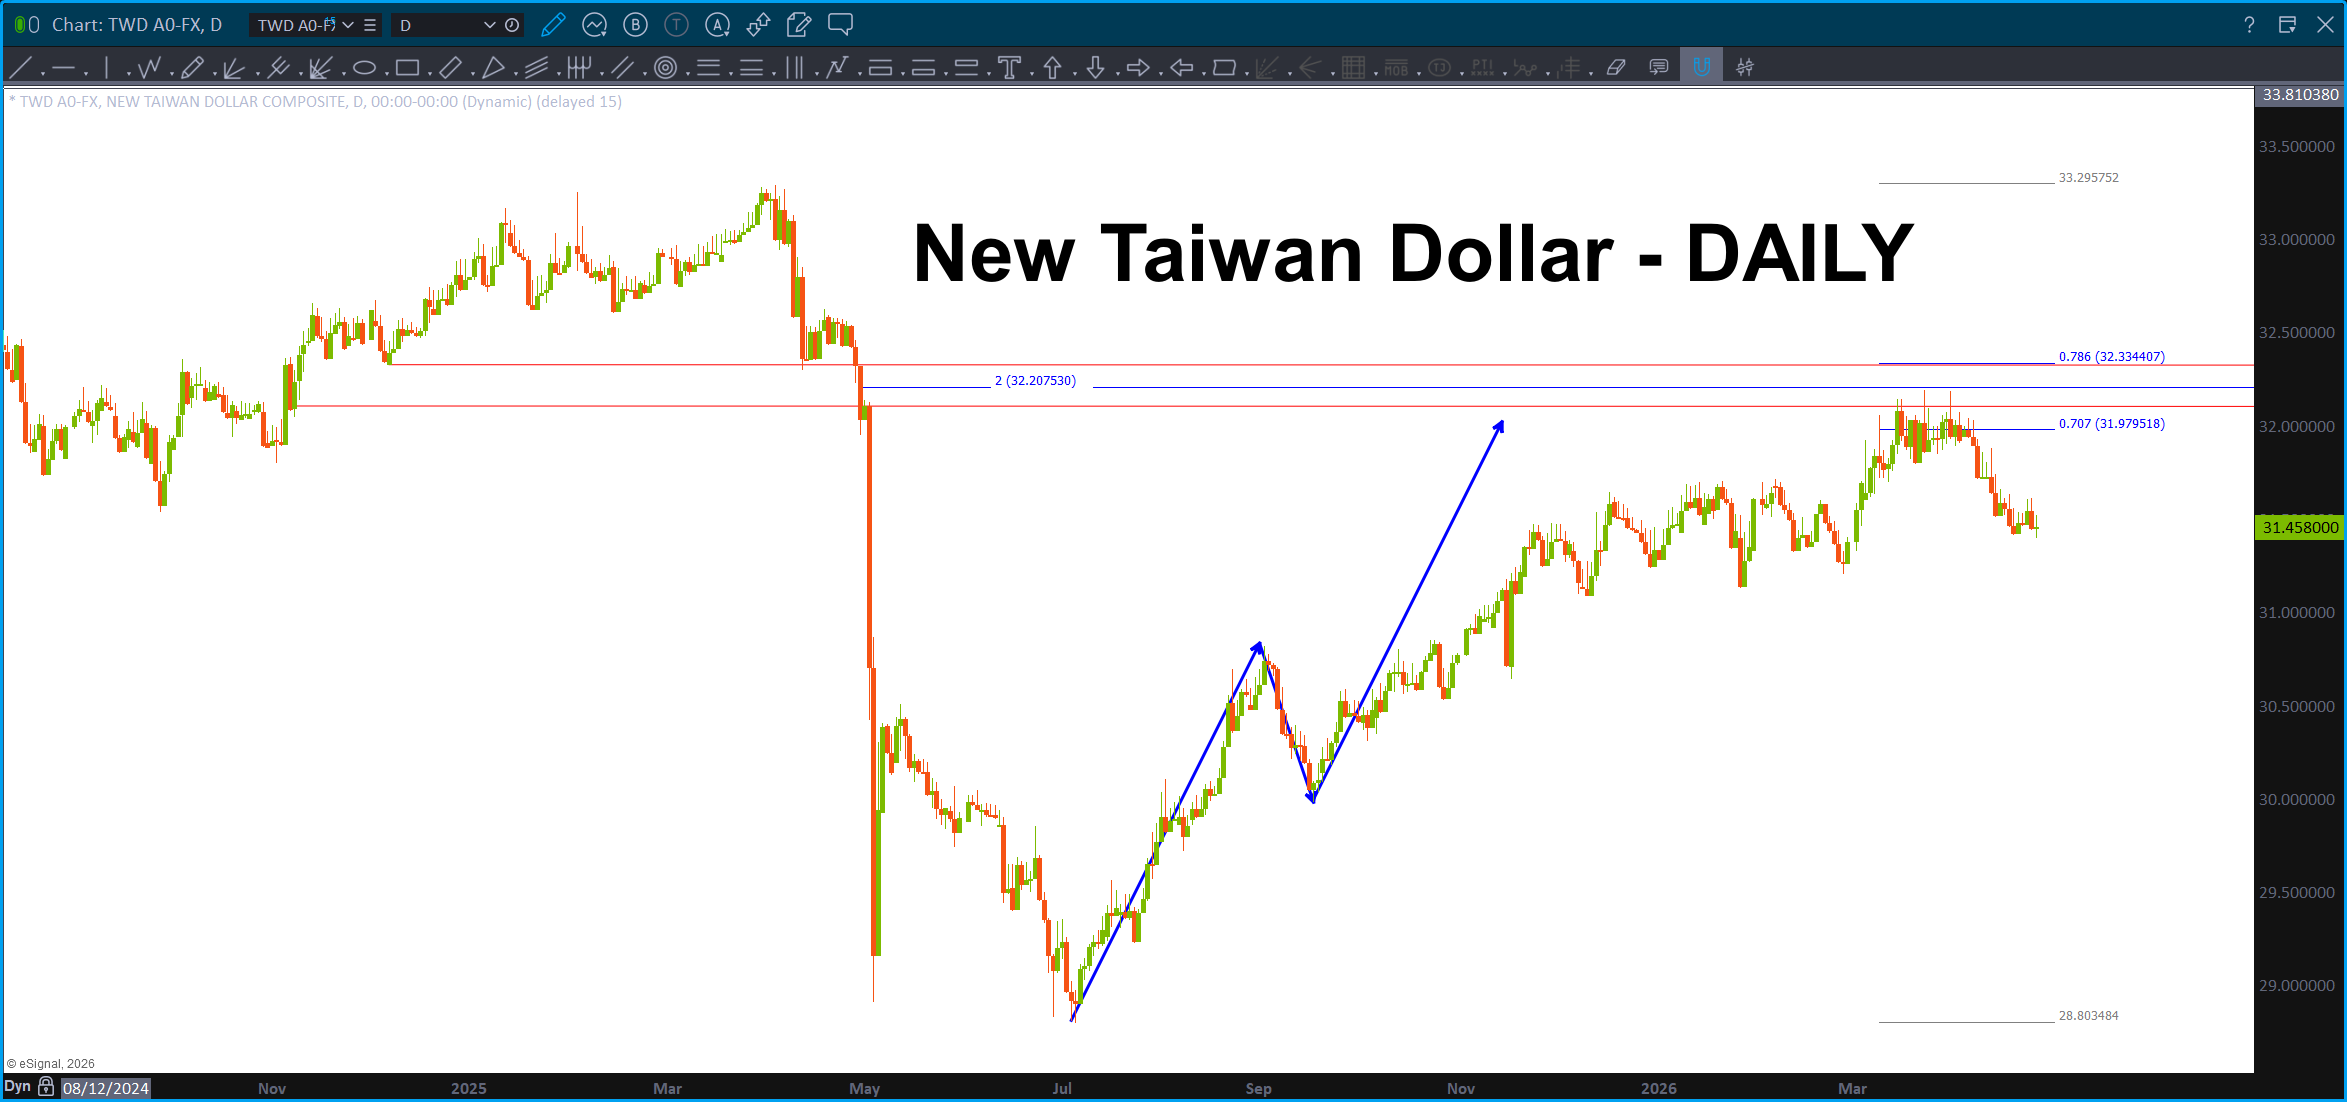
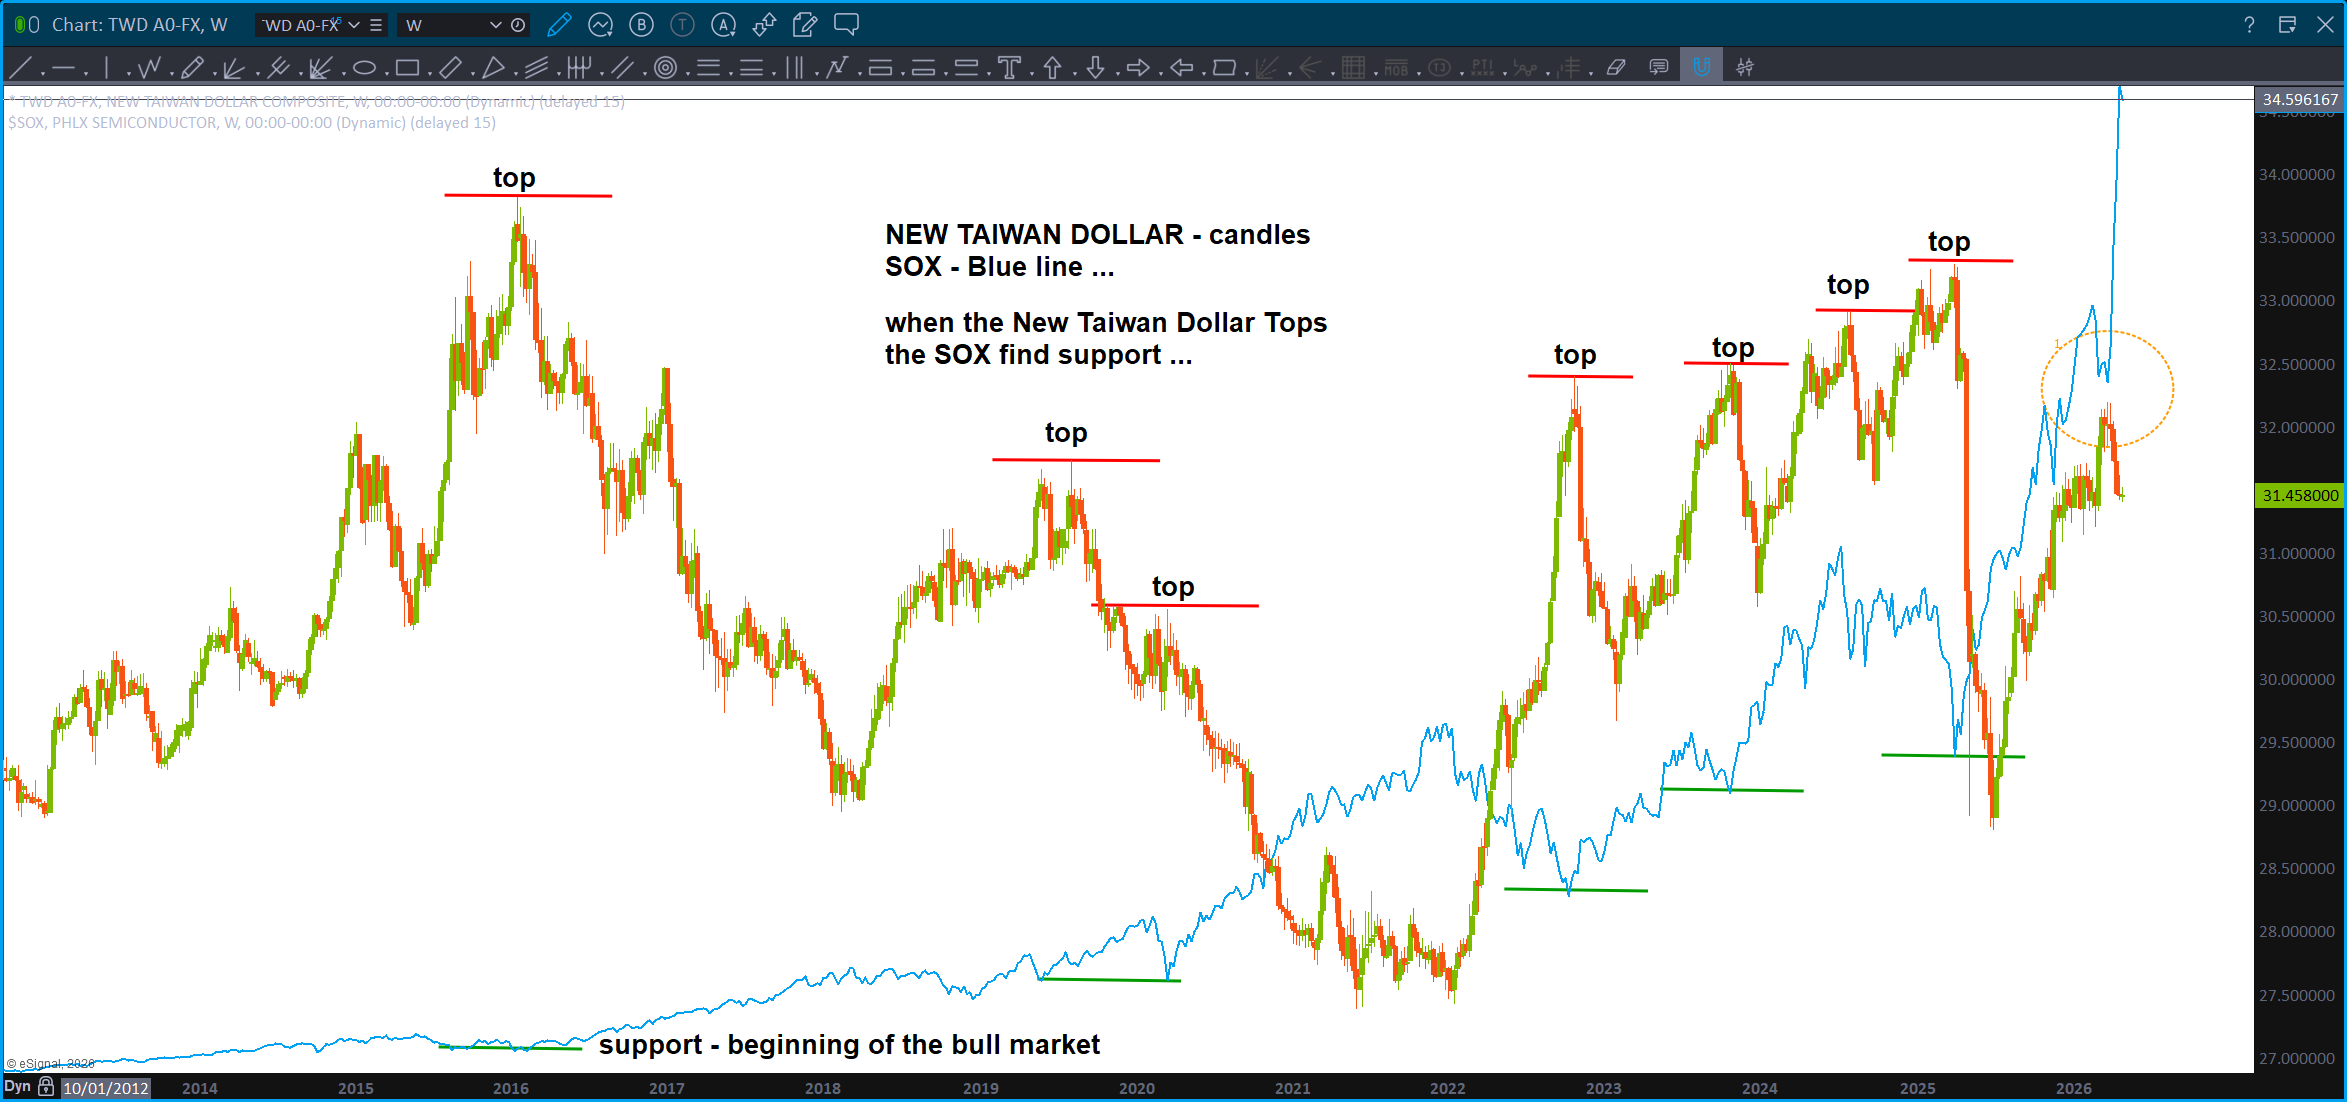
We need to pay attention to Taiwan. The New Taiwan Dollar has shown some correlation to the Philadelphia SOX index:
As for the alternative digital currencies, I’m still looking for lower. Folks, again, if my count is correct we have FINISHED a 5 wave sequence, which I’m calling wave 1 and we are correcting in wave 2. If you are a bull for Bitcoin, I would still wait.
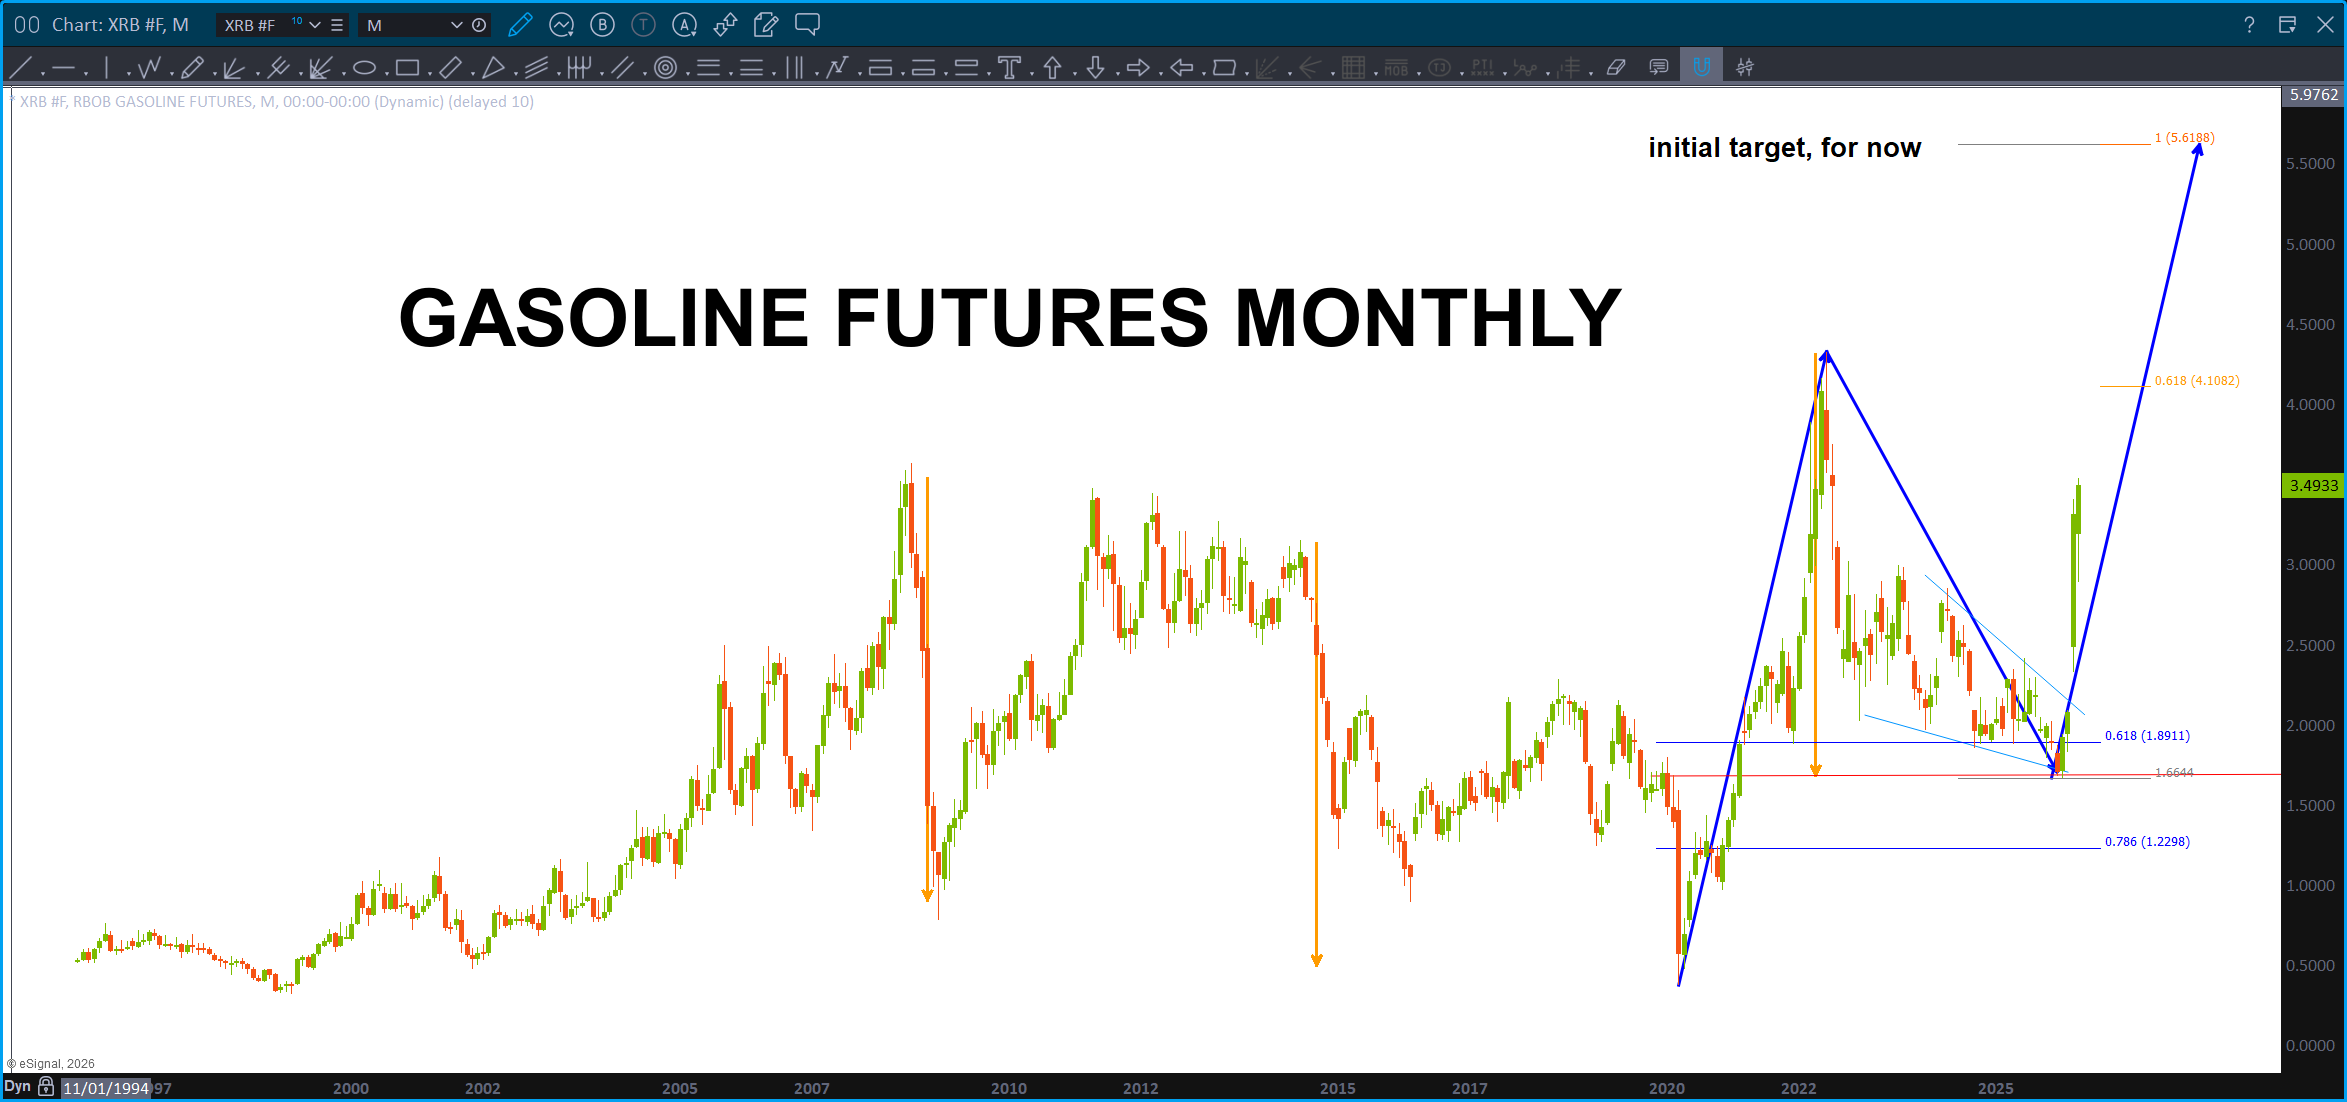
Folks, Gasonline prices aren’t going down anytime soon ….they shot out of the wedge and BOOM off to the races. Can’t see this slowing down for now.

So where do we go from here? Be well Bart! Best, Sully
Sully – great to hear from you! Take a look at the XLP/NYA in the updated chart and let that be your guide. For now,if your long stay long and set a stop that works for you. If your trying to get into this market, I’d wait till one of the levels on the XLP/NYA are taken out. Believe it or not, this puppy could explode higher simply because there is no where else to go! Seriously …
Thank you Bart – caveman stay long… that is what I needed Brother! 🙂