IBM – February 25, 2023
Relative strength REALLY helps us understand the institutional flow …using basic numerator / denominator we place one security over another (it can be anything liquidly traded) and if the chart goes UP the NUMERATOR is “stronger” from a relative strength perspective and if the chart goes DOWN then the DENOMINATOR is “stronger” from a relative strength perspective.
Now, if entire market is being liquidated and the “relative strength” chart is going UP it probably means the denominator is really getting smoked and the numerator might be just getting flesh wounds. It doesn’t mean it won’t go up or go down .. it might not go up or down as fast or as slow as what its being compared to …
I like it because it helps me look for strength … IBM is showing an interesting relative strength chart:
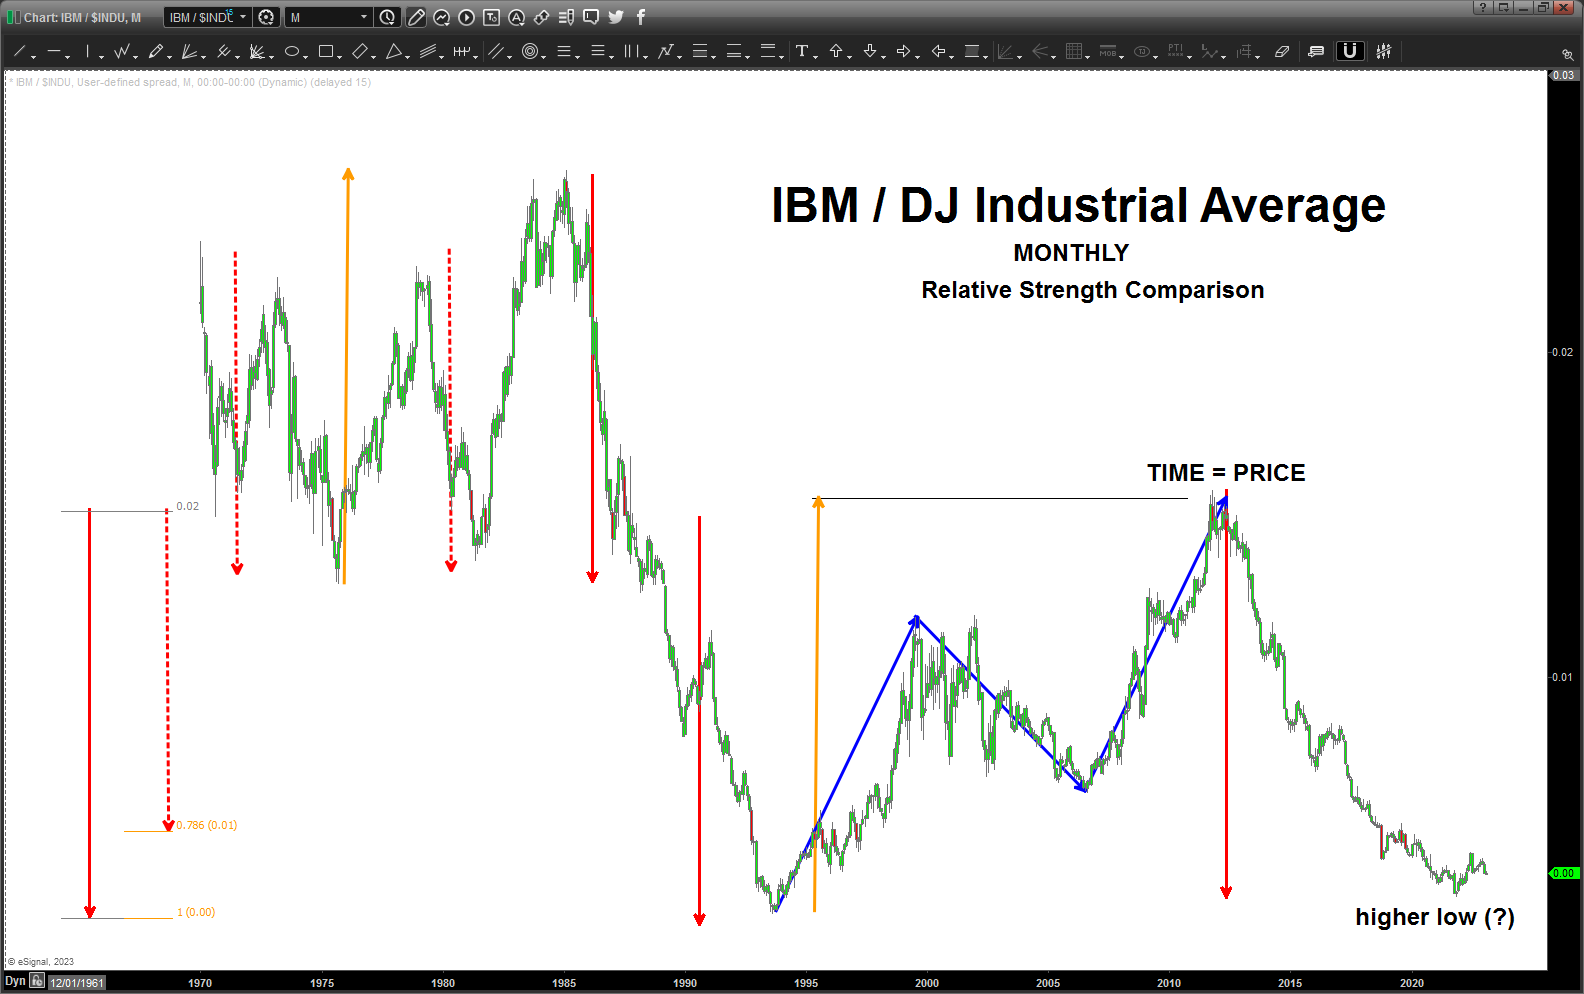
Looks like we have some “measured moves” above … shocking, I know. As you can see, we have a nice harmonic in the red “down” arrows and, just for fun, wanted to show you the harmony pretty much across the board.
IBM, from a relative strength perspective certainly looks like it could have put in a low against the DOW. And, guess what, on a lower daily timeframe we have a PERFECT BUY PATTERN present:
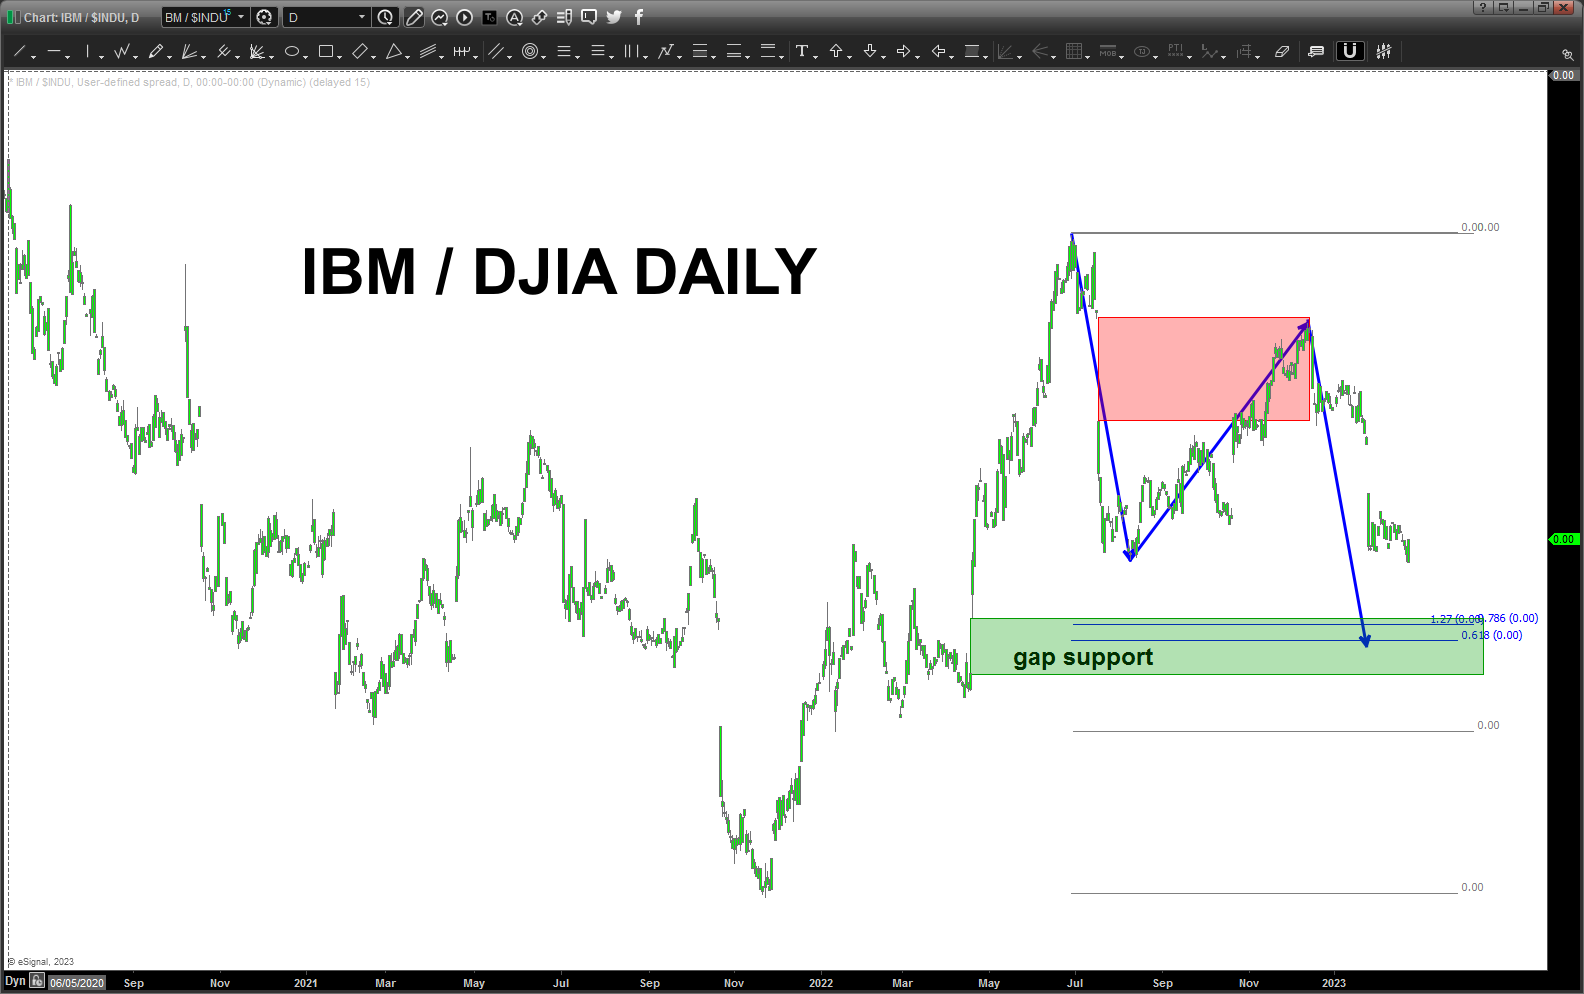
Note, this BUY PATTERN lands right on top of a pretty big gap area so I do think it “should” (doesn’t mean it will !!!) offer support and a continuation of IBM’s outperforming the DOW. What happens when this occurs:
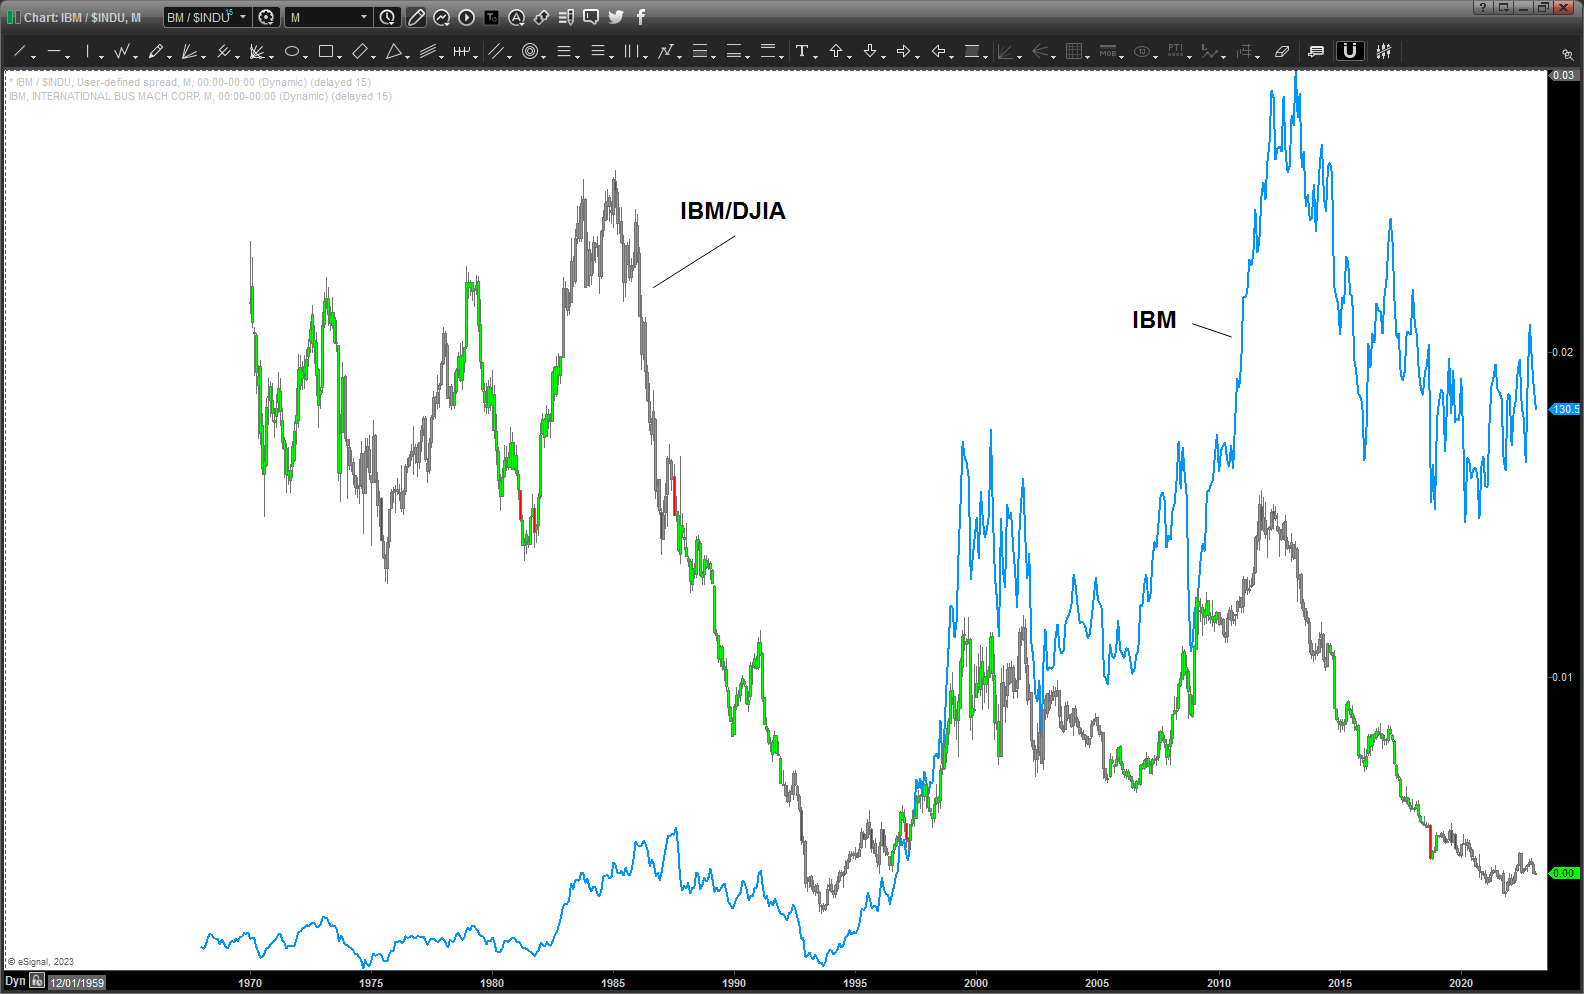
As you can see, when the ratio bottoms (makes sense) IBM goes UP UP and away …note, the BIG “liquidating” drop in the IBM/DJIA average didn’t have the same slope on the price chart. It went down, yes, but it wasn’t a knife falling. This is an example from the last pargraph.
So, here’s the chart from a while ago:
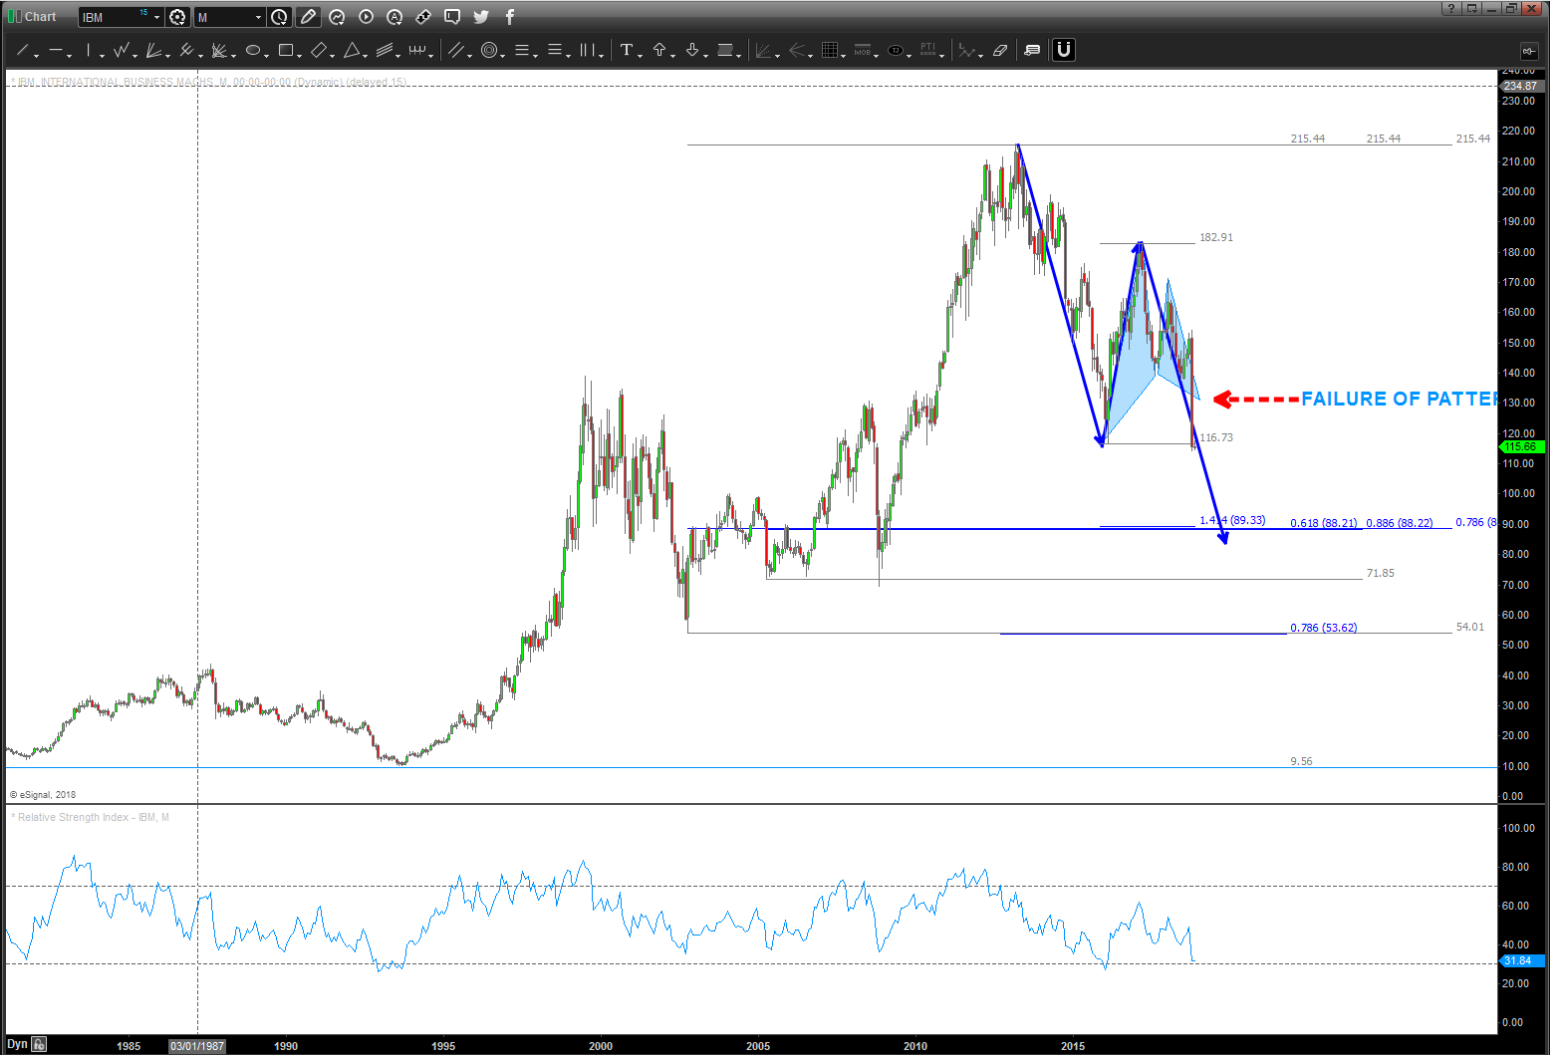
Couple takeaways, before the BIG PATTERN hit another had failed. We never know which ones work and which ones don’t … it’s all probability folks. Trust me, when you have two or three fail in a row after you have used a TON of tools and hours coming up w/ a level and then the next one appears you do have your doubts but TRADE WHAT YOU SEE NOT WHAT YOU THINK! Anyhoo .. the lower “bigger” pattern worked nicely! See “buy pattern complete” to the left below.
Now, as you can see we have interesting technical issues occurring:
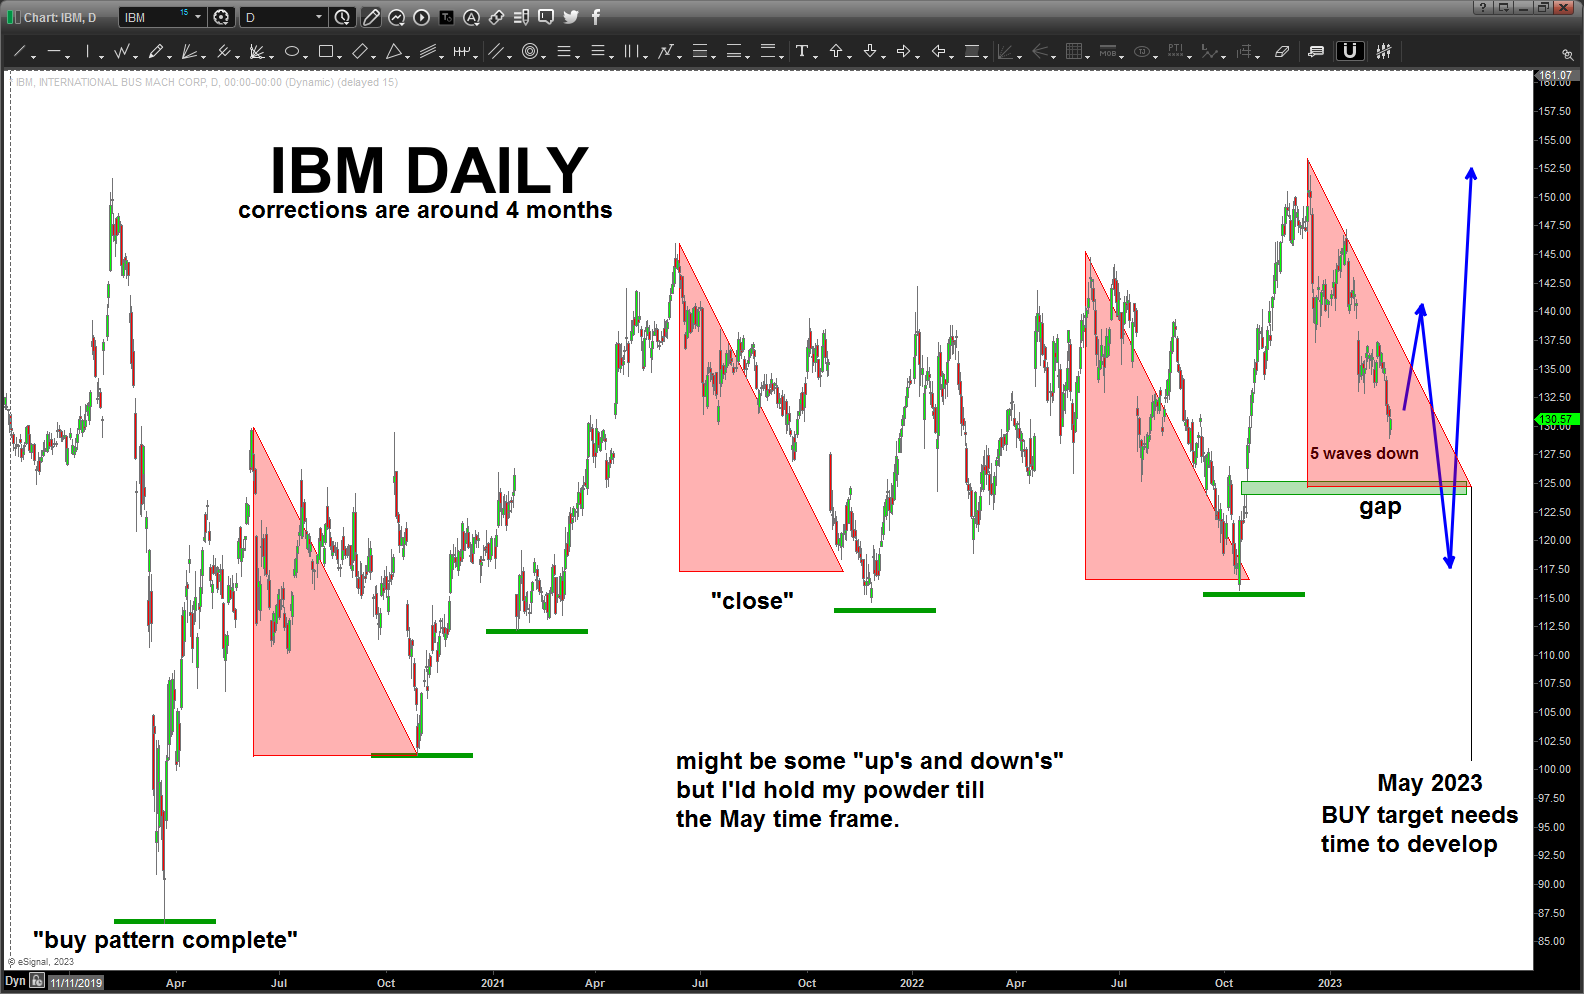
- Stair Steps: not a swing low has been broken on the way up .. higher lows. Michael Jenkins (www.stockcyclesforecast.com) taught me that 1-2 swing lows broken is “ok” but if a 3rd is broken, get the hell out … this coming correction will, maybe (?) test the swing low around 115. We’ll see ..
- Since the low back in early 2020, the corrections have been, pretty much, the red triangles. I’m using a triangle to show the “price” and “time” component of the corrections and “red” because it’s going down. See how that works! LOLOLOLOL. If (and it is THE big IF) we continue w/ this rhythm then the next buy isn’t until May’ish 2023. We have time …
- From the high … it is certainly “easy” (relative I know) to count 5 waves down so expect a “bounce” to occur and then one more wave down to buy. I can see that taking us into the May timeframe. Yeah?
So, it is going to be very important to watch the BUY pattern on the ratio and then compare where we are after we done a “bounce up-down” wave and then take a peak at the TIME (May perhaps) and IBM might be ready for the next leg higher.
Patience … I know.

Hello Mr. Bartelloni,
I just wanted to let you know that I really enjoy your work, reading the blog, and look forward to your guests appearances on Larry Pesavento’s show. Your posts always inspire me to give a look myself at whatever your looking at. Just want you to know that there are people that really appreciate your work. I am more cycle focused based on the work of Brad Cowan and some WD Gann. I just use tradingview so I can’t always do the fancy stuff you’re showing. I tried duplicating the work you did on google but can’t draw the ellipses on tradingview like you do on your software. Ellipses are important and Brad Cowan writes alot about them but he has special software.
Just wanted to point out a few measurements for IBM. 1st, its 100th year anniversary is next February 14th, 2024 and 100 year anniversaries are big deals. The 1974 low to the 1993 low was a perfect metonic cycle. 19 years. UP 13 years (fibonacci number) down 6 years. And then the following bull phase balanced the 6 year bear phase with a perfect 6 year cycle up and the next 13 years to complete a 2nd metonic cycle, was the all time high in 2012.
There is some kind of growth spiral going on here but I havent’ had a chance to finish.
Thank you for taking the time to 1/ visit the blog and 2/ comment … your IBM analysis is amazing. WOW. I appreciate your input. As far as recreating the geometry – it is hard and subjective. I use the concept of “polarity” when using the arcs in that I will look for the measured moves and the arcs, etc. but after drawing them I THEN GO BACK TO THE PAST and see if it respected it from a support or resistance perspective. From that angle, the ratio’s might be different but they are harmonic so it “should” be helpful. Ultimately, its’ the PATTERNS that take the cake and then everything else is looking for more confirming indicators if able.
Thanks Bart. I have neither the time or skill to see these things. Thanks for opening my world view. cheers
Pingback: IBM – January 30, 2024 – Bart's Charts
Pingback: IBM – June 5, 2025 – Bart's Charts