JPM and tops of circles

if you do a search for JPM on this site you’ll see it’s pretty much ‘paused’ at every PATTERN out there but ultimately broke thru and kept going higher w/ strength. Good on em’!
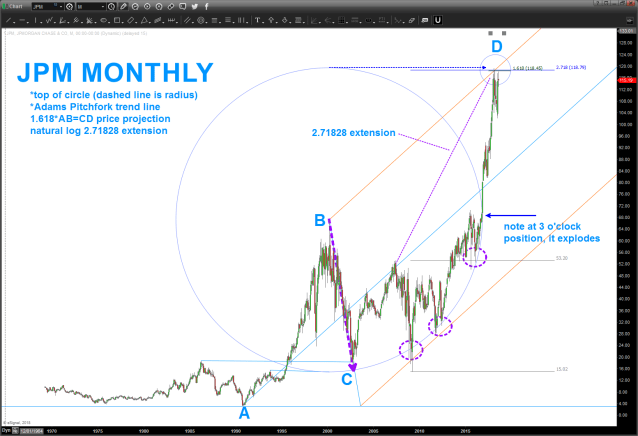
we are again at a PATTERN completing. Top of a circle, 1.618 price projection from the all time low, 2.71828 (natural log (found all over the Great Pyramid OBTW)) extension and some Adams pitch fork trend line stuff ..
so in the world I live in that’s the reason we have stopped in/around the 118 level.
note, when working w/ geometry look at how the market reacted to your work .. the dashed purple circles show how the ‘arc’ was support and when it hit 3 o’clock on the circle it exploded .. this just gives you credence that the arc is being respected.
note on the Adams Pitch fork that the ‘median’ line was responsible for resistance and support along the way up into these levels.
so what’s this all mean? lot’s of math in/around 118 so resistance is expected. is it a top or the top – I have no idea but I’d be watching carefully …
Bart

Pingback: update for the JPM geometry | Bart's Charts