“10% guaranteed, it will never go down …” – August 4, 2026


“I’m telling ya, just save a little money, put it in an index money and don’t worry about it. You are GUARANTEED (my emphasis) 10%, for life. Sure, it might go up and down here and there, but IT IS NEVER GOING TO REALLY GO DOWN.”
And … there you have it. I am not jumping onto the bandwagon until the level below on the XLP/NYA is taken out to the downside on a weekly close. I don’t think you need to wait for a monthly close below because, when it does crater and price goes below the levels indicated on the chart (sure looks inevitable – not gonna lie), I think price will really accelerate and then the blow off top is in the works and, frankly, those NEVER end well. What’s wrong w/ a little resistance and cooling off …? Use to be the norm.
So, I’m watching the Yen antics and it’s reminding me of my AMAZING childhood where we could roam thru our neighbors backyards at night, playing all night long w/ your gang of buds. Man it was awesome … so, one of the funnest games was, of course, kick the can. I’m neither a bull or bear. Honestly.
I’m just a pattern dude … my specialty (or at least in my head – ha!) is longer term patterns and there global dance w/in the circle of life – commodities, FX, fixed income and equities (CONUS and Global). It’s a way I relax at night … anyway.
This has been one heck of a topping / consolidation pattern … it’s never really cracked but the longer term patterns have held w/ some of them being defeated today and the past couple days / weeks. We have quite the bifurcated market – some indices are down double digits while others are at new highs. It’s rather bizarre … I’m not even going to try and explain it.
I’m just going to make it easy. (I hope – I’m trying)
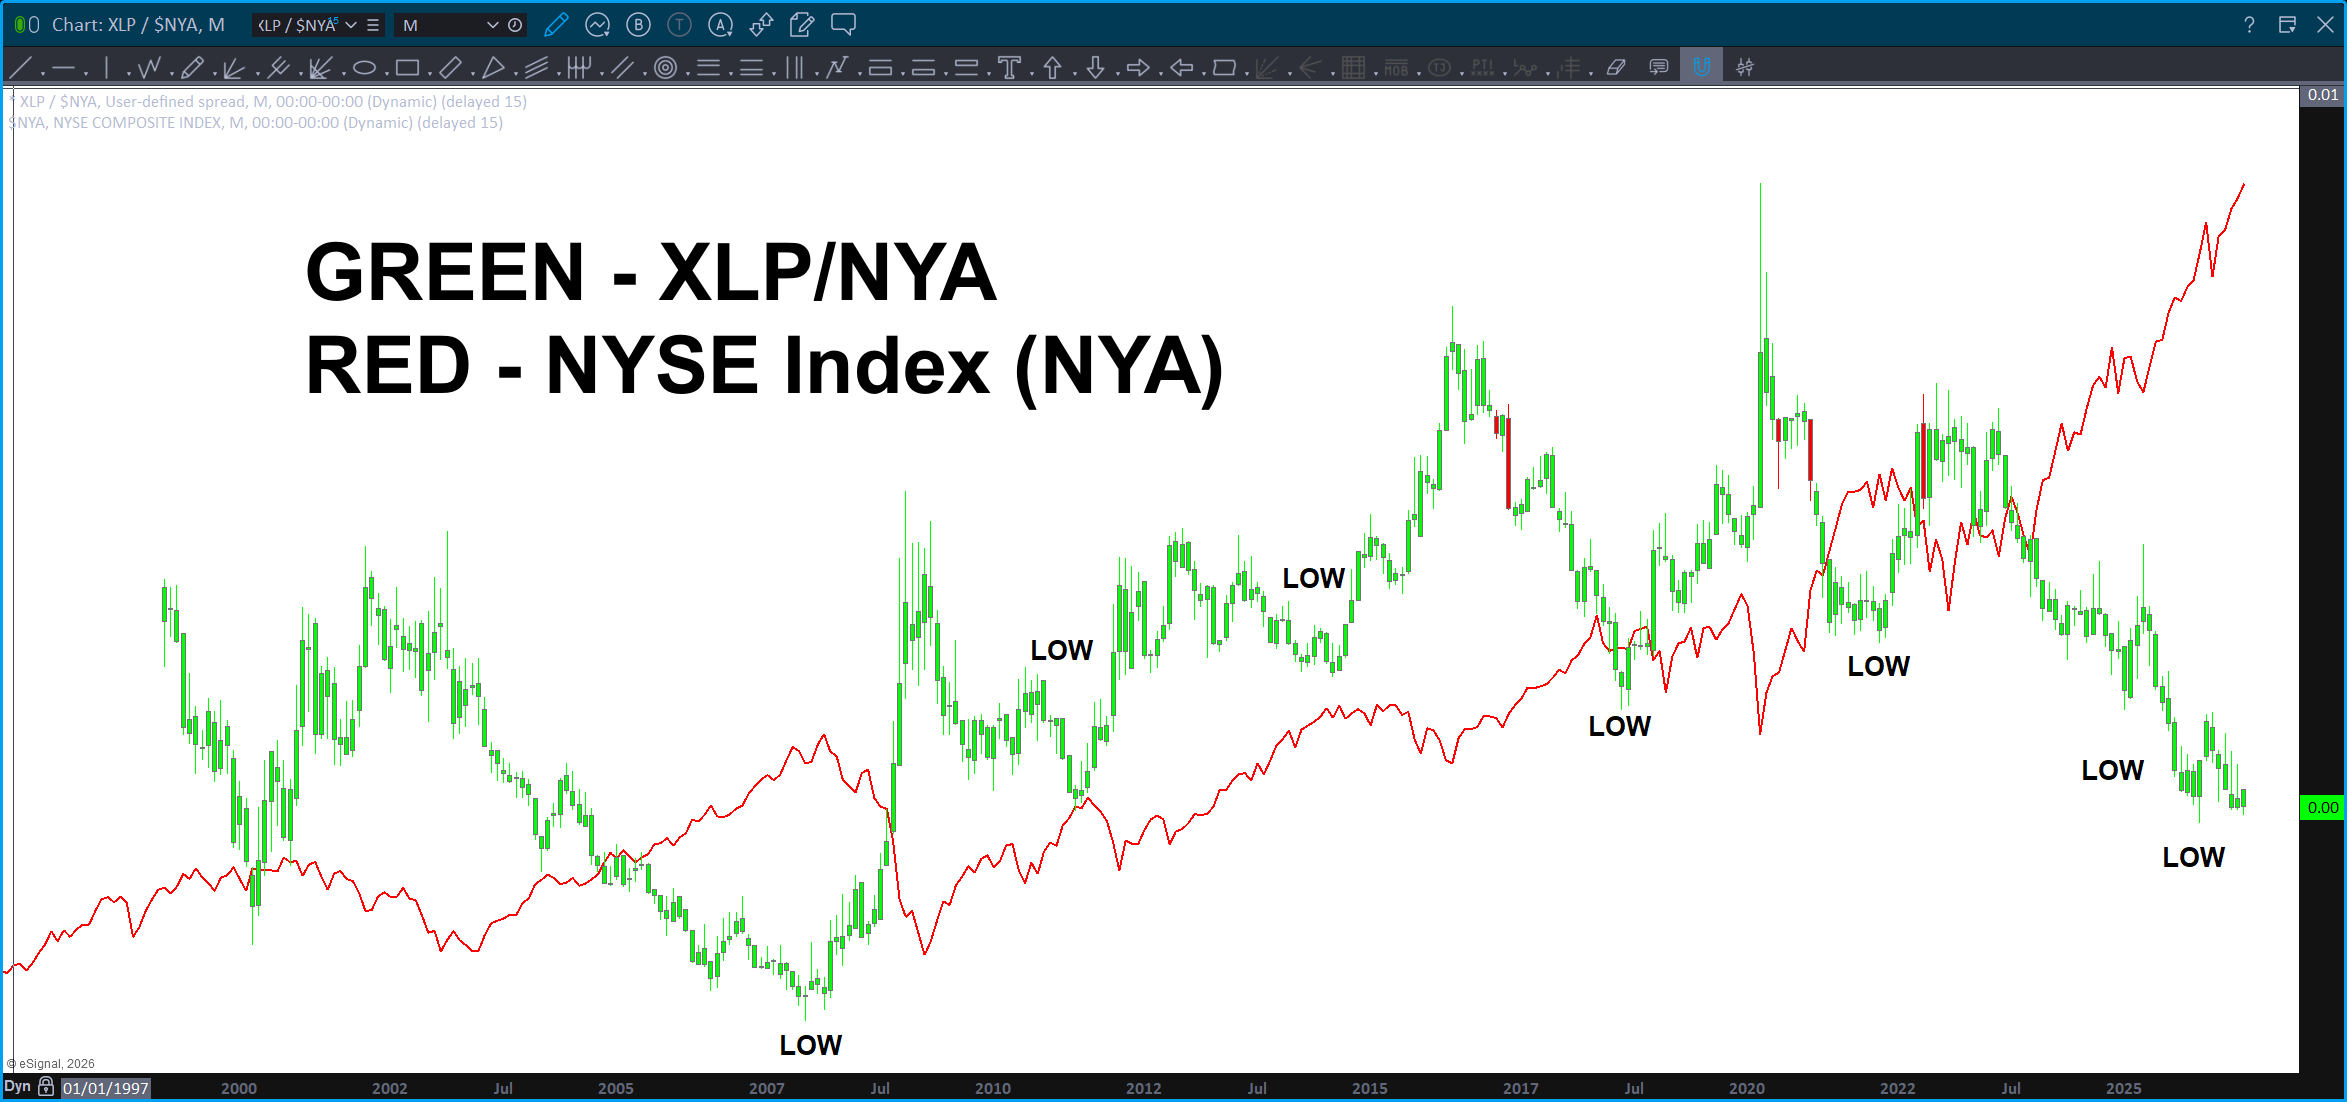
XLP/NYA – the KEY ratio to understand institutional flow of funds. What the heck are the big boys / girls doing? Are they RISK OFF – meaning equities UP UP and AWAY? In this case the ratio goes DOWN. Or, are they RISK ON – meaning equities DOWN. Why down? Because the ratio (XLP will be stronger – on a relative strength basis) will start to go UP because the big guns are moving into more conservative plays as most, if not all, of them need to be invested 100 percent of the time.
Now that we understand the importance of the ratio – I’ll show you the technical level where, the institutions are risk off. As in, the chart breaks thru an extremely important support level that SHOULD BE huge support. This support would cause equities to sell off because the ratio would start going UP as in the big guns are moving into conservative names to ride the storm out and stocks that represent the STAPLES of life start to outperform on a relative strength basis.
So, if all this is true, then the patterns should work with the ratio, correct? YUP. And that, my friends, is the best part of being a pure pattern dude because you see the patterns forming and, as hard as it is to NOT jump in with the consensus and the herd, you have some hard and fast rules about patterns – especially long term ones – that you don’t ‘just’ enter the market unless a PATTERN is complete.
Guess what – the PATTERN is in a MASSIVE SUPPORT ZONE. Below you will see a horizontal green box (representing support – the chart goes up) which represents the level I’m simply waiting to be defeated w/ a weekly close below. I’m drowning out the noise and simply watching and waiting to see which aspect of this great game of polarity will win out and then I’ll grab a board and ride that wave until the next pattern of significance comes along and will monitor and watch that wave …
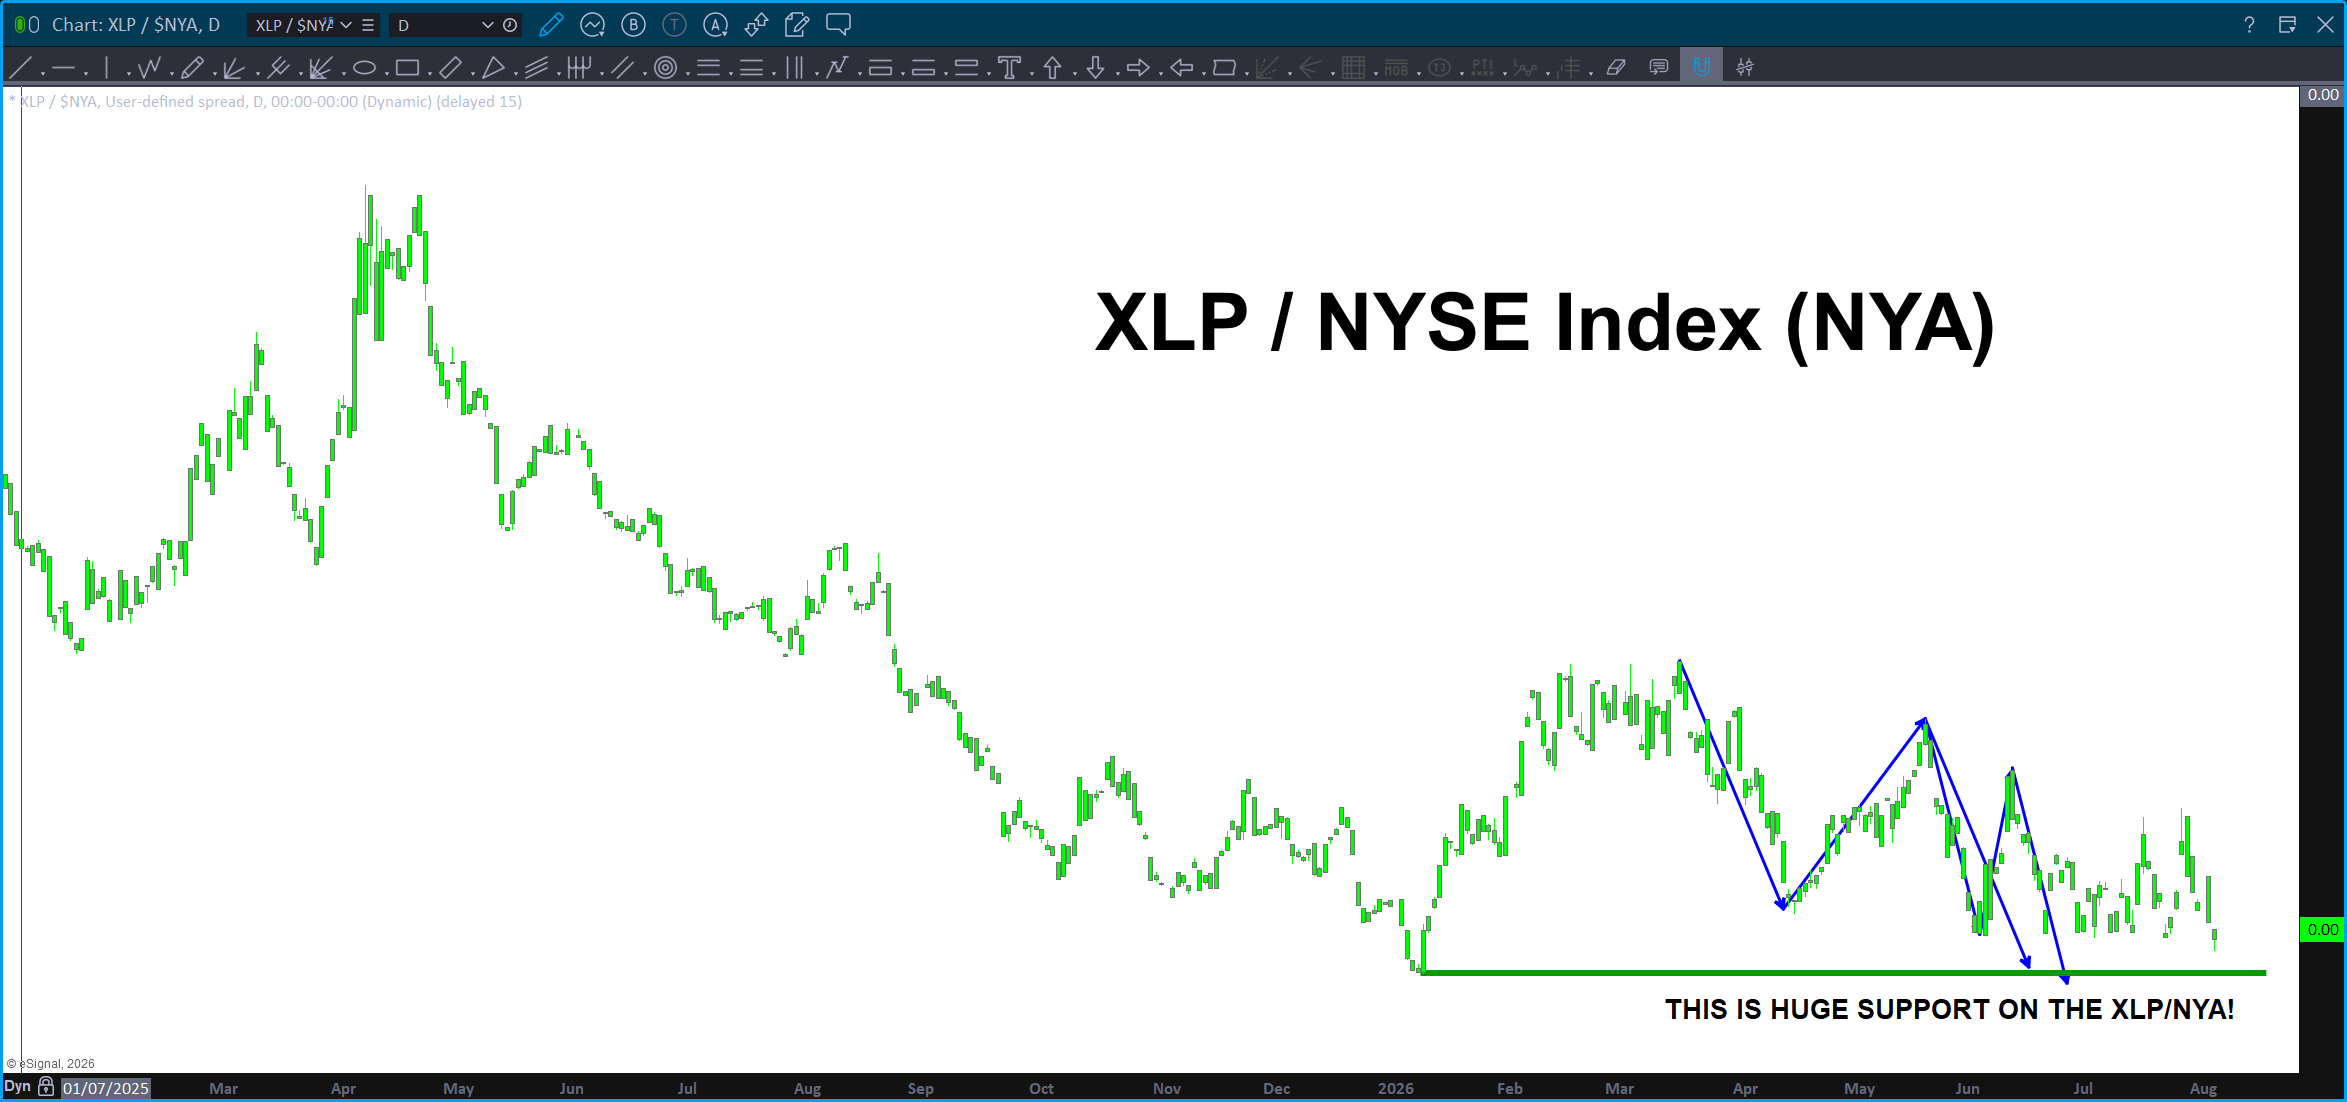
The above is the current DAILY chart showing the pretty huge support from a DAILY pattern level. For perspective this level is equal to the below chart showing a nearly perfect price (***LOG SCALE ***) and time corrective move from the last major correction which occurred in the history of this ratio:
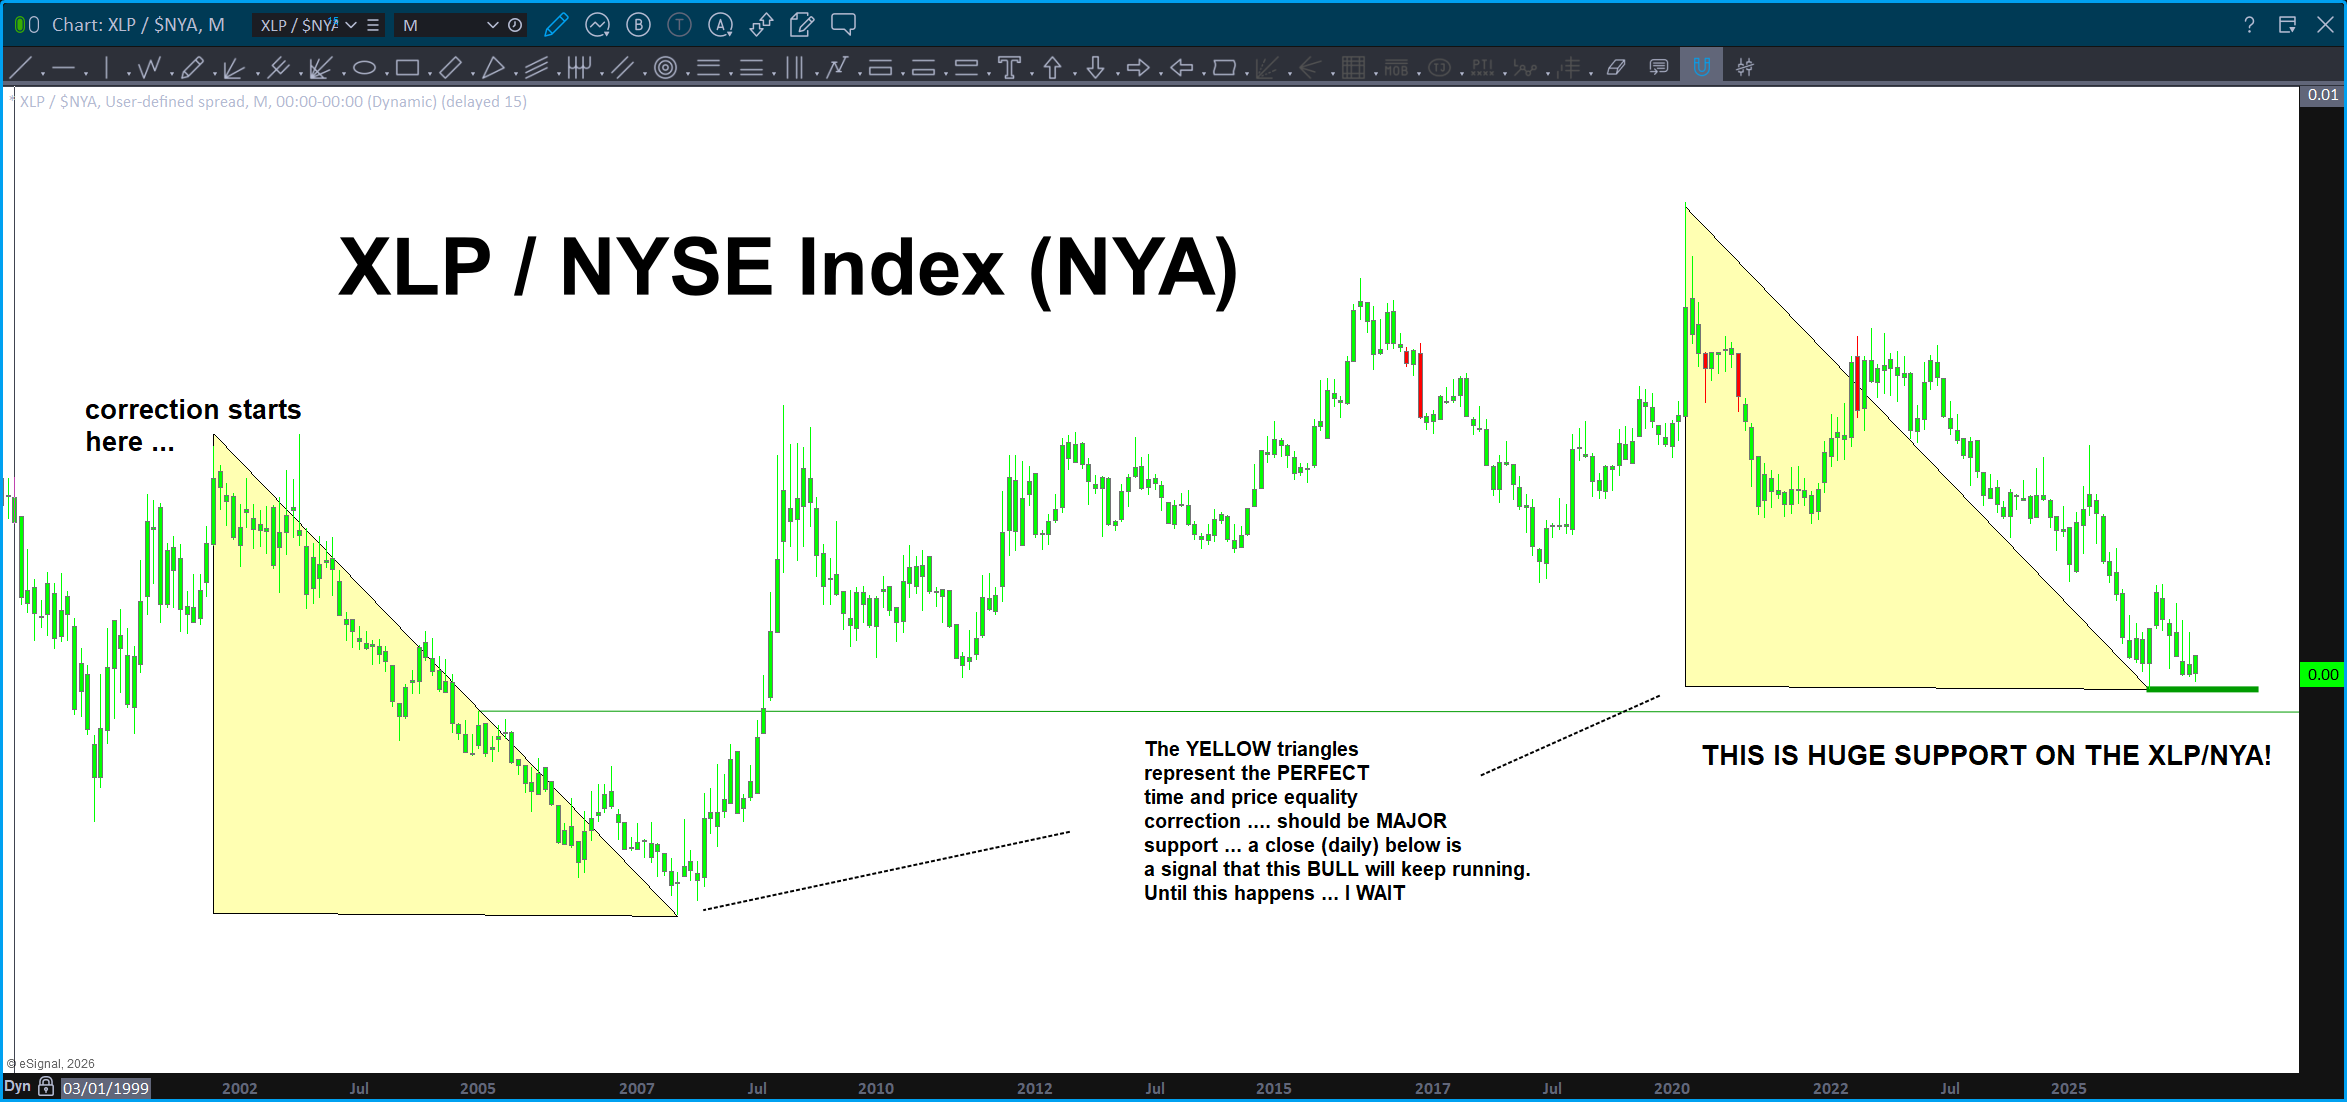
So, you can see, from the above we are in a major support zone. Do the harmonics really work on the ratio?
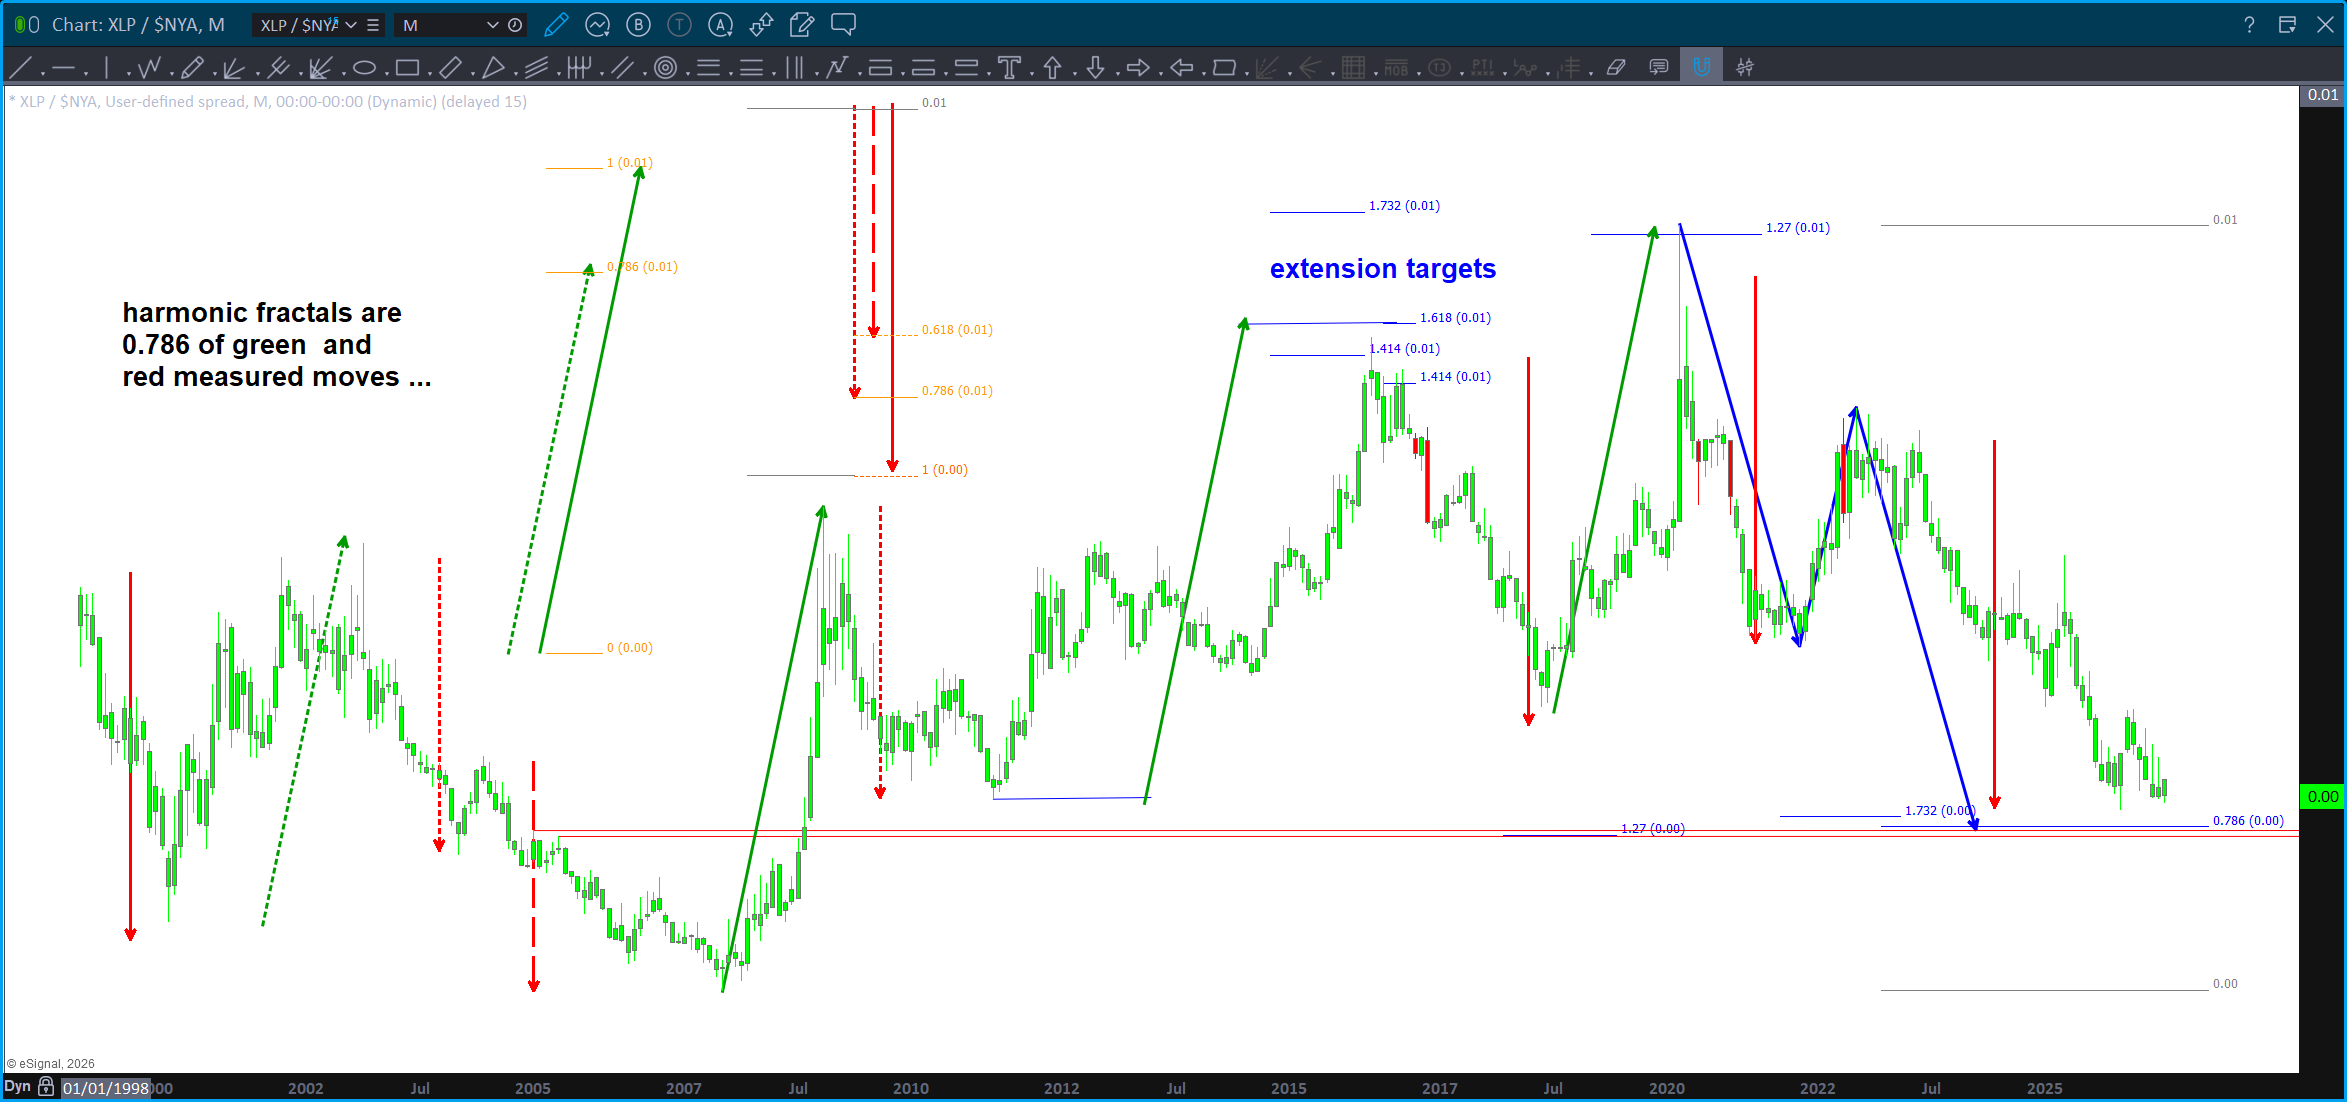
Above, I derived measured moves and their harmonics (all the fractals equal to .786) along w/ extension targets to show that the ratios DO work. As shown below, the PATTERNS do work on the ratio so, now you will understand why I’m WAITING for the crucial support zone where we find ourselves to be defeated on a weekly closing below. Check out this PATTERN:
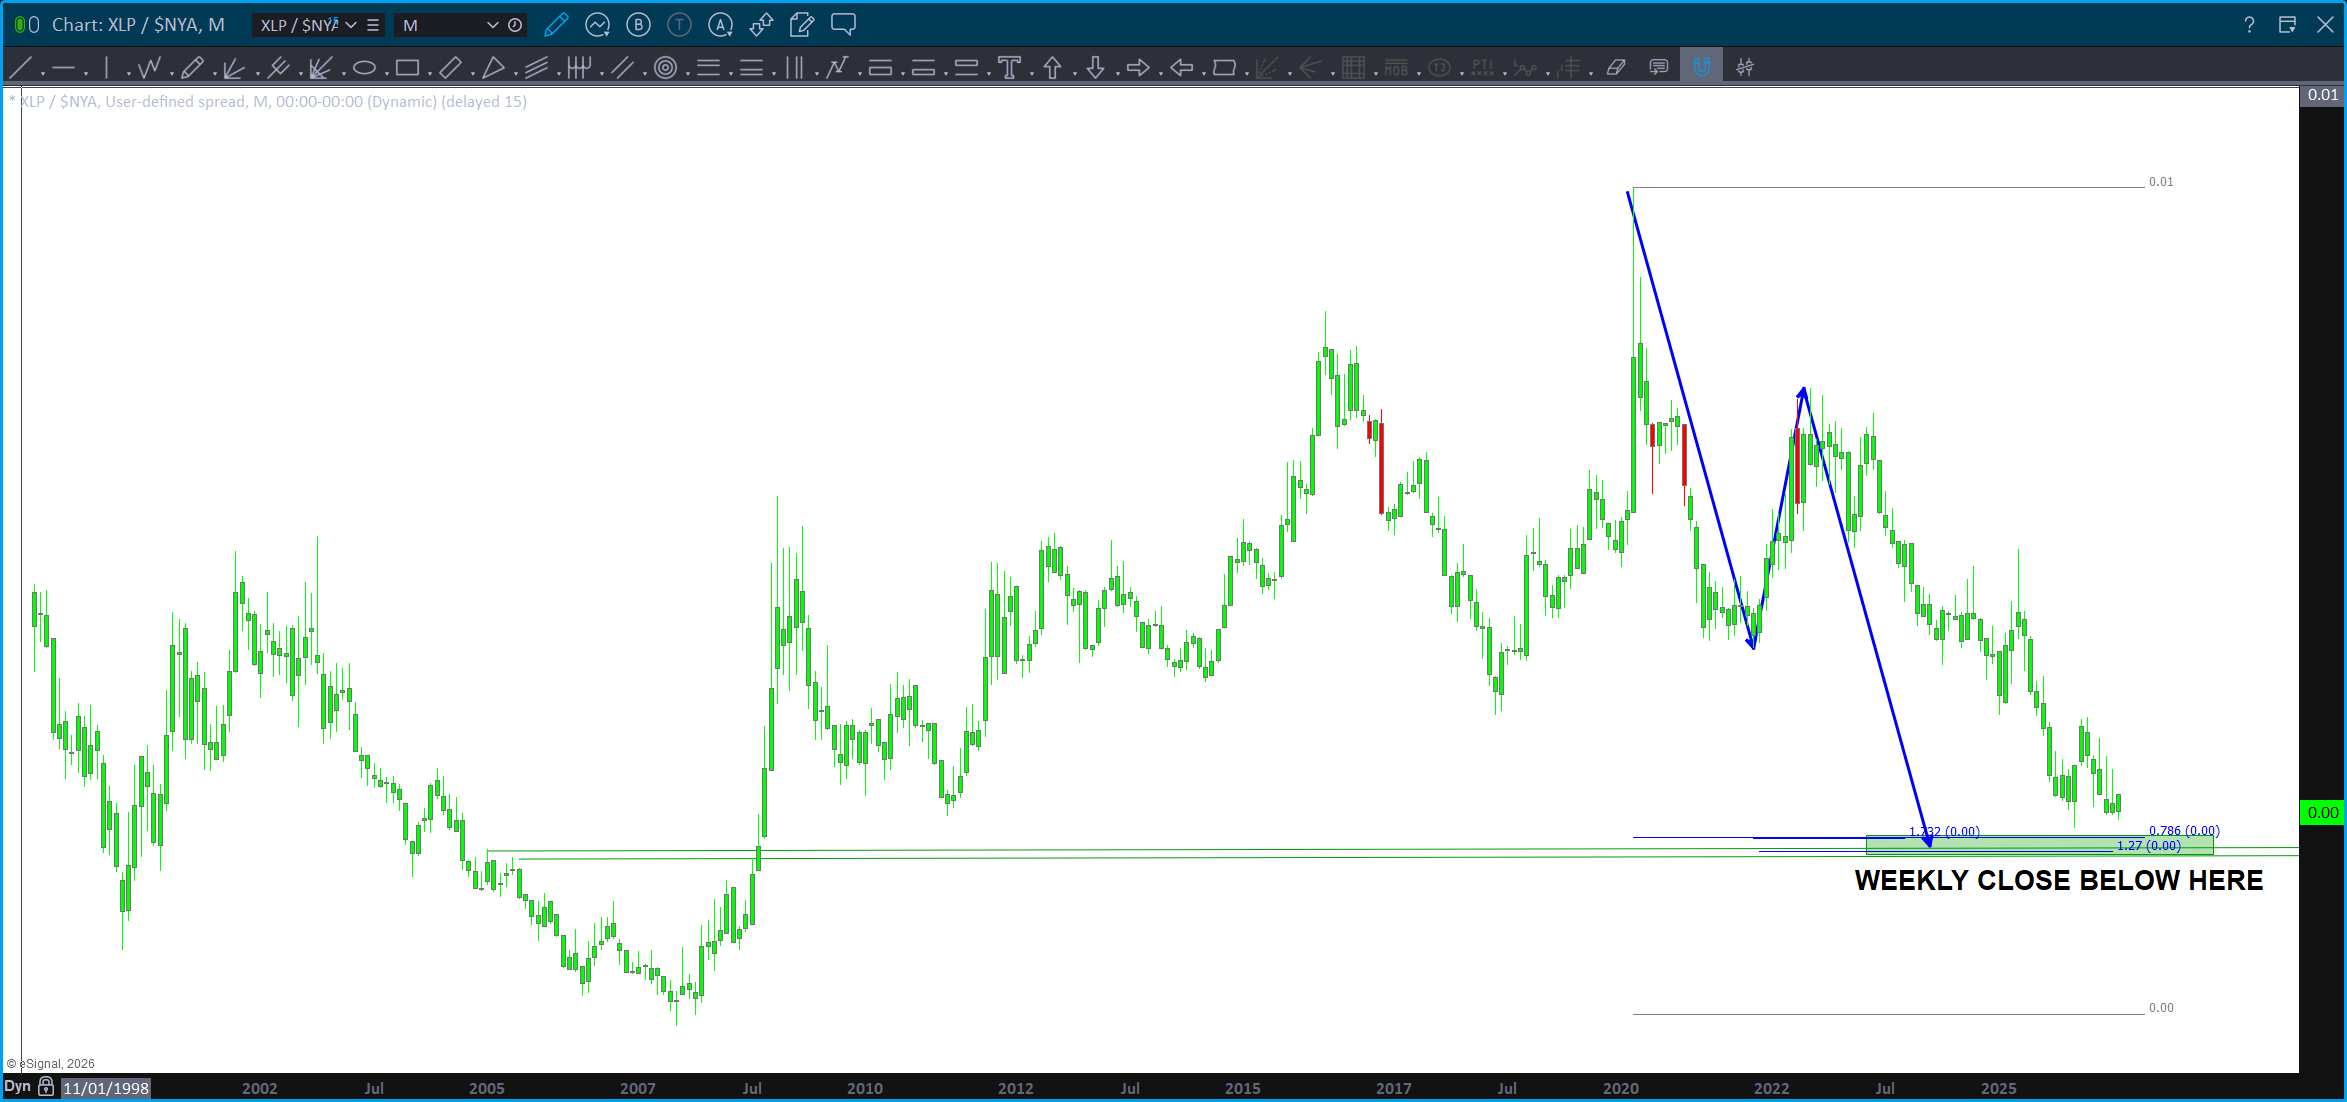
So, we certainly did complete a perfect LOG price and time correction, which has held. But, if we look above, we still have a strong support zone just a little bit below. That’s my line in the sand … until we get a weekly close below that level. I’m neutral and on the sides for equities. Enjoy the ride higher …
Remember, it will NEVER go down. It’s GUARANTEED!
Below, I have shown the amazing timing the ratio has provided, in the past. When it has found support, take notice of what happened to the NYA (red line). It topped – every single time. Remember, even though the NYA might have topped or bottomed, other markets might be ahead or behind but they will all, eventually, fall in line. Hence, my comment above about the fractured nature of the markets from an equity perspective.