Crude Oil – September 08, 2026

Well here we go … below is a ‘classic’ SELL PATTERN which means when it hits the level shown in the red box – it’s time to sell. Pretty simple, yes?
Take a look around you … are you REALLY going to step in front of the crude oil train? And that is why I say the patterns can tell you just as much about where you are as where you aren’t. Take a look at the harmony of this chart … every single – big – move up has been about the same measured move and they go right into the pattern sell area. I like that – measured moves into pattern area with a projection. Folks, this is a NICE SELL CRUDE OIL.
However, this is where it gets interesting. If this pattern FAILS then it’s sort of a big deal because, technically, this is saying the underlying trend of higher crude oil prices is STRONG and geopolitically, I would imagine something has gone wrong. Why not? Right? If crude oil prices smash right thru a beautiful sell pattern then ‘something’ has probably happened. Right?
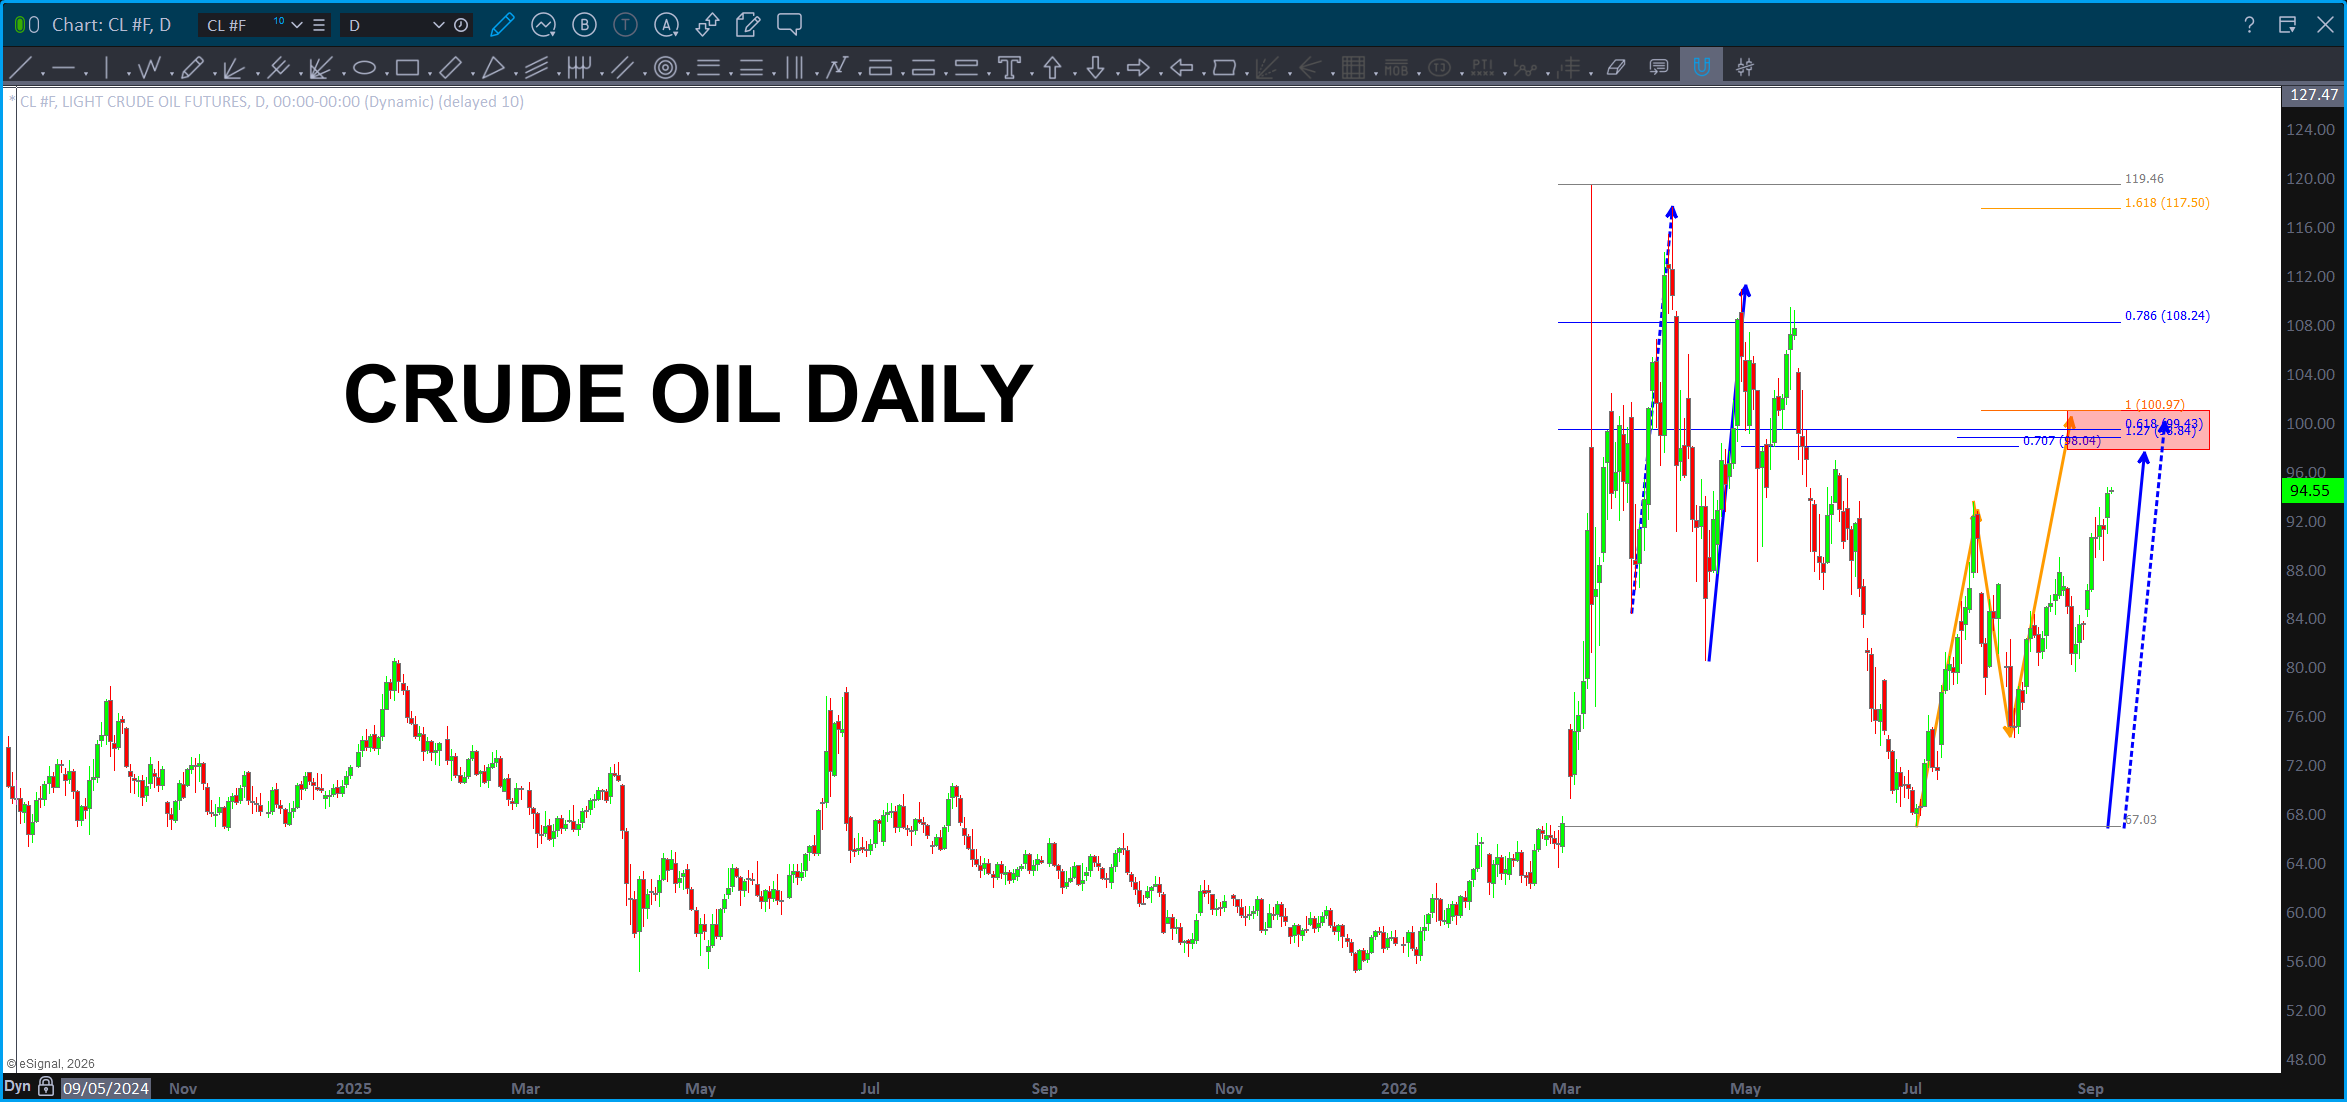
Conversely, if it hits that level and smashes lower for a SELL, then something wonderful might have happened… right? Why not?
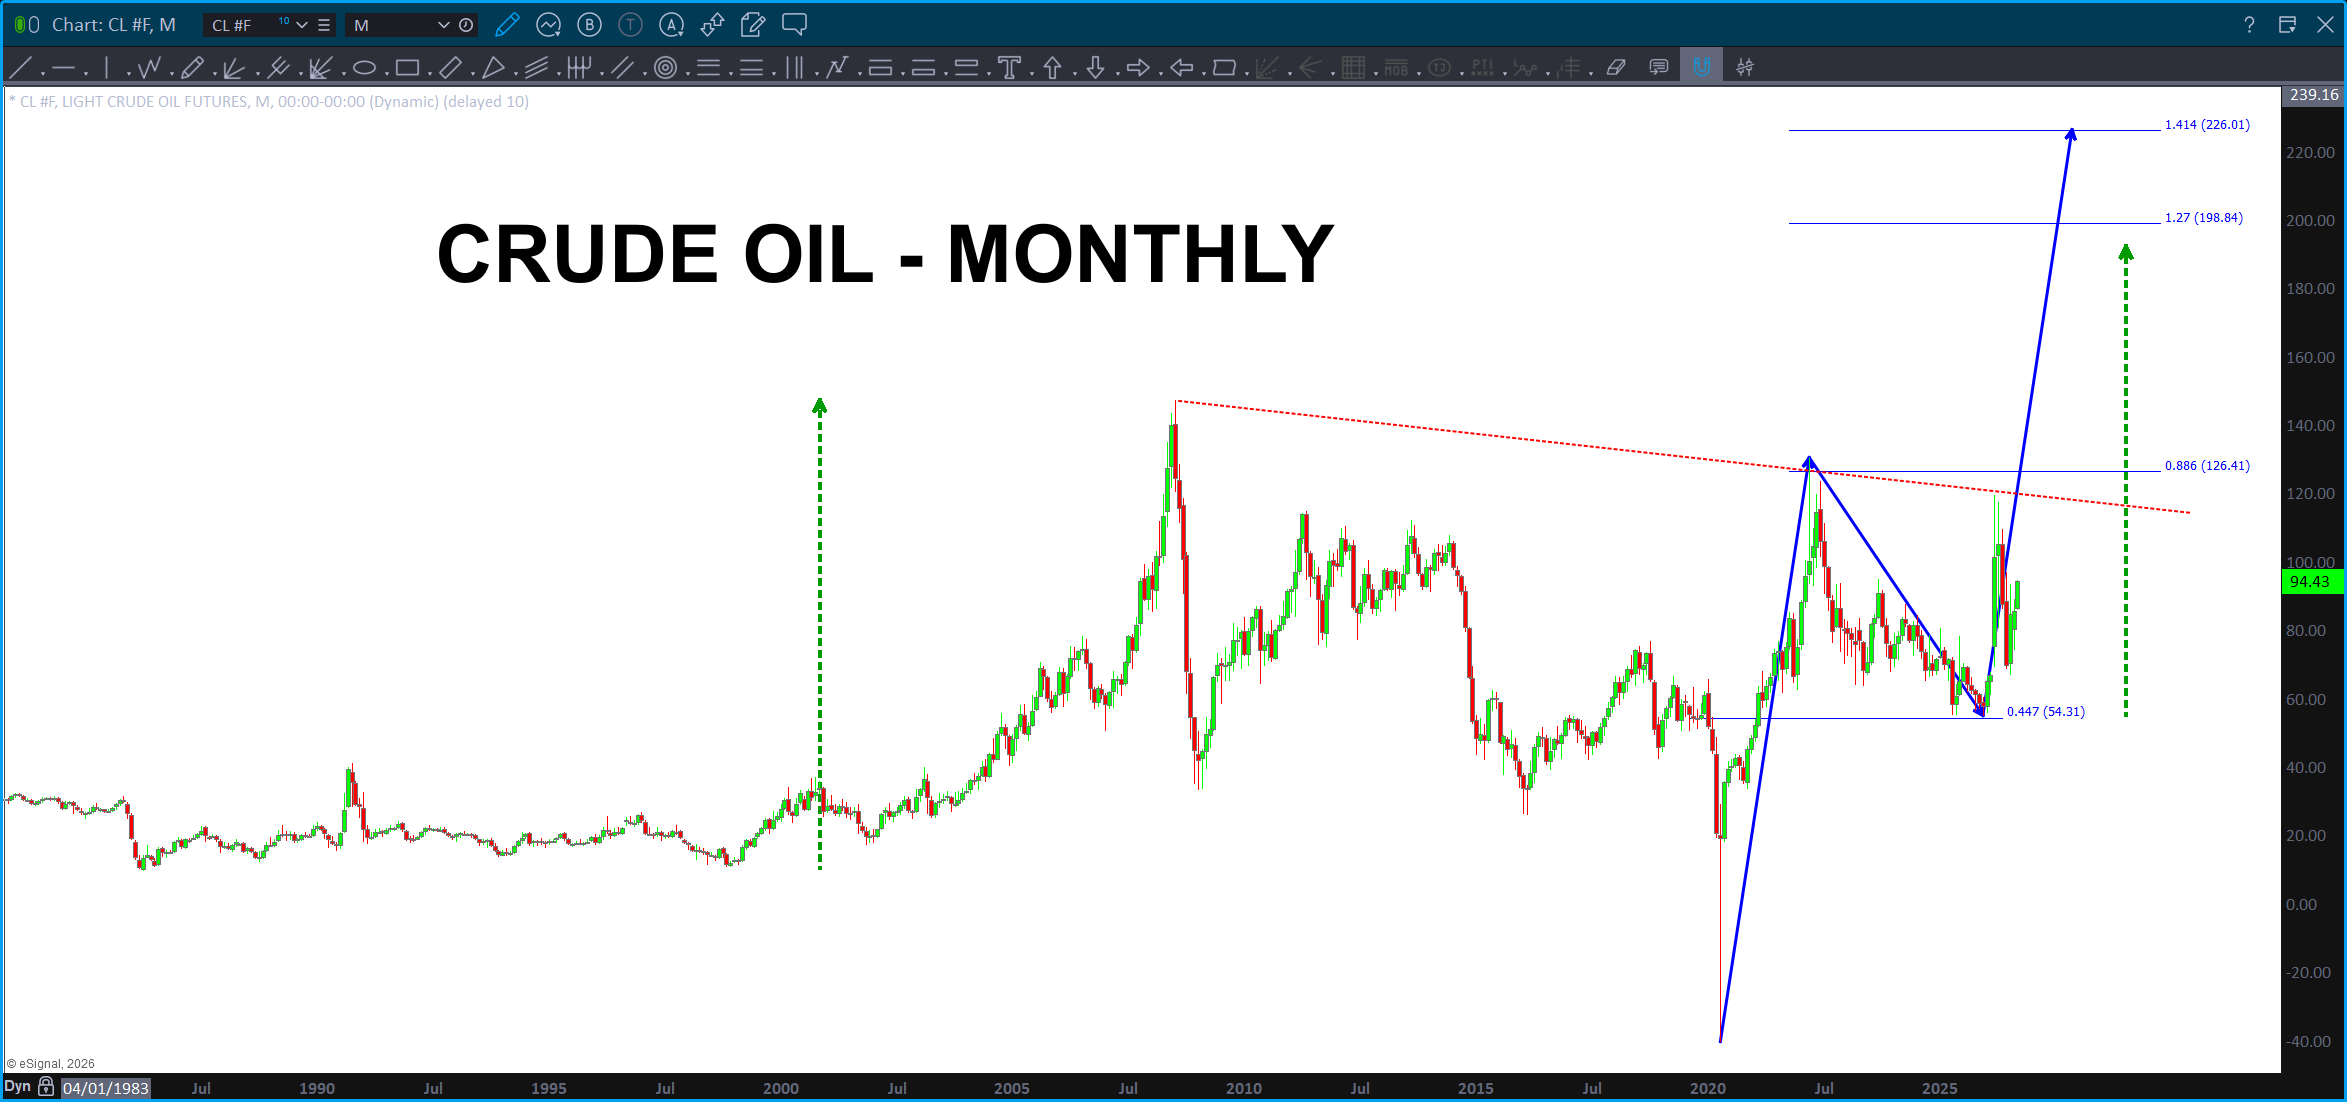
Now, if we do smash thru this level on Crude then the higher probability ‘bet’ is that crude continues trending higher and those longer term monthly targets are below. I’m just charting what I see so don’t shoot the chartist but can you blame me? right? Why not?