Japan (again) – September 9, 2026

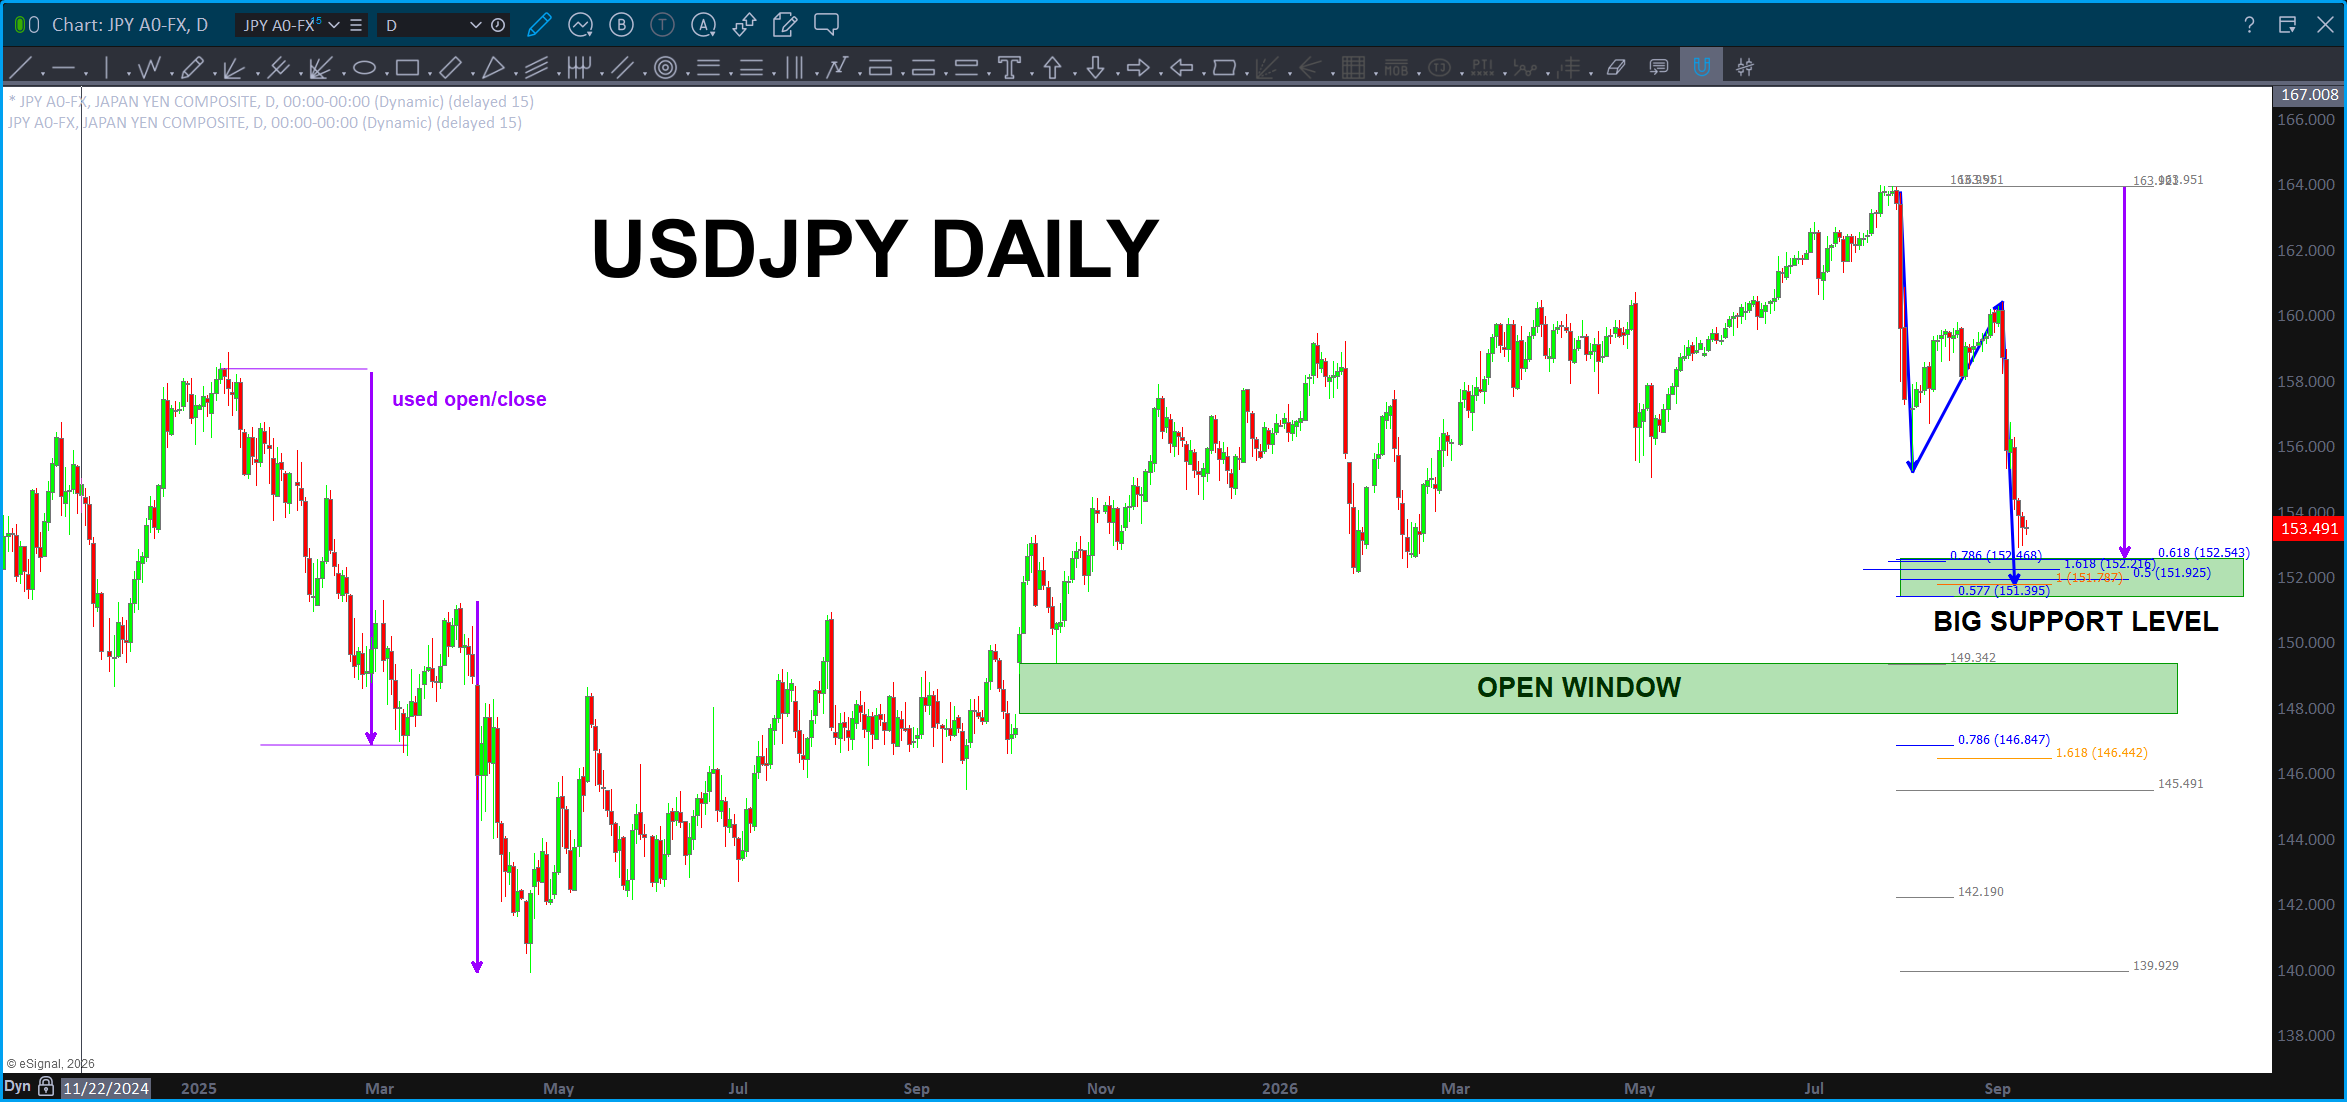
We have a PRETTY BIG level coming into play for the USDJPY:
I do not understand what Bessent is doing. I have one very good friend, extremely intelligent, who’s telling me that Bessent is doing amazing work. I believe him.
I have another analyst, world renown, who is saying the exact opposite. I believe him.
So, I do not understand what Bessent is doing. Here’s what I SEE ….
The YEN is has been selling off, probably causing some consternation in the carry trade peeps. That being said, we have a VERY important support zone for a number of reasons. The first being the purple measured move – the BIG moves were all governed by those measured moves. Second we have a nice ABCD that comes into the green zone followed by a confluence of ratios. Should be some nice support …
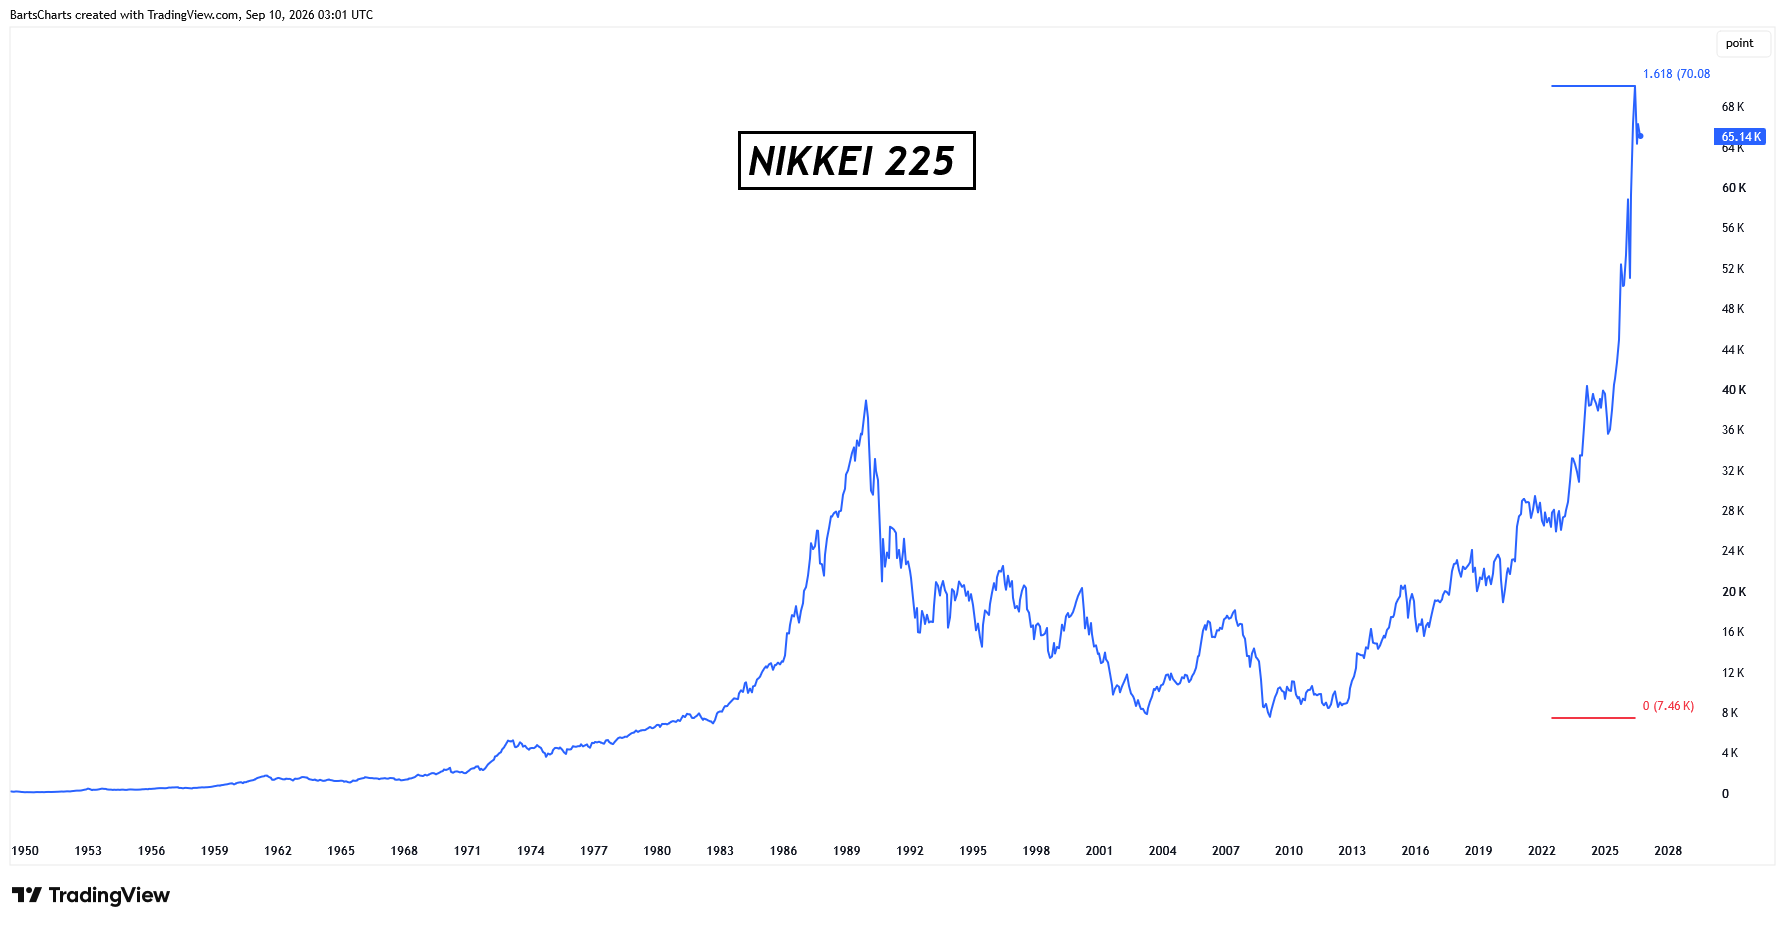
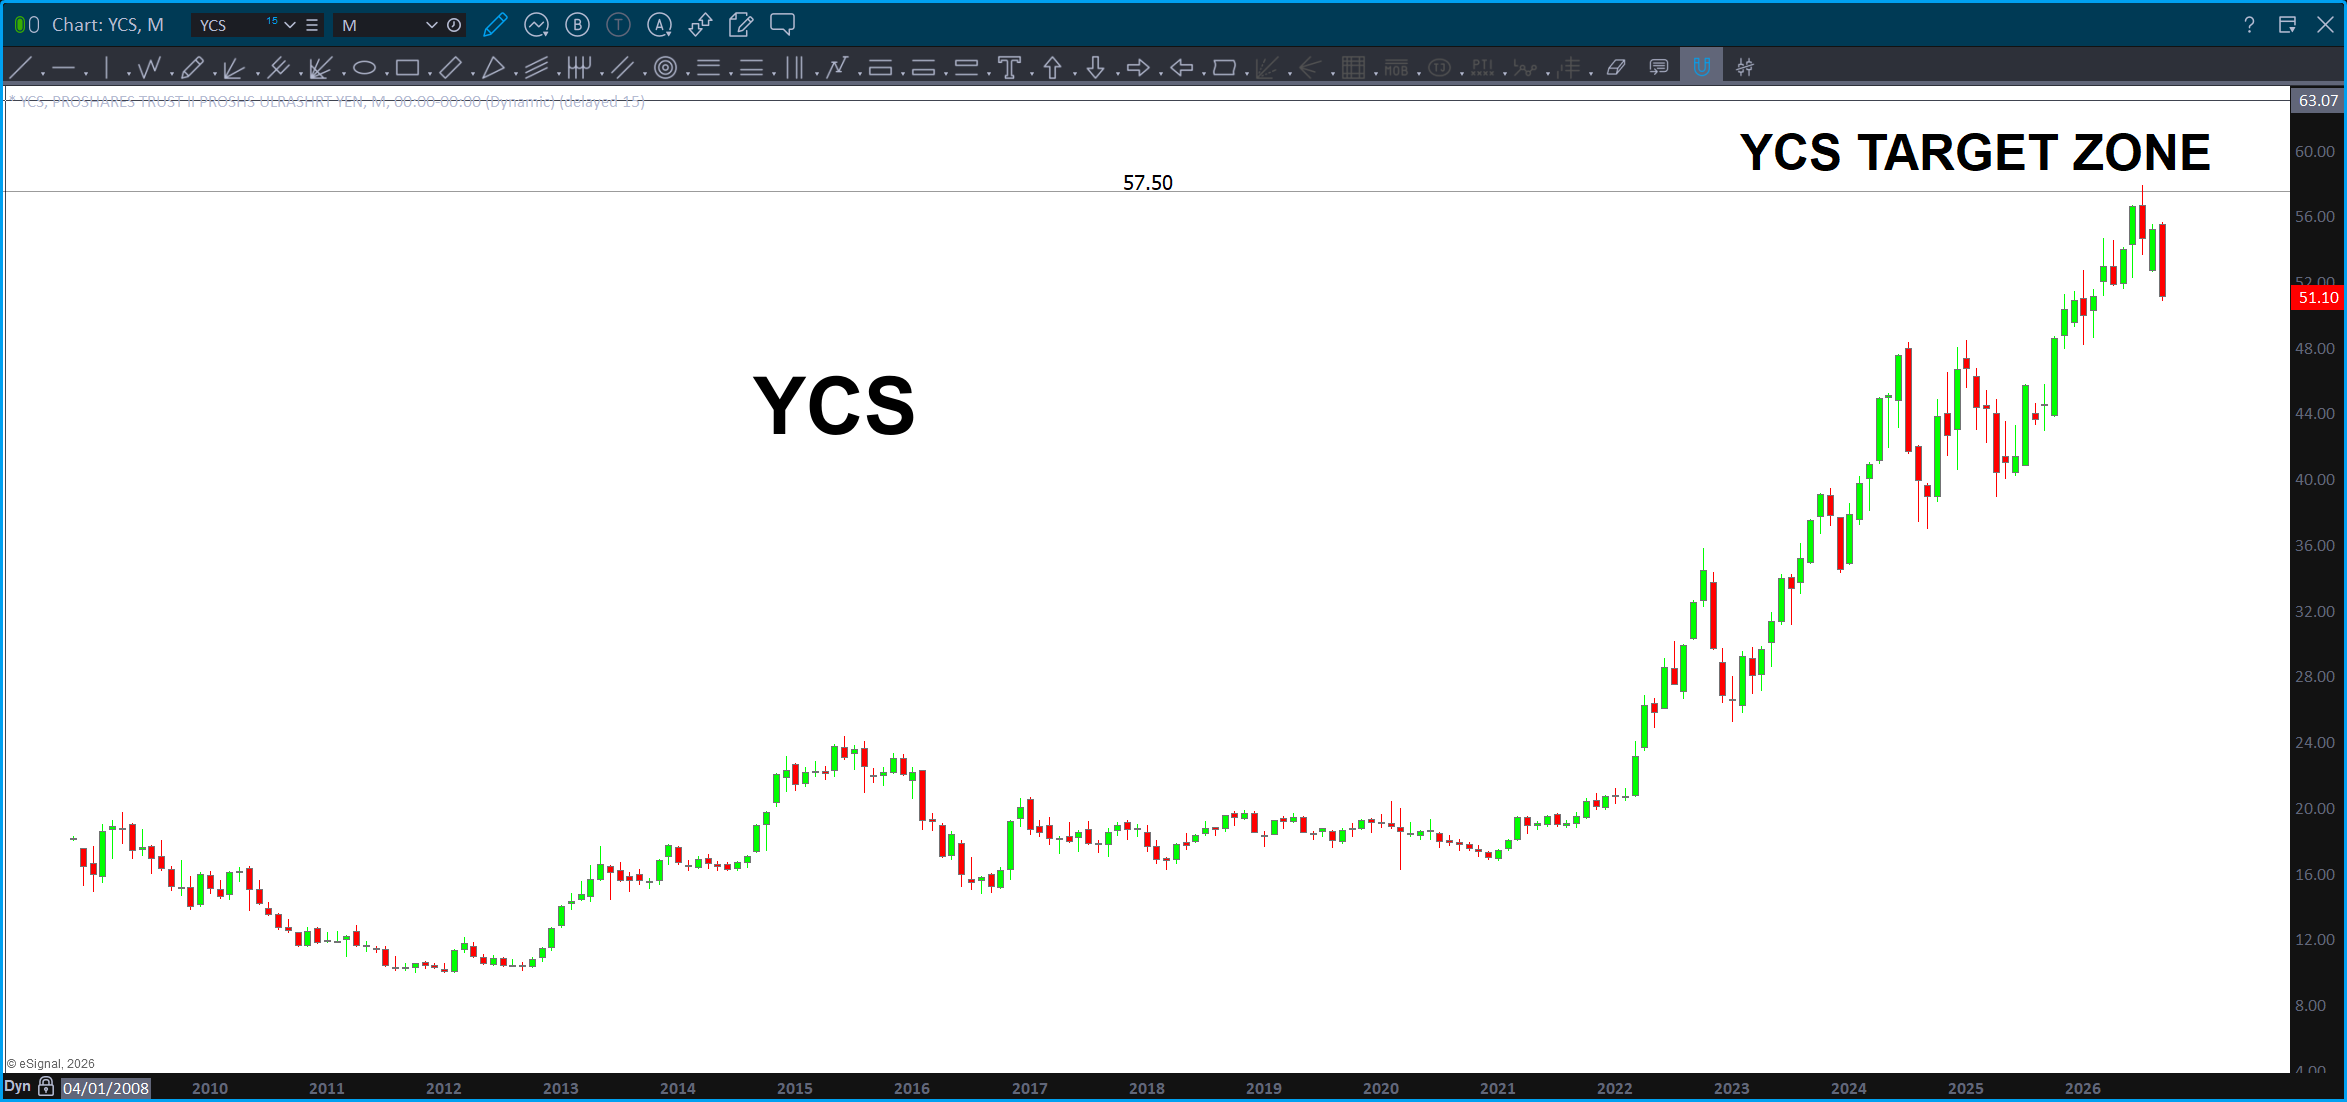
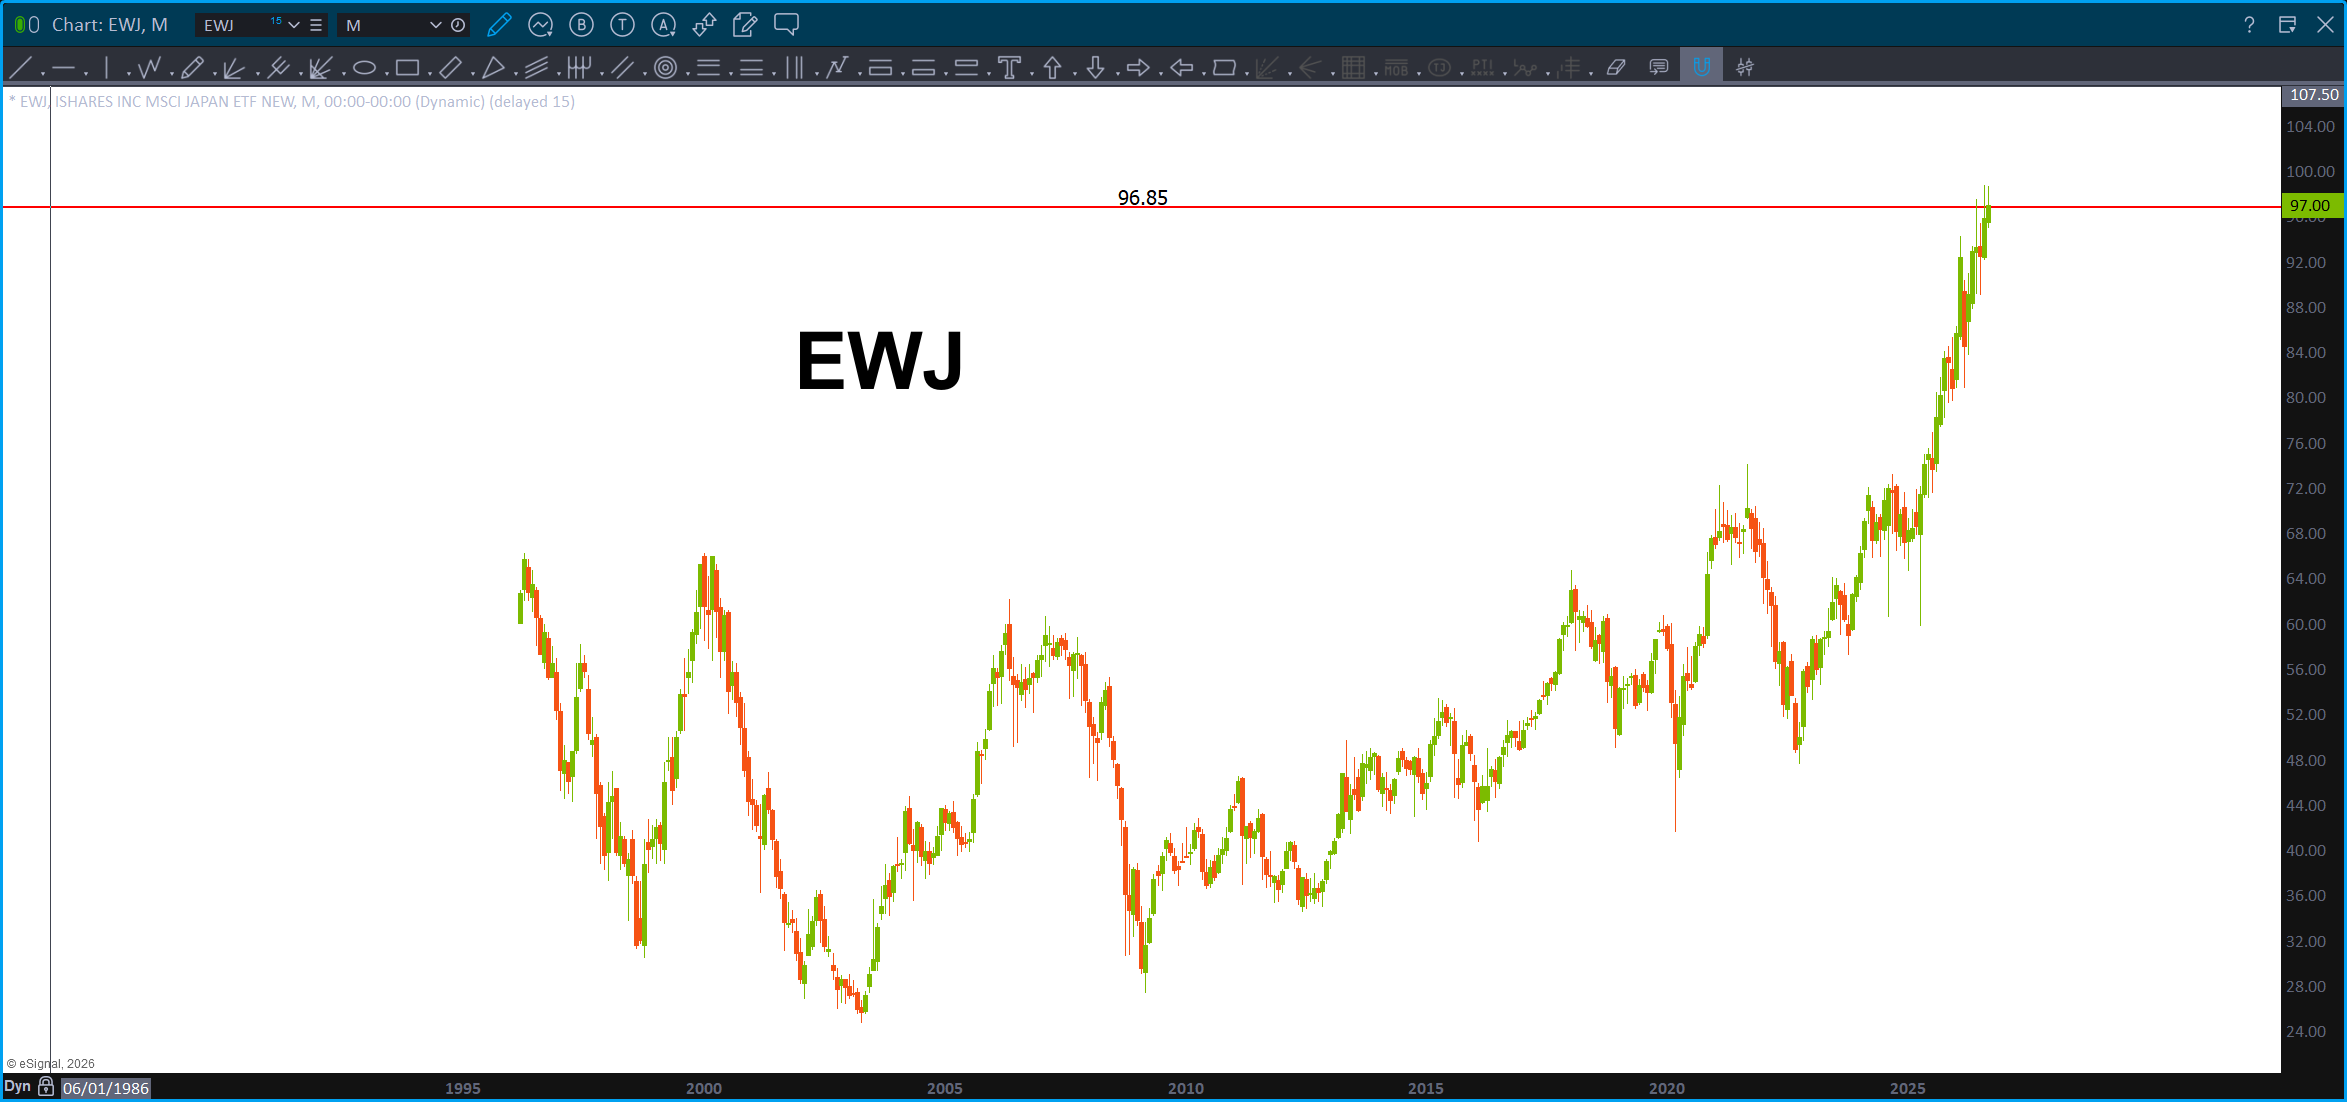
I think it was July (has it been that long ago?) that I put some charts up about the Nikkei and Yen w/ patterns that would show Yen Strength (that is happening) and the Nikkei would also sell off. That is happening along w/ the corresponding ETF’s YCS and EWJ. I erased the ‘crayon work’ that went into the charts and just put the updated charts w/ the target zone below:
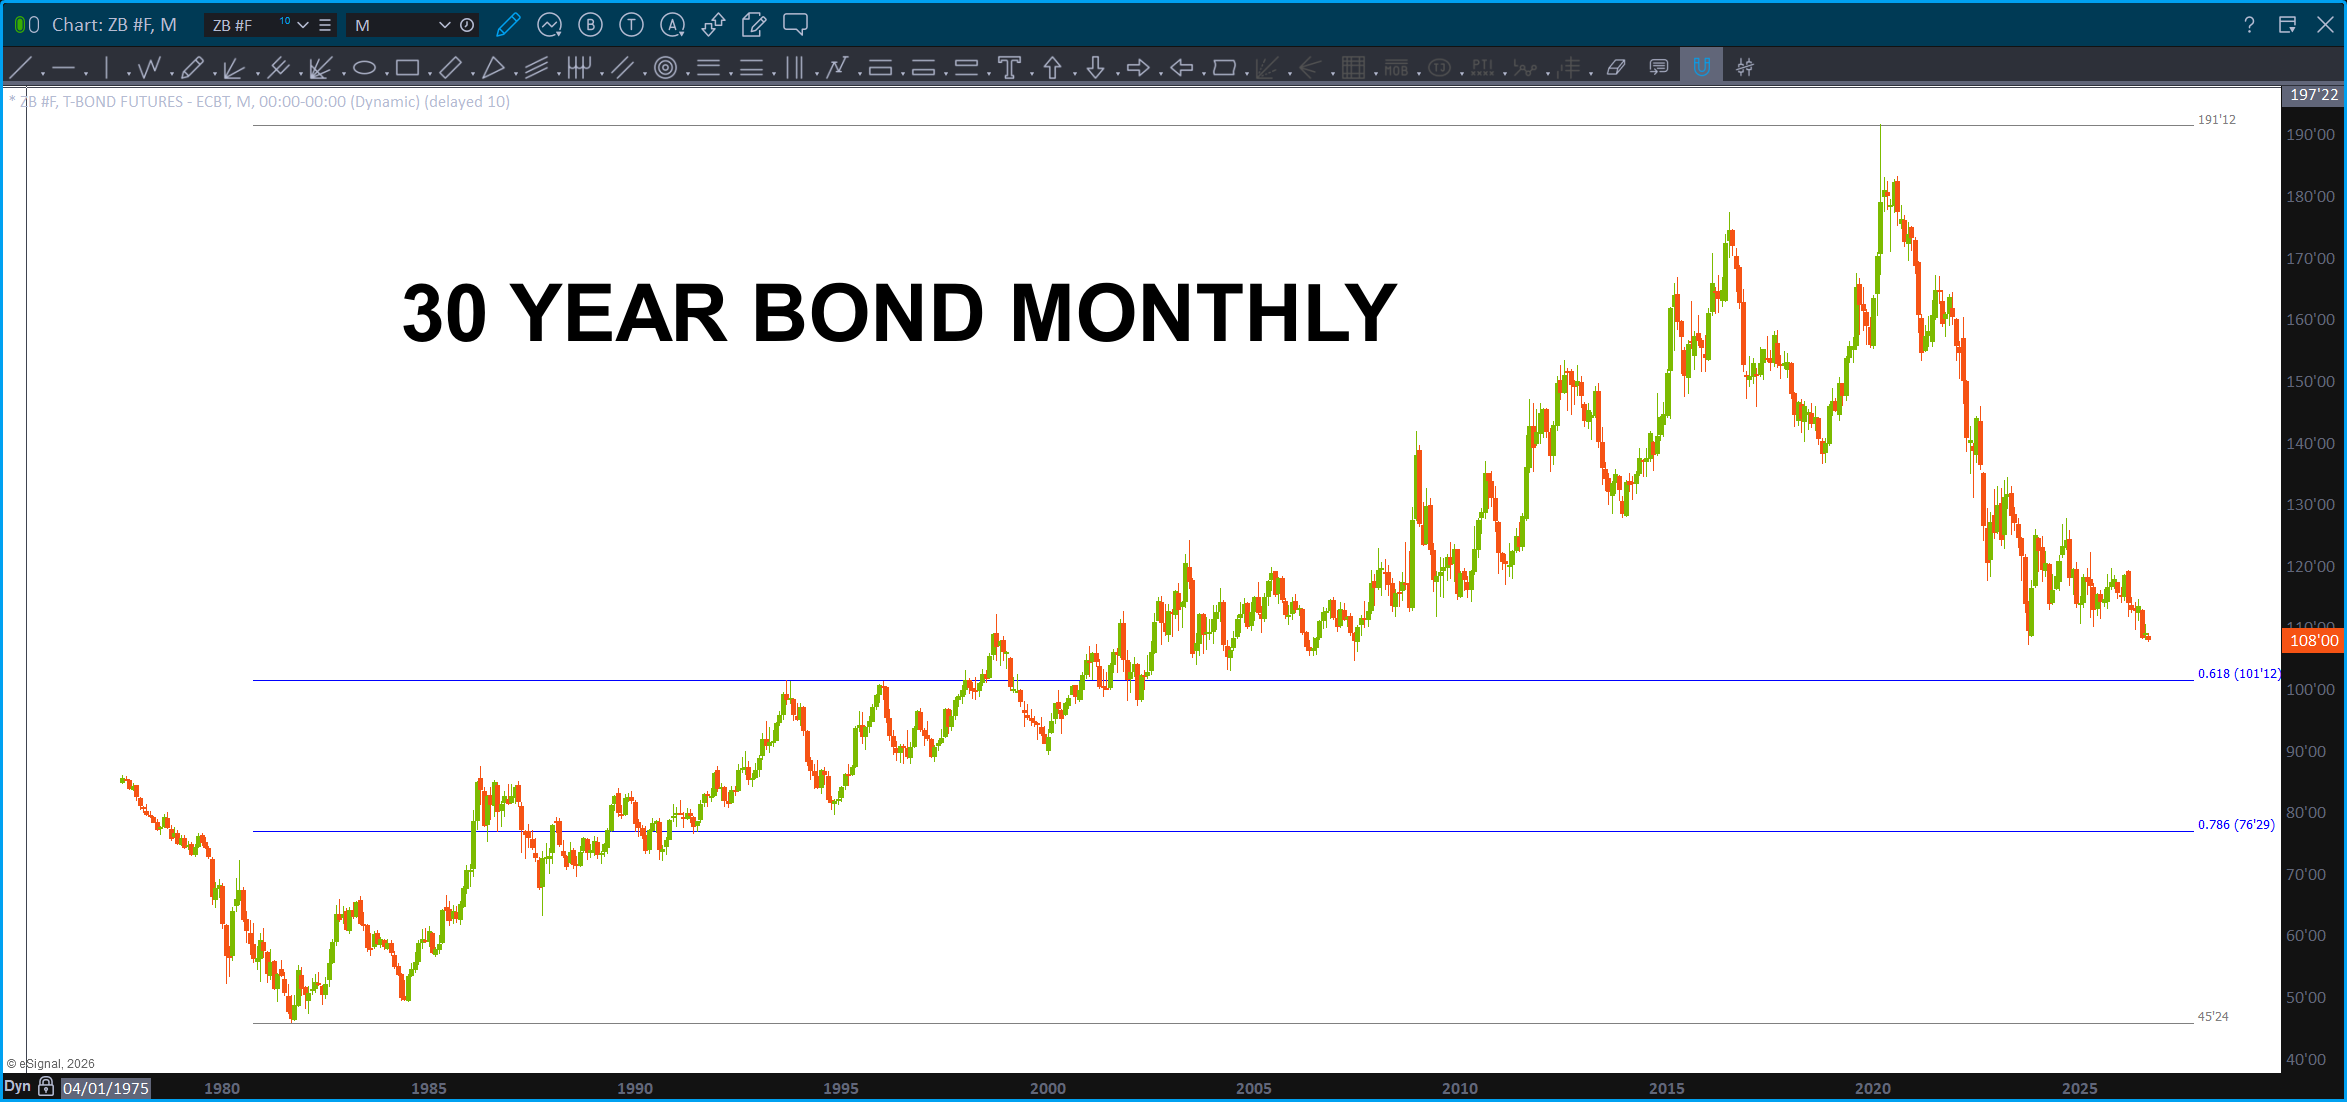
Last, I still like my target down lower on the Bonds for a BIG BUY. That is what I see … That is what I will trust and execute the deployment of capital on BUT what do I believe? Well, that sure seems like a LONG WAY down, especially in this current geopolitical climate. My doubting Thomas says – would ‘they’ (who ever that is) really let the bonds go that low? Guess we’ll just have to wait and see. (Note, there are a lot of reasons of the below level – in addition to the all time low .618. “Everyone” will be saying this is the reason … well, it certainly can be but there are other ratios that are present in / around this level which make it a VERY attractive level to BUY BONDS. Also, remember, I’m counting this as a 5th wave in progress so 1/ it will be an ending wave for a good monthly to year+ bounce and 2/that means that the upcoming support zone is only that -support – as 5 waves down ‘usually’ brings a 3 wave corrective move up followed by a smashing C wave lower so … I plan on using this as an opportunity to hawk the rates for refinancing and anything that get you a good lock in before, unfortunately, interest rates go to double digits in the following years.
So, just think about what we have going on … from a true non-fundamentalist point of view:
1/ super cycle in the ‘softs’ starting – I’m long Corn and DBA 2/ a huge El Nino that is breaking records and forecasted to be the strongest on record – whatever the heck that means 3/ Straits of Hormuz – not only for the oil but also for fertilizer … then 4/ geopolitical situations, not to mention some Orbs, American Codes and blah blah blah.
The reason for my diatribe – just watching and trusting the patterns. Some work, some don’t but they will help us fit an upcoming narrative that, quite frankly, is going to be one heck of a ride.
Shaping up to be in/around 10/5-10/8 for the fireworks to begin …
Buckle Up Buttercup …
Mirror On the Wall Which Chart is the Fairest of Them All …?

30 year bond support failure along w/ a corresponding FAILED USDJPY support zone … ? Who knows but here’s what I can tell you …. one of the patterns WILL fail. Crude Sell? Yen support zone? Japan Equities, small hookup and climb higher thru the patterns? Who knows. The circle of life (fixed income, equity (global and CONUS), Fx, commodities) dances to a certain rhythm and beat. In this case, for it to continue, one of these patterns will fail. That will give us a very good idea on where we are and what we can do about it …
Note, just a pattern dude, this could end up being HUGELY BULLISH for US Equities …
I SEE the patterns, what I believe doesn’t matter. I SEE the patterns and also SEE that one of them will fail. I have no idea which one …
Bart


Hi Bart,
I came across your work via JC’s morning show a couple years ago. I remember that you mentioned a few books and one ultimate book by Constance Brown. I reached out to her soon after your guest segment and emailed her about this magnificent book. At the time, I put it on my Christmas wish list but totally got sidetracked and distracted. While I was going through my technical books the other day I recalled this encounter. When searching for the book tonight, I learned that Constance passed away last year. I just wanted to offer my condolences. I plan on getting her book to keep her memory alive.
Derek
Derek – thank you so much for taking the time to write. Connie was amazing and I had the unique opportunity to personally train w/ her at her trading desk multiple times. Beyond brilliant lady …
The book is amazing and … a beast! Be good – Bart
Interesting website-blog you have here, Bart’ ole chap, and evidently a pattern-attuned neurotype or INTP/EnTP unless I miss my guess… your anecdote and inference on the diagnosis of the market activity and technical-analysis/sociological speculations is definitely something I would love to find a community of similarly mentat-NTP/pattern pimps’ and data-deviants’ vrilly’ formidable virtuosos with whom to cross-compare notes or insights….this website might be a great resource for me in that sense and will check back in and continue browsing some of the freely given advice/information. Also, ☝🏻 one last thing. Yeah, I would humbly say maybe you’re not factoring in the case that, you know, like, there’s the Sanseito Japanese parliament-policy shift’s impacts on their banking/liquidity and market considerations thus impacting how they position themself (ahh no doubt you know what I mean) but also remember: all eastern powers (and limited to them either) are withdrawing assets of broader-former vested involvements in a couple areas… idk, there’s talk or rumour of like scarcity and contentious/precarious dynamics imminent regarding scramble for resources (some of which pertaining to quantum/electricybernetics and such as you and our colleagues are already aware I am guessing) but yeah, tasteful website, My good man, stay classy and stay incomprehensible to the normies.
John – amazing message – thanks for the comments and visiting the site. Just a humble dude looking at patterns. While I agree that there are some MAJOR macro moves occurring w/in the entire circle of life (fixed income, Fx, equities, commodities) I’m not smart enough to understand them so I just stick to the patterns. Sometimes they work, sometimes they don’t. Look forward to continuing discussions … Bart