TSLA (update) – April 5, 2023
Last post on TSLA: https://atomic-temporary-44460632.wpcomstaging.com/2023/03/08/tsla-update-march-08-2023/
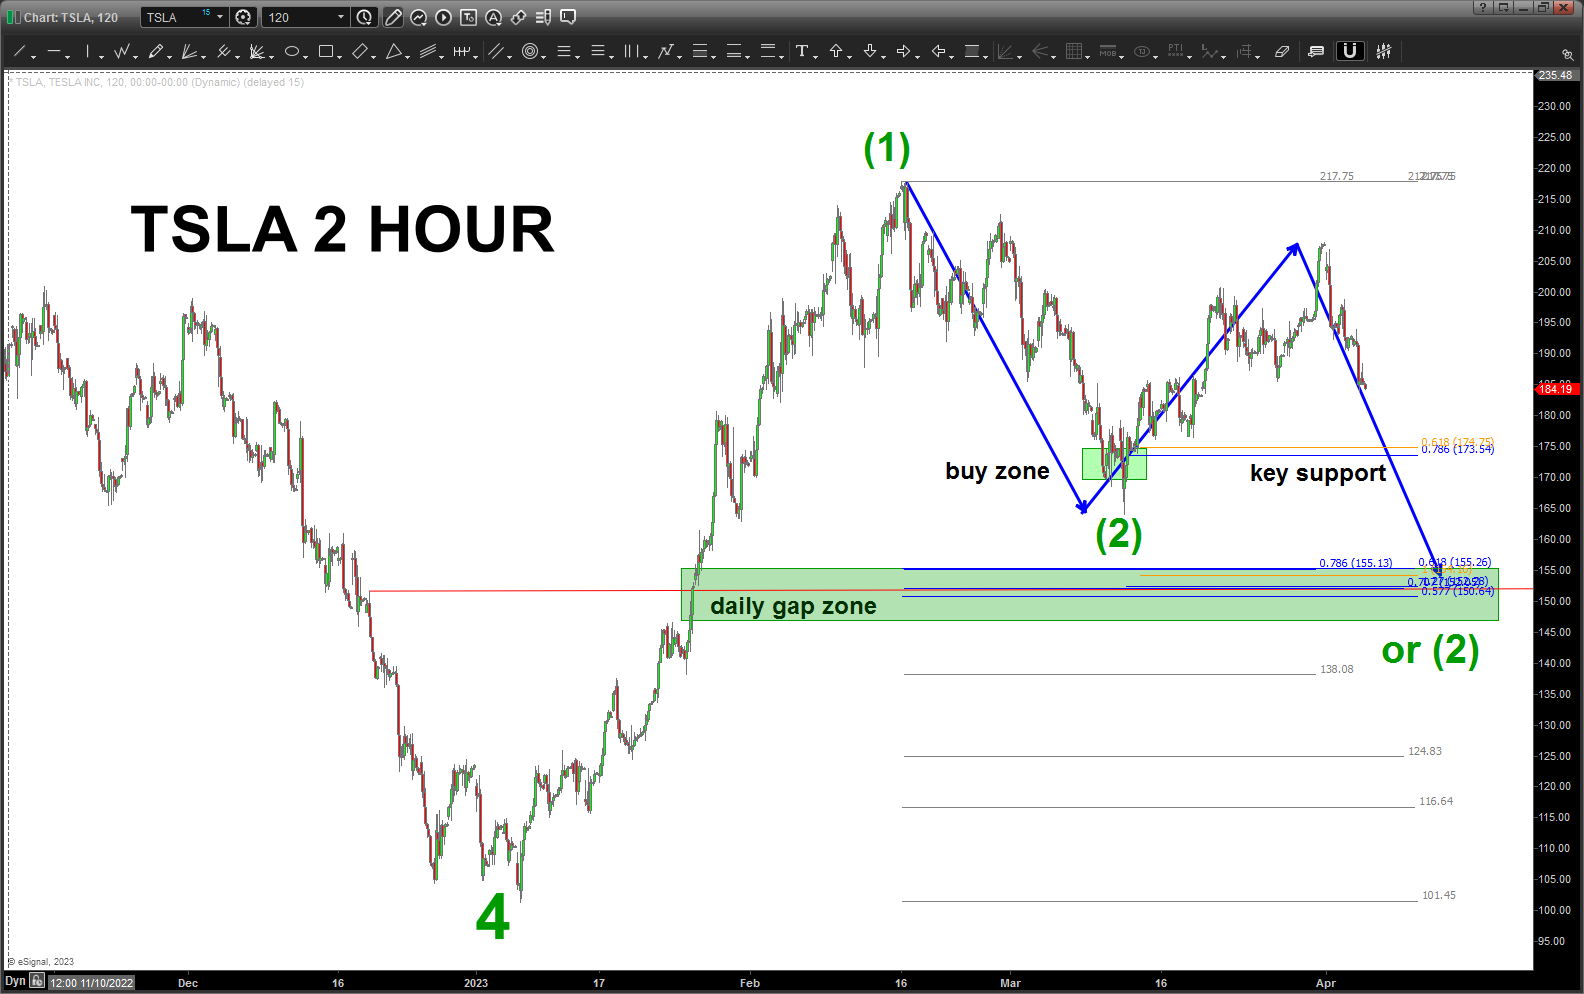
Well, the BUY PATTERN shown in the last update hit, went thru it a bit, and then started back up. If you look on this two hour chart, you can see that 5 waves up are complete from the low at (2) so, IF that (2) is correct, then expect 173-174 to hold and TSLA continues on in a 5th wave. Yes, know this sounds crazy but calling it like I see it, for now.
If we lose that lower 173-174 level then I’ll seek the “daily gap zone” as the next level to get LONG TSLA. Lot’s of math in that area …
So, either way, believe there isn’t any evidence, yet, that TSLA will continue it’s march higher either from a little lower or at the “green daily gap zone”

Simply love the added insight you give me. Miss reading you at TopGun.
Pingback: TSLA – April 27, 2023 – Bart's Charts