Gold / Oil :update 04/10/20
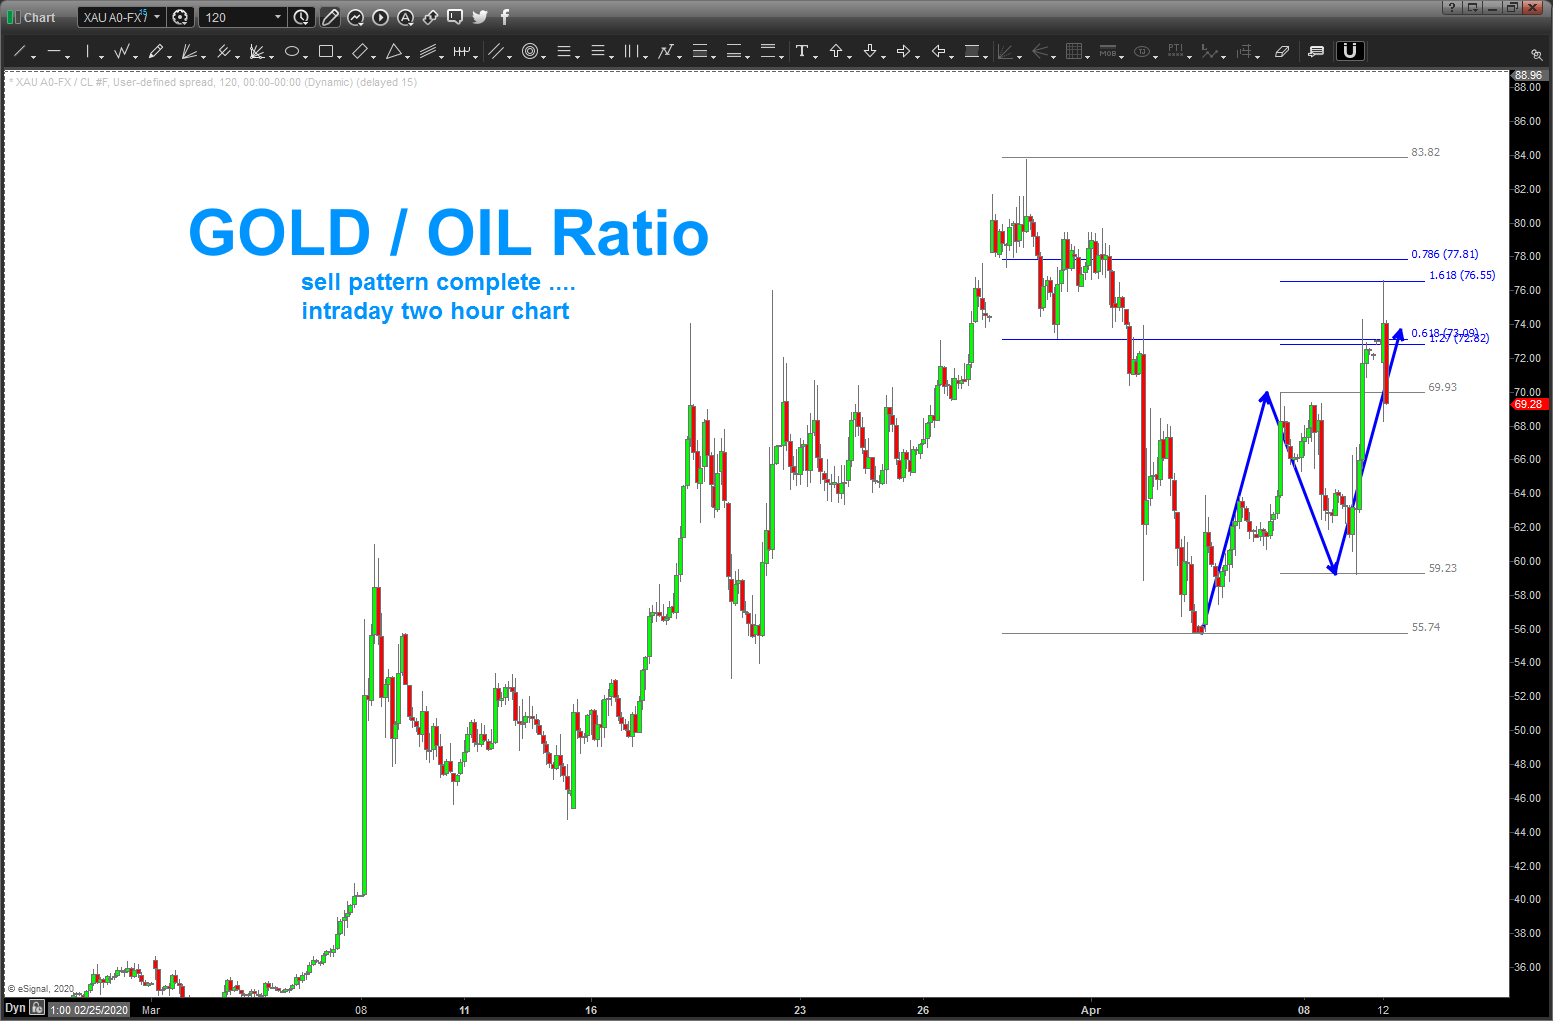
04/10/20 – our target level hit and, if you look closely below, you’ll see 5 waves down .. followed by 3 waves up into a “perfect” SELL PATTERN for the ratio. IF this pattern works (the big if) then expect Crude to strengthen against gold and, perhaps, keep the oil rally going for a little while longer.
one of my readers asked me a question on Gold/Oil ratio. below I have charted SPOT gold / futures oil (continuous contract) – wow, pretty amazing move … take a look at the 1.618 projection target a little higher. that ‘should’ (operative word) cause some resistance. additionally, if we keep this parabolic rise in the ratio then the 12 level on oil doesn’t seem to far fetched, does it? thanks again Ray for the ping … great question and observation. that’s what I see .. hope it helps. Bart
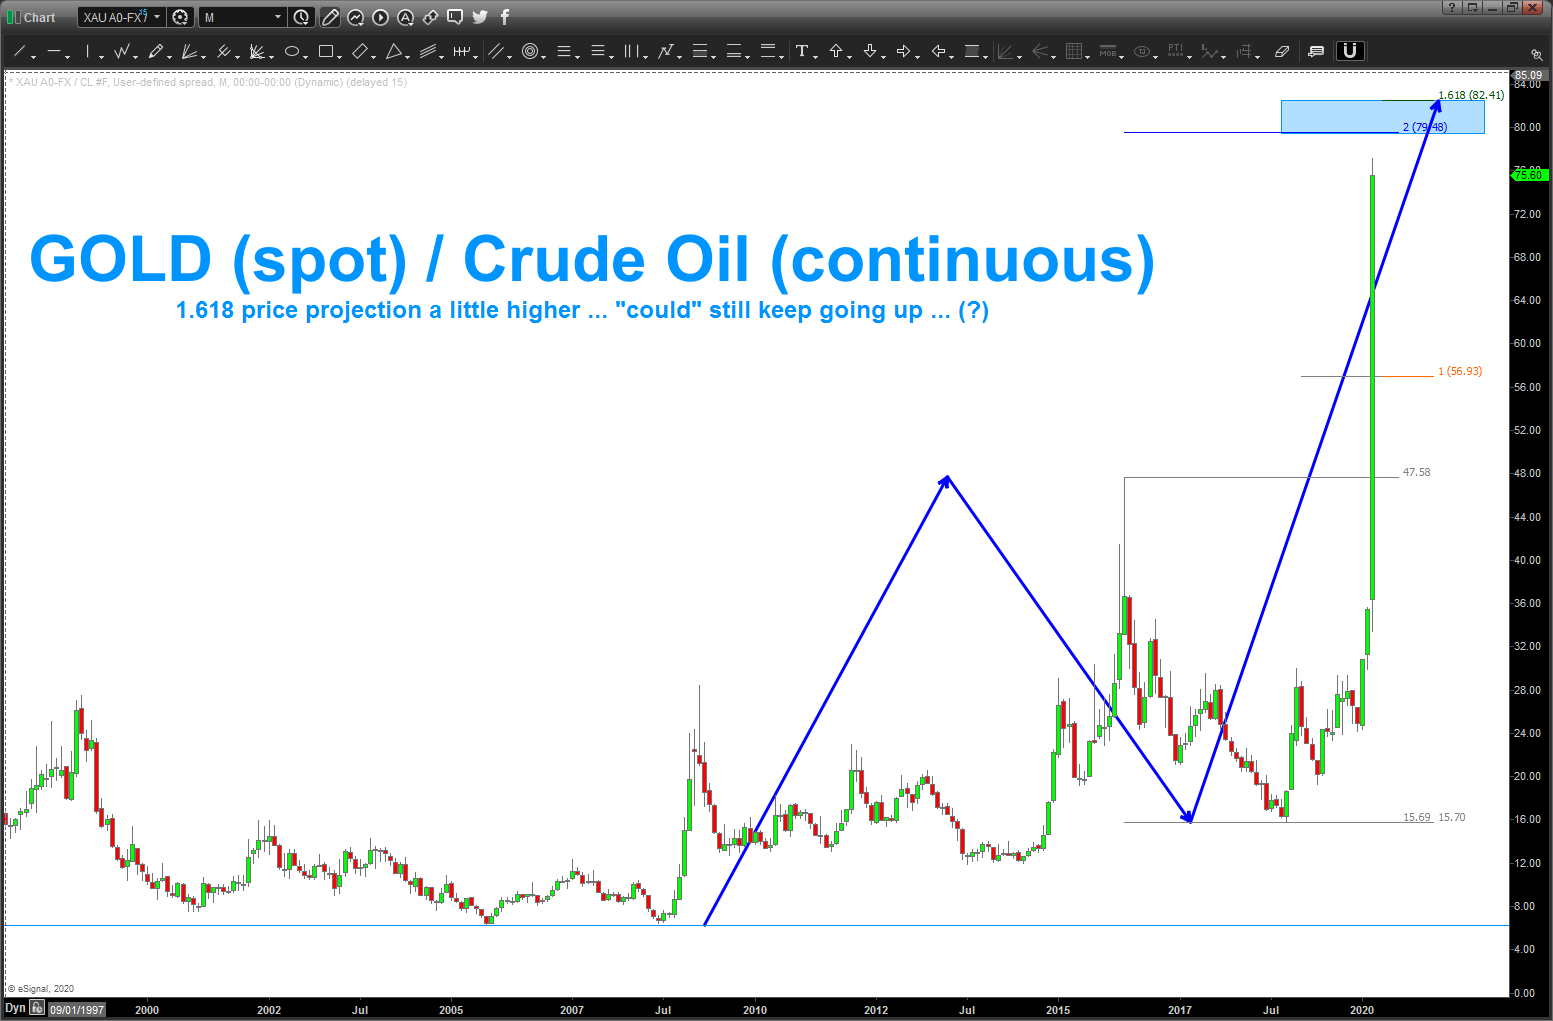

Thank you for responding to the question so quickly. This really helps. With the ratio going to 82 (not difficult), and most likely gold is going down (to 1500 easily?), it is not hard to see oil going lower. Best, Ray
Today gold to oil ration is 84.99—that surpassed the 82.4 (the previous target). Does it have any significance? This kind of breach—is it real (that we look for next target) or just a trap? (I long a oil May contract, expiring Monday 4/20, need o decide what to do). Appreciate your opinion.
Ray am about to post the USDCAD (loonie), Oil Services Index, Crude, Gold/Oil ratio … the only one that doesn’t appear to line up w/ a Oil BOUNCE (believe it will go lower!) is the OSX. No clearly defined pattern. W/ the charts that get posted I suspect a short term bounce in Oil should be now to on the horizon.
Hi, your charts/ideas are great so I have been a royal reader. Just notice you labeled “gold to silver ratio” for what you meant to say “gold to oil ratio”. Best, Ray
hey Ray, thanks … let me correct it. Note, futures down on the Asian open.