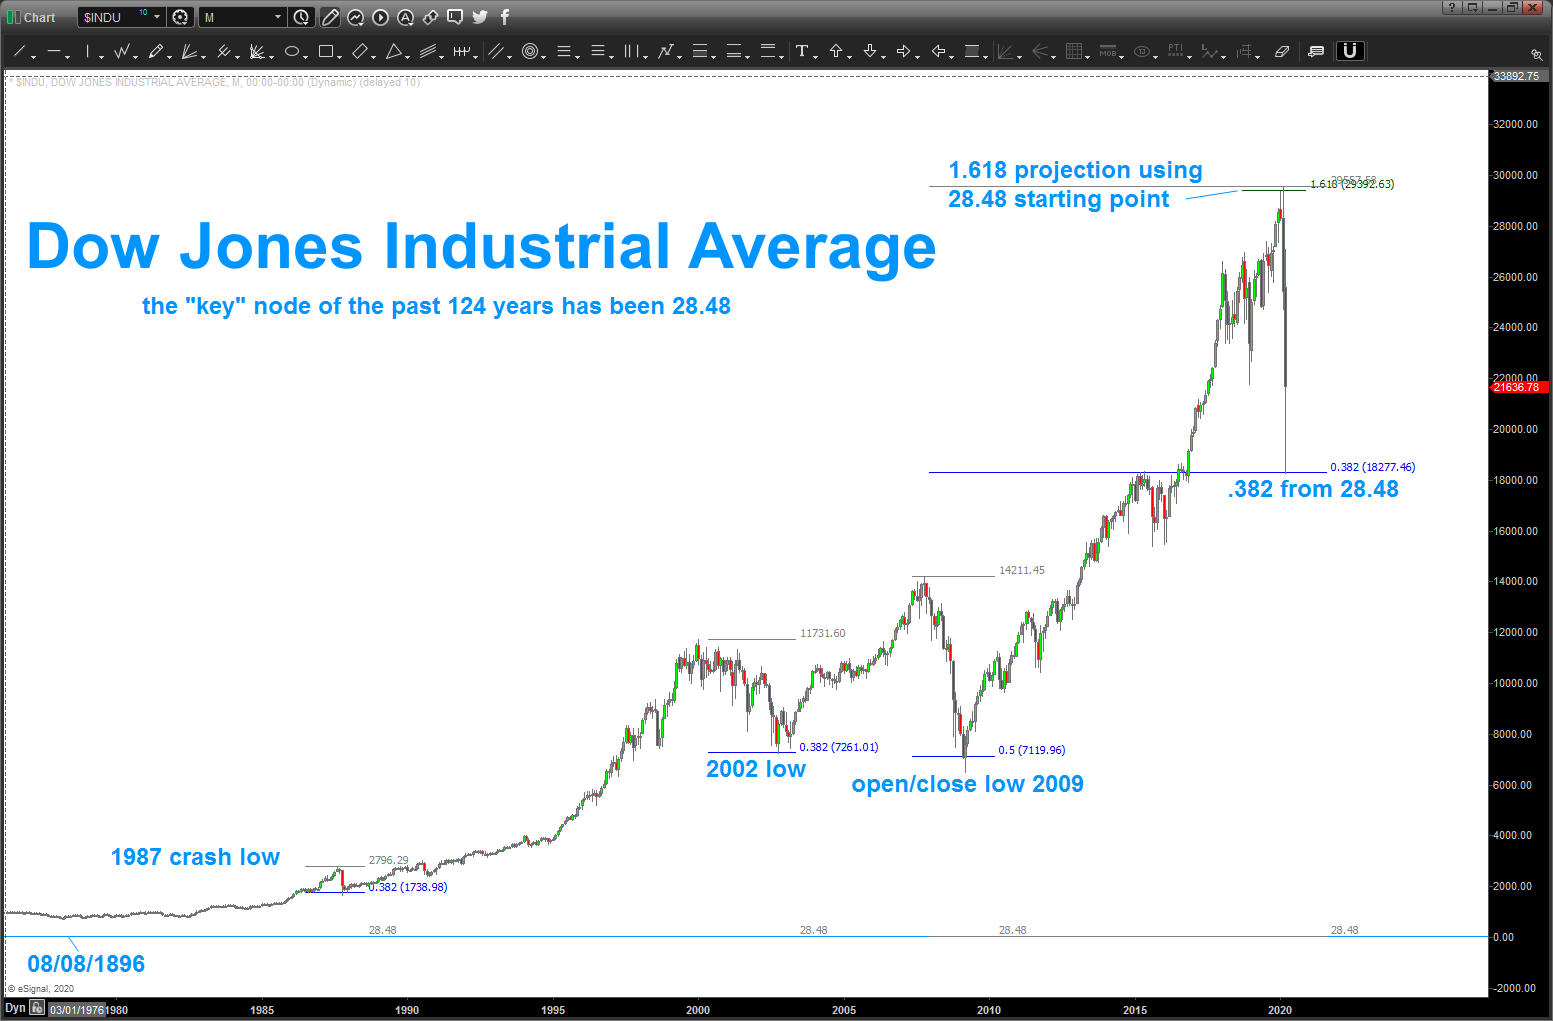
the importance of 28.48
I’ve been using the all time low on the DJIA in 08/08/1896 – 28.48 as a KEY node responsible for major support and resistance. as you can see in the chart below, it’s been present at the 1987 crash low, 2002 low, 2009 low and most recently the crash low in 2020. also, if we take that all time low and use the high in 2007 as our AB leg then 1.618*AB = all time high on DJIA.
certainly smells like one more leg down to complete a 5 wave sequence. I’ll be watching for the same percentage decline as 2007-2009 or one of the retracement levels that can be derived from 28.48.
for now, w/ so much crazy volatility be aware where these key levels are going to be going forward and, please, make sure you use 28.48.

Can you explain / show why need another wave lower? Didn’t we test a major fib level already? Thanks
we did test a very important level. just looking at the thrust and the ‘count’ appears we need one more wave lower to complete a 1,2,3,4,5 sequence. I could most certainly be wrong …
Thank you