NFLX
last post on NFLX: https://atomic-temporary-44460632.wpcomstaging.com/2021/10/13/nflx-abcd/
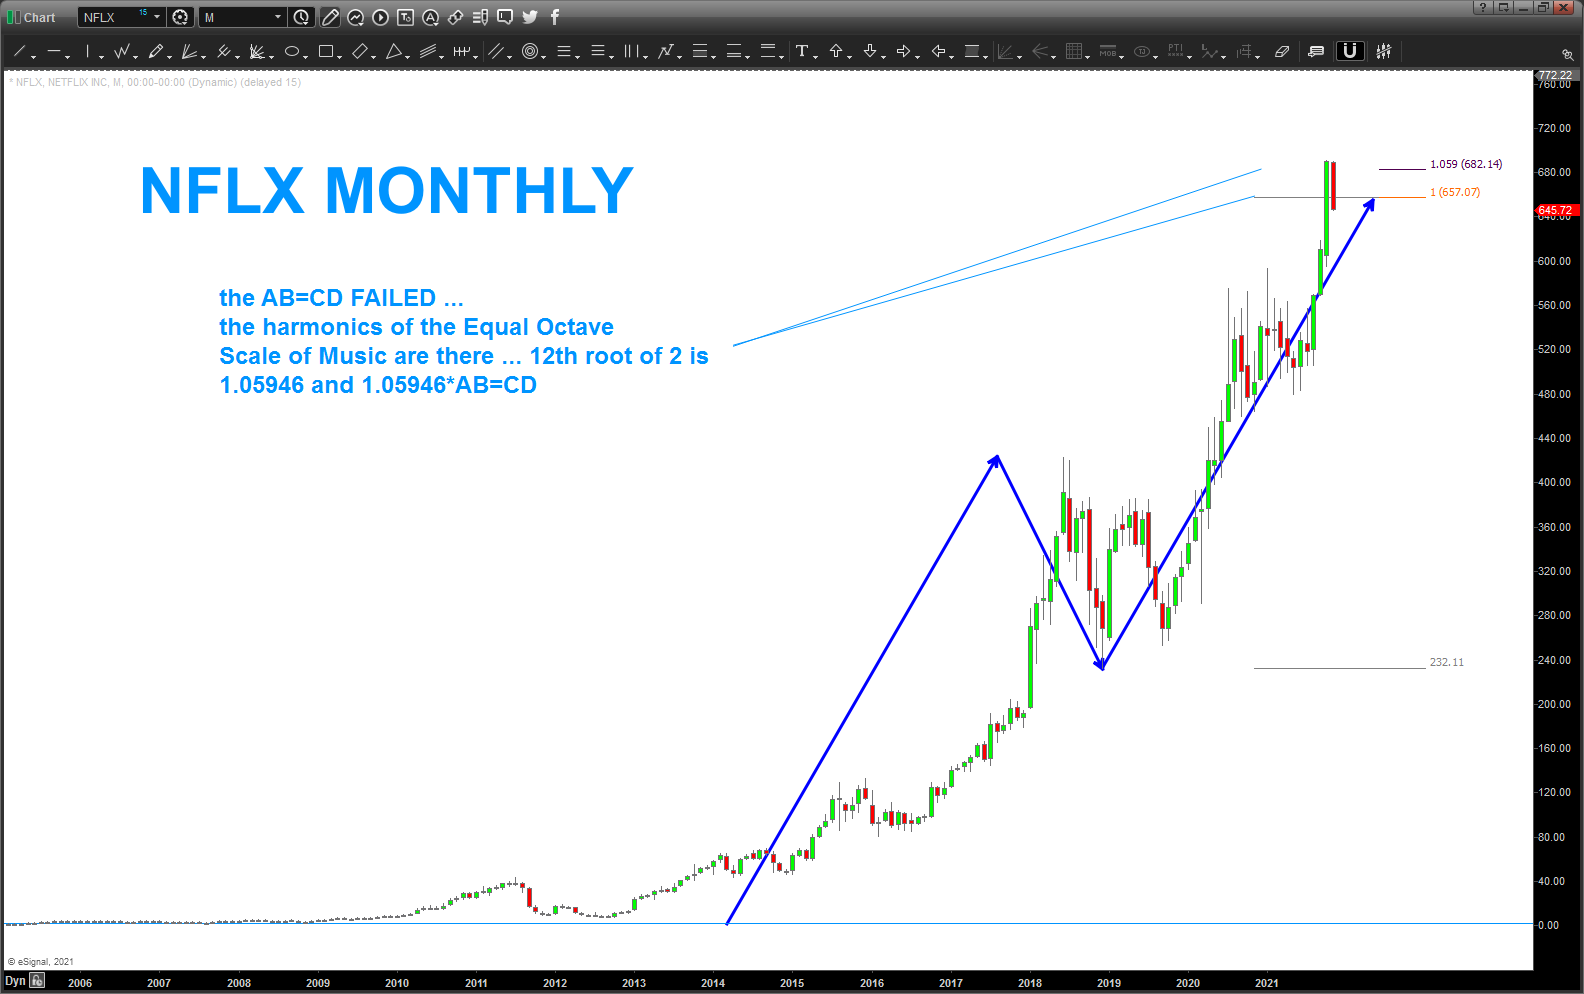
as you can see, the NFLX AB=CD failed by, roughly, 4% and w/ this price point one would have some pretty big exposure if playing single shares ….. I considered that PATTERN failed.
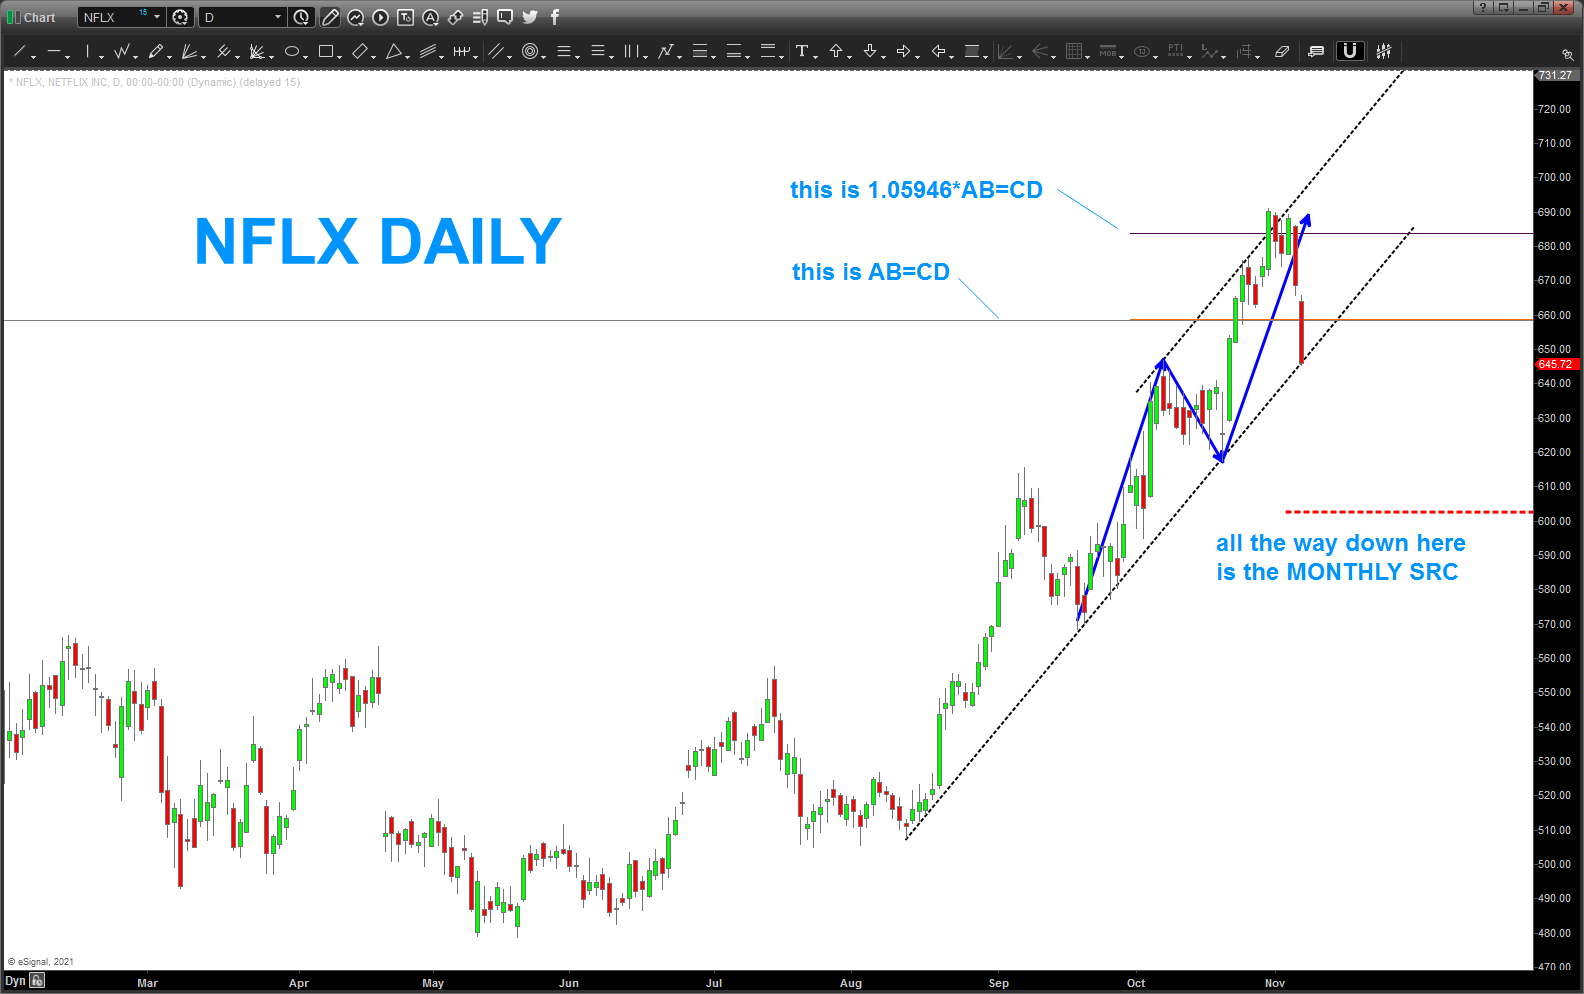
that being said, it was a PRETTY HUGE pattern (hence I called it chart of the year) so I went back and looked at the “form and proportion” of this move up into the high and I saw on a daily that we had some more “count” to go and a projection smacked us right into the high (for now, it’s all probability)I realized my ego got in the way here, putting something out like “chart of the year” … I can’t stand when NFL or NBA players make a big deal out of play … why would I fall into that trap? my apologies.
that being said, this is a pretty big target zone so I do think we need to take this top seriously. however, a REAL change in trend would be a MONTHLY CLOSE BELOW 600 as shown below on this DAILY NFLX chart.
in order to fully understand the SRC or Signal Reversal Candle please pay attention to the chart below:
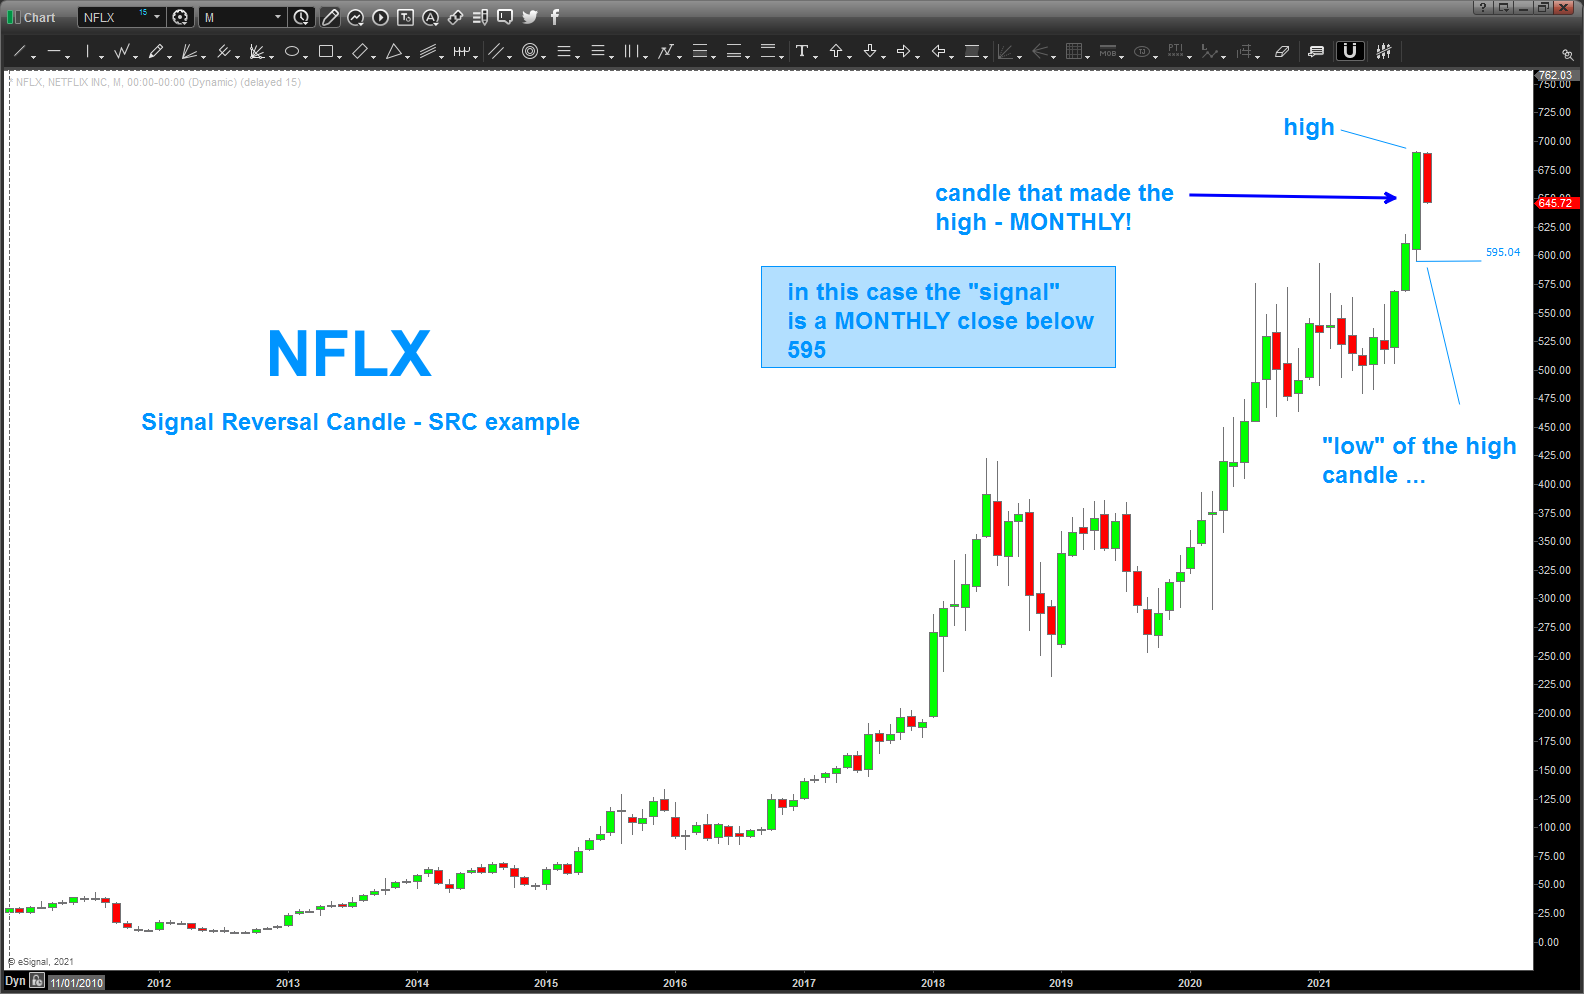
as you can see above, the SRC is a MONTHLY close below 595. a REALLY conservative play … however, you could do an intraday 60 minute SRC or daily, weekly, etc. it all depends on your risk tolerance.
perhaps a BIG pullback is in the works for NFLX?