UNG – Natural Gas – catch the next wave?
last post on NAT GAS / UNG: https://atomic-temporary-44460632.wpcomstaging.com/2021/11/01/ung/
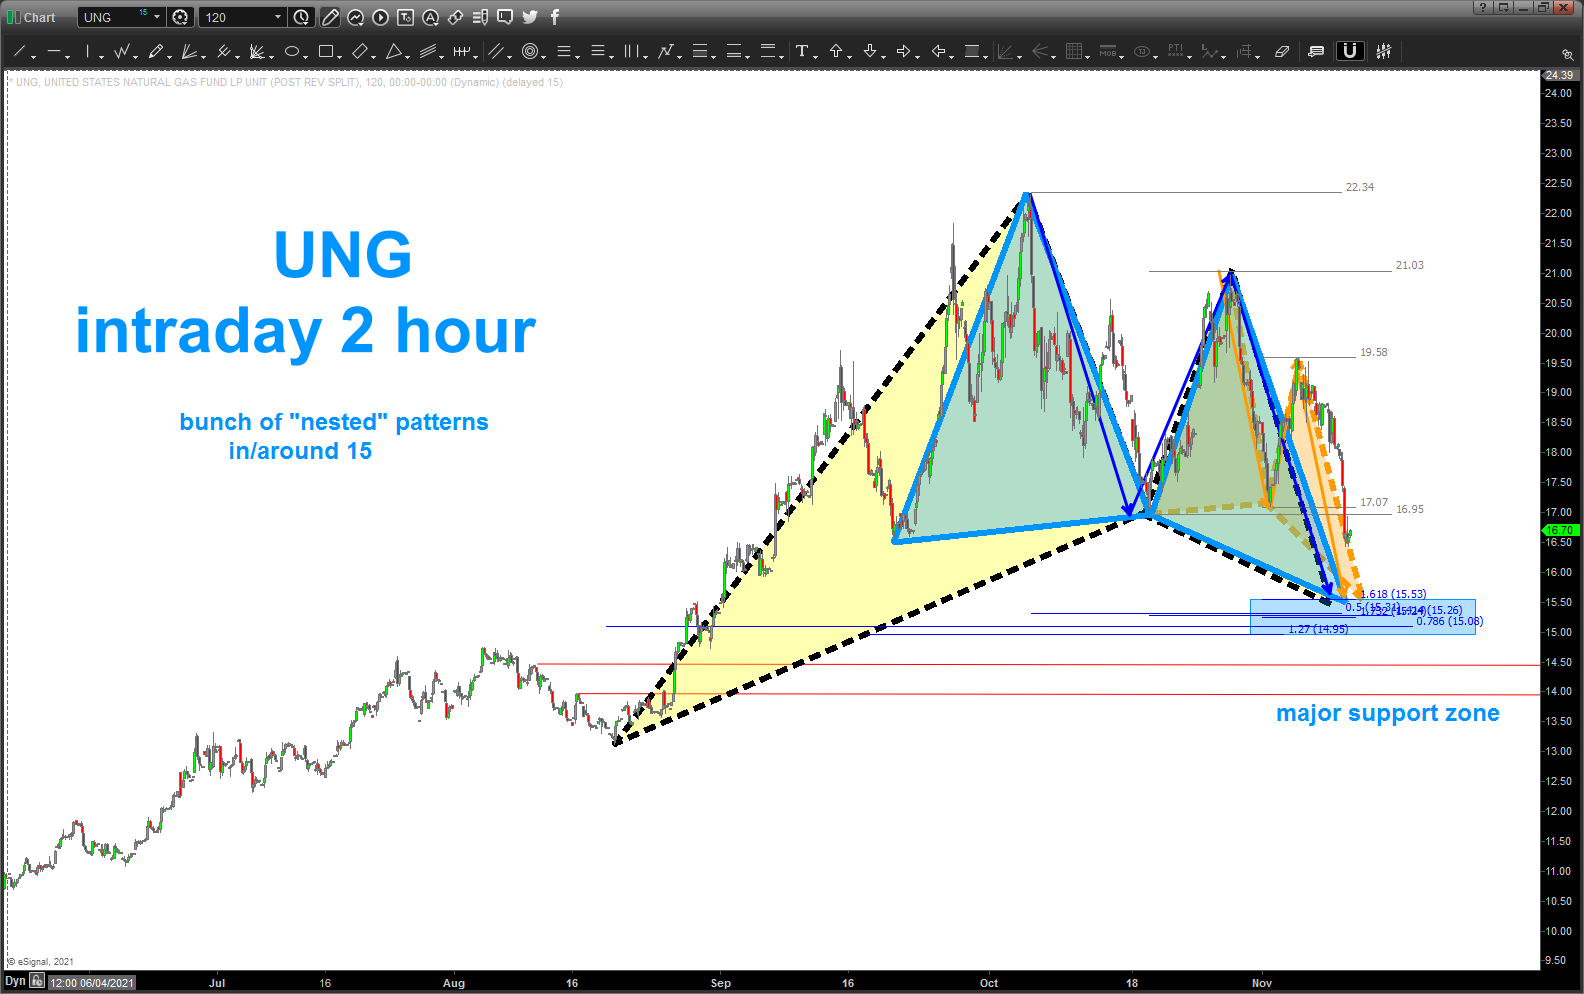
the game plan/strategy is to BUY the first PATTERN in a “new” trend and if it works then probability is that the trend change is real …
Energy, Ags, etc. are exploding of late and GLOBAL shortages that are becoming apparent pretty much every day are REAL. so, if one thinks (trade what you see not what you think) that Nat Gas prices are due to continue to rise then we have UNG that will give you exposure.
if we break thru the low at 13 then I would consider this a failed pattern but we have some MAJOR support coming in/around 15 for the BUY to get long nat gas and, perhaps, hold this position for a LONG time …
it’s all probability folks …
below, you will see a MONTHLY on UNG since inception. wanted to post this chart so you could see why I wrote the above .. have we broken out in Nat Gas? have we begun a new bull trend? full disclosure, I’m long UNG down in the single digits and will be looking to ADD to my position at this pattern completing – if it ever does.
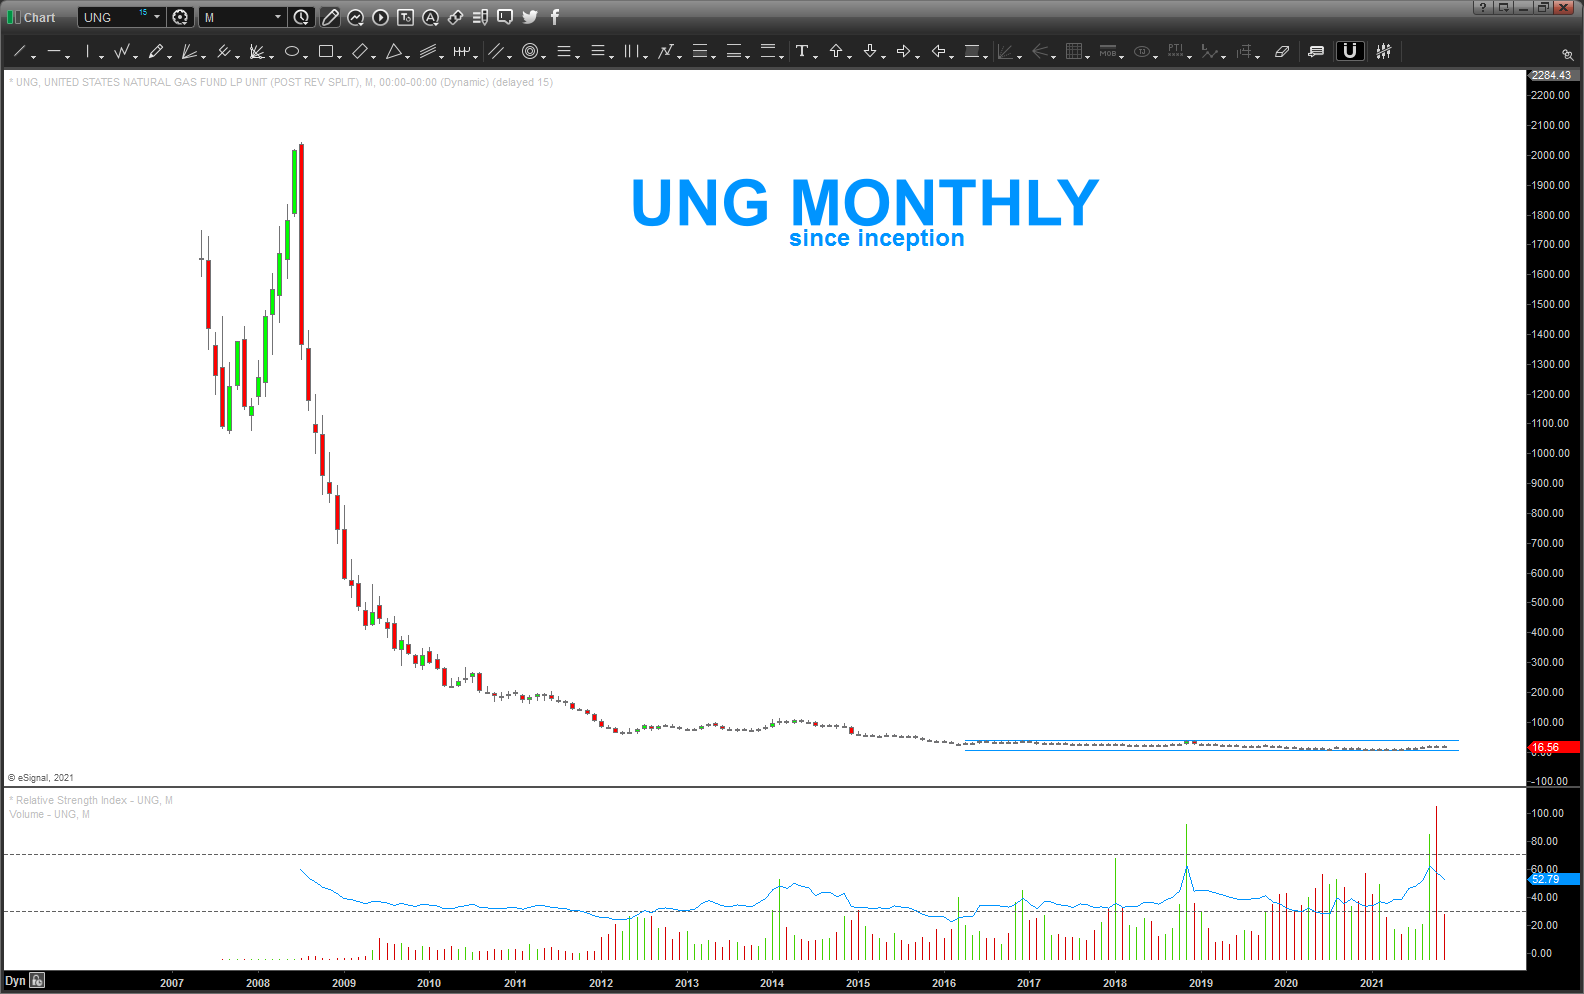
take note of the volume picking up and the fact that the RSI is at it’s highest level .. the key here, in the coming ongoing pullback, is where the RSI finds support … if we find support on the BULL ZONE (around 40ish) then we can start giving our change in trend some more probability … but, for now, we are speculating that a very investable low is in place .. don’t throw the farm at this one .. nibble at it … as we will see the breakout occur and there will be more time to get LONG if the “low in place” thesis is correct.
additionally, the “length of the base equals the price target potential is also nice here .. we’ve been basing for 6 years and, if you want to split hairs probably 10 years once that low was put in place 2012. bottom line, if this things goes higher, it’s going to go ….
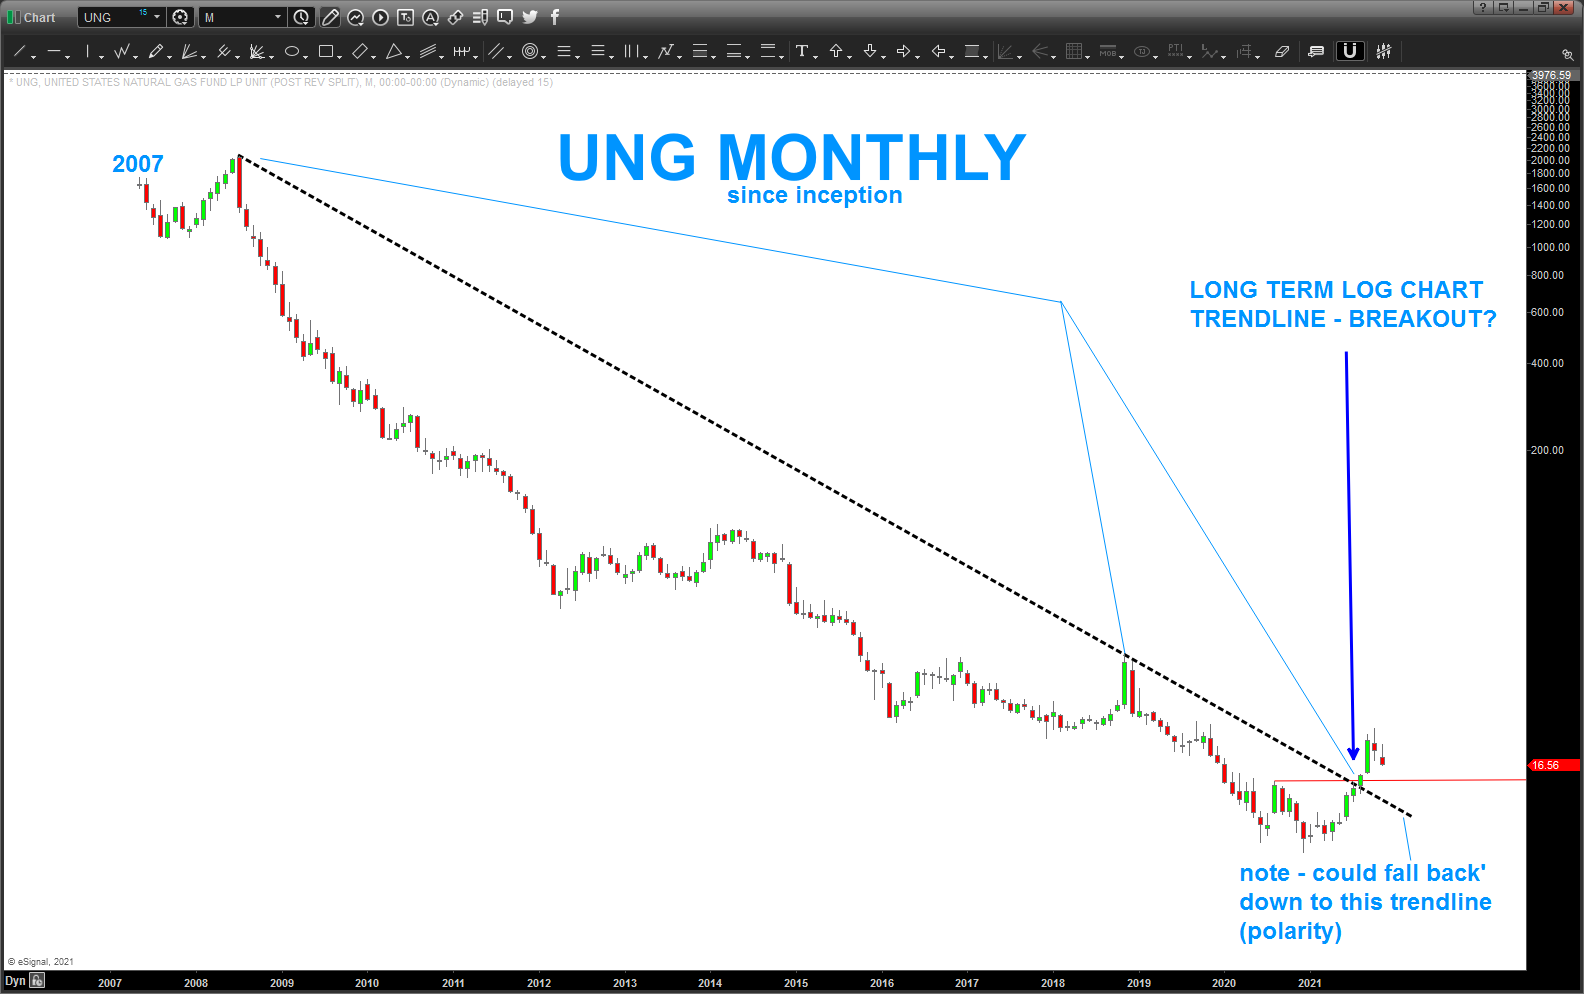
another way to check trend is via long term LOG charts .. LOG’s help you understand rates of change and are very good at giving first hints of big changes in trends or inflections …in looking at this on the long term log scale, certainly appears to have broken the long term log trend line …
last, when you are building a position, it’s wise to see how “strong” or “weak” that security is compared to high fast flyers .. in this case, for no other reason than randomness, I chose UNG/NFLX.
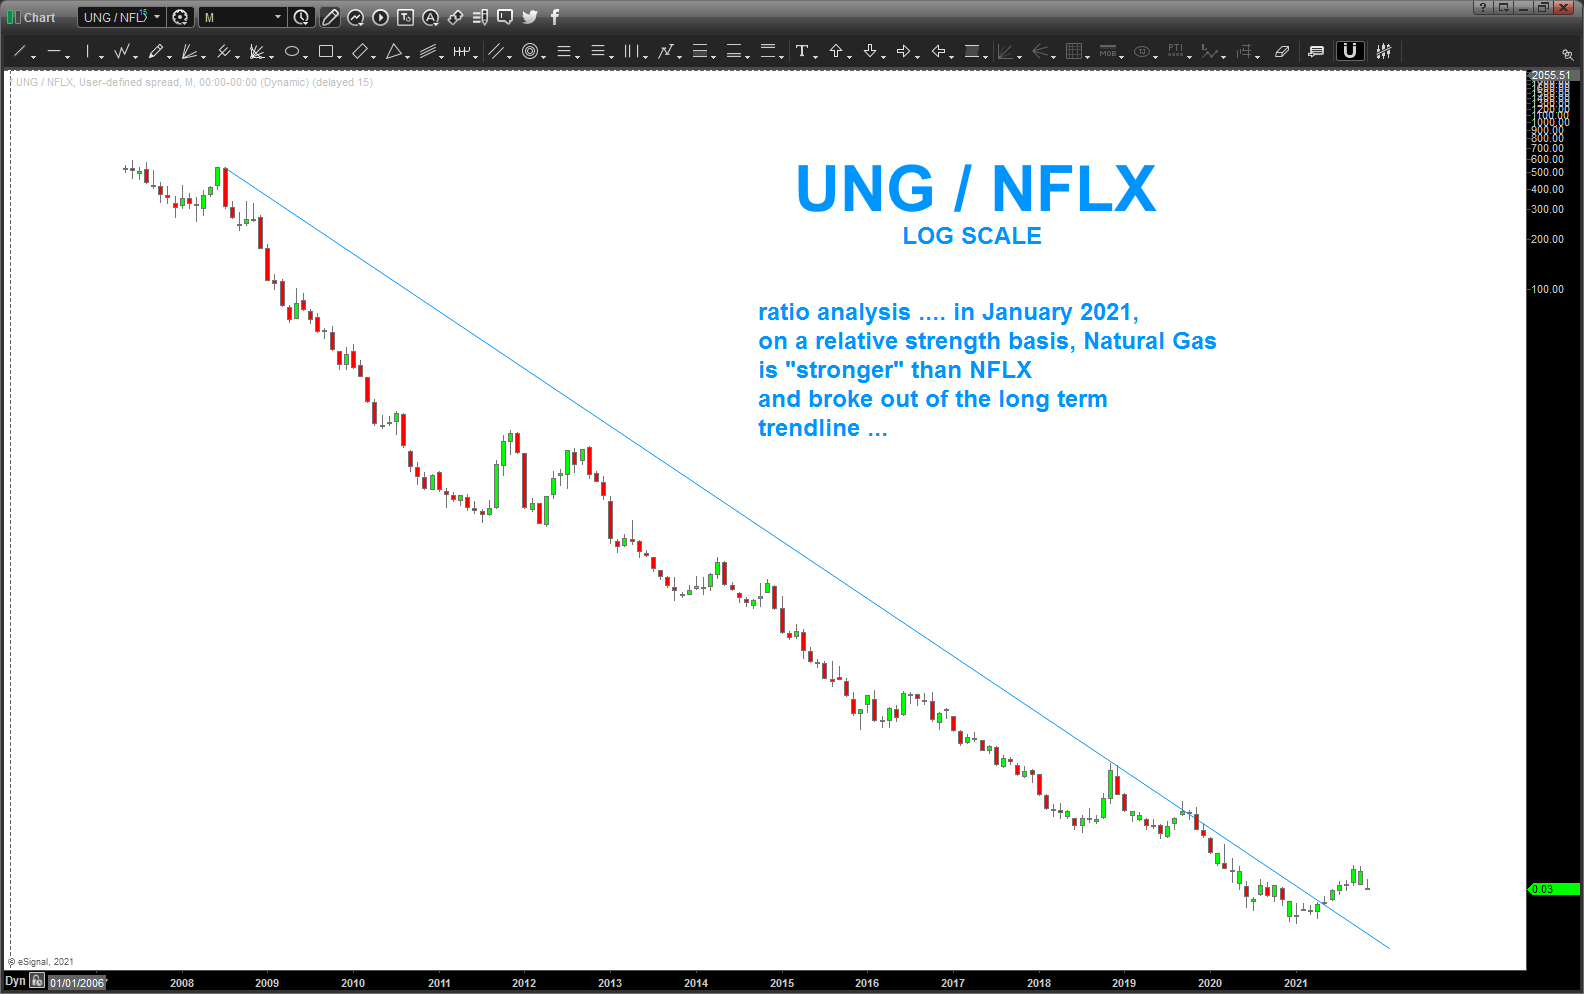
yup, Natural Gas has out performed (on a relative strength basis) NFLX for all of 2020
there you have it …
manage the risk.
Bart
