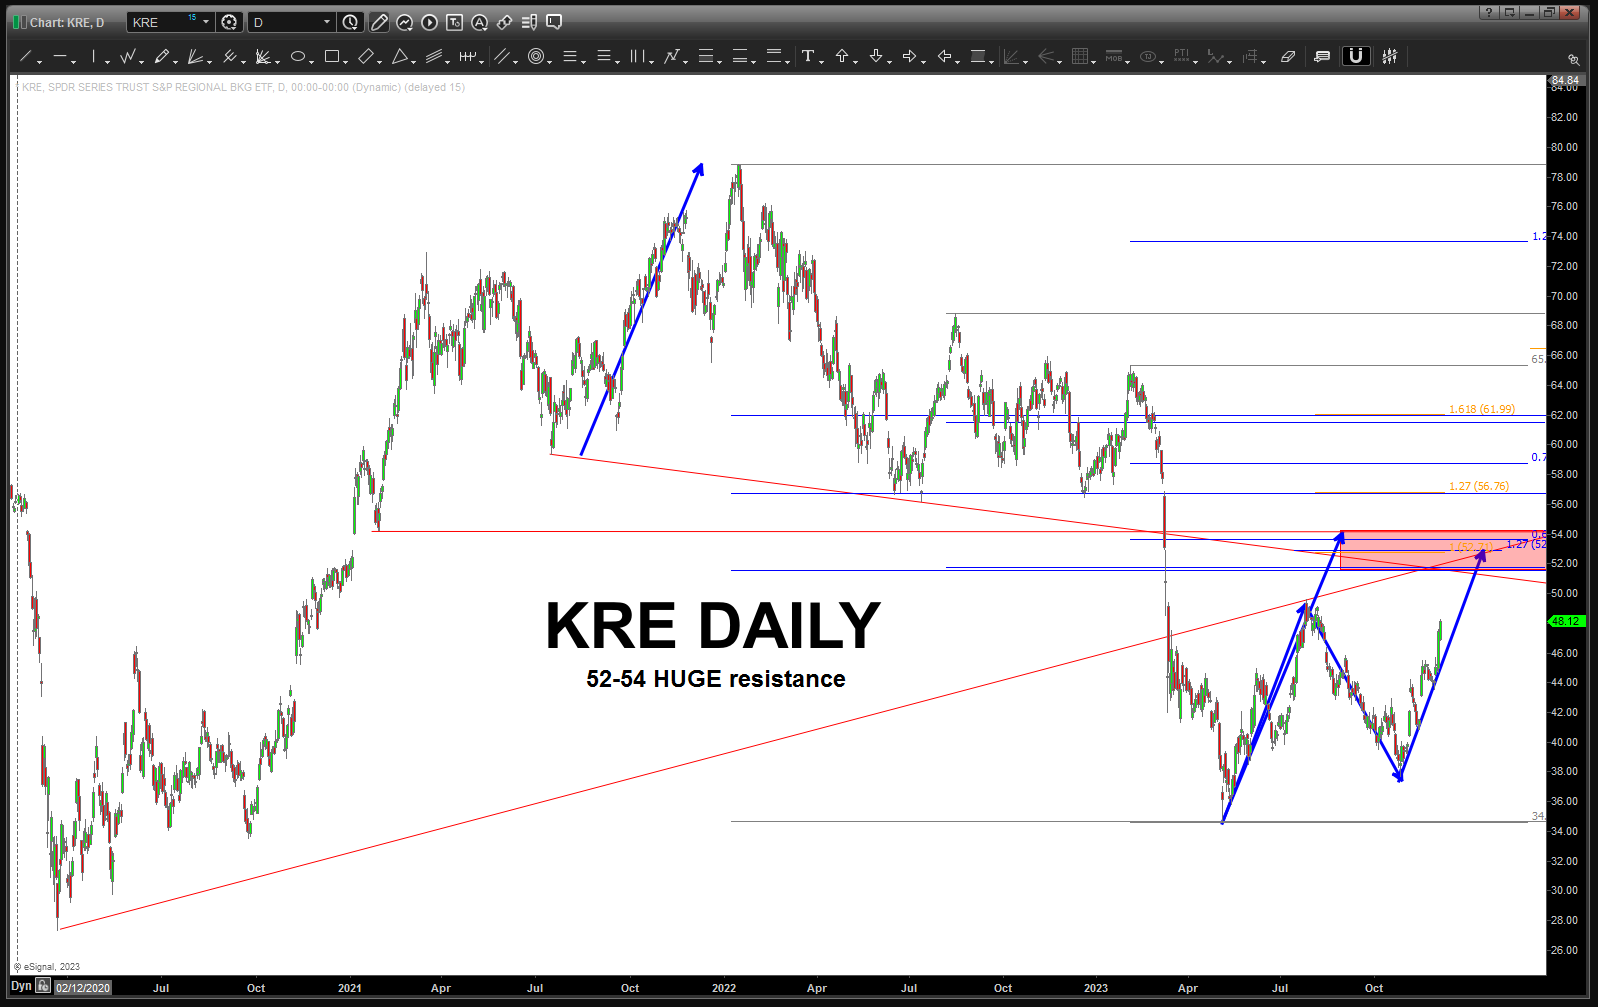
KRE – February 18, 2024
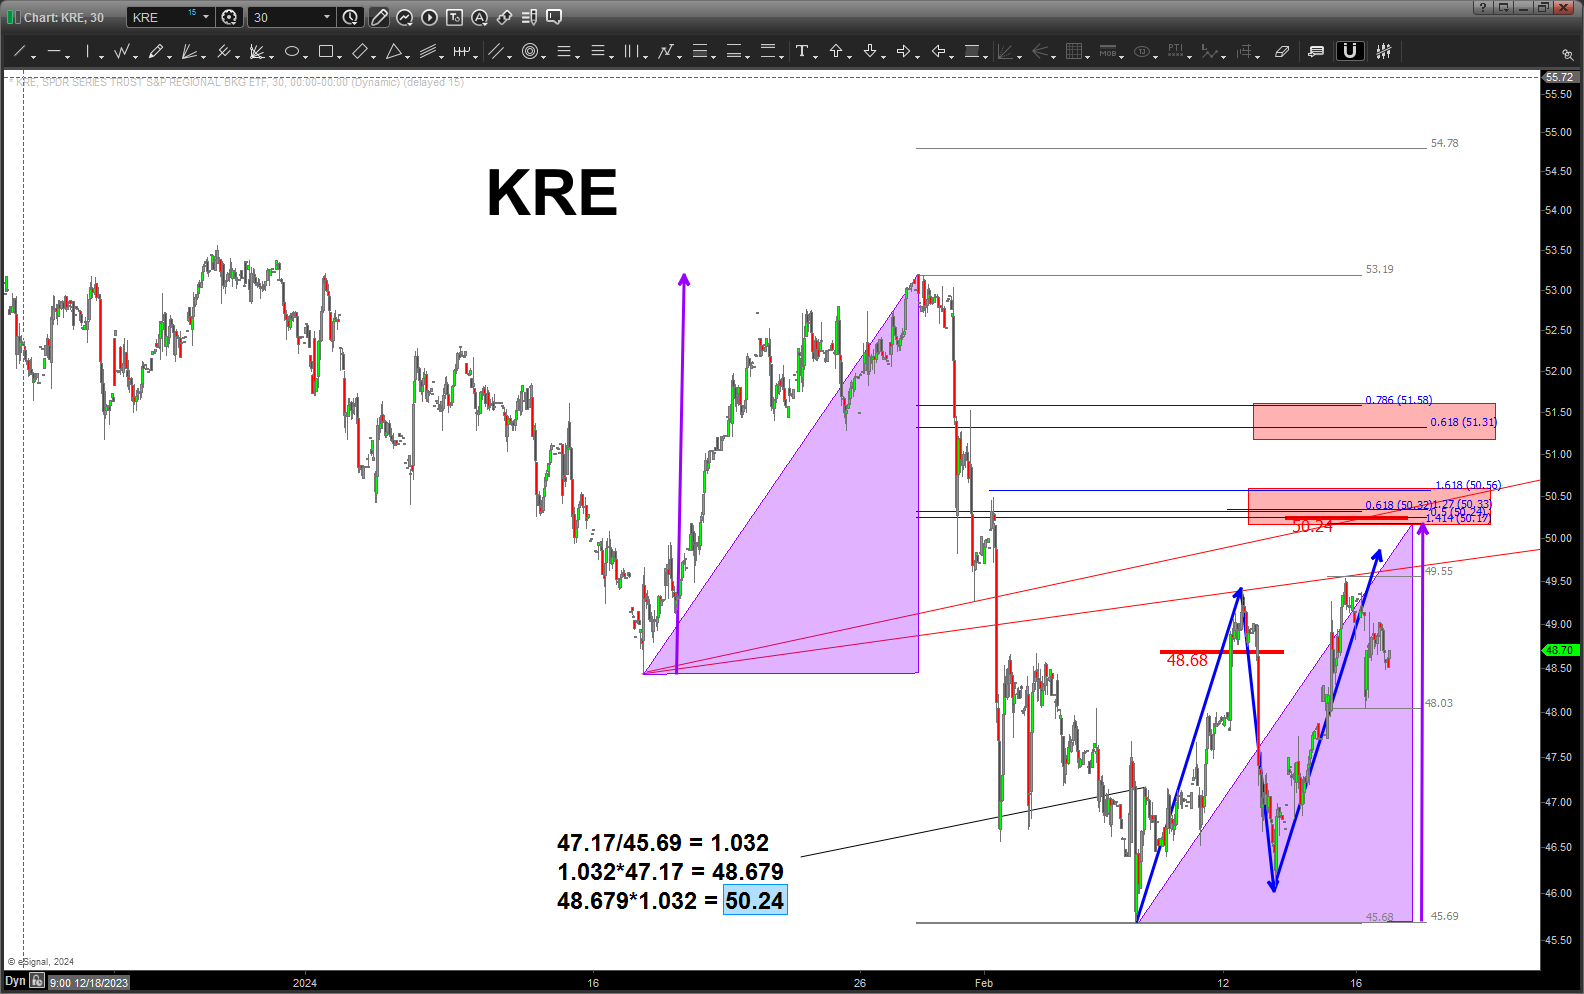
Here is an intraday look (30 minute) chart of KRE. A “near perfect” sell pattern has formed .. ideally, we would like the KRE to make a move up into the short zone.
Remember, IF this pattern fails (say that is a close (daily) above 62) then, I do imagine this will cause some fuel for the continued equity rally.
IF this pattern works THEN I’m afraid something ain’t right at the KRE world …let’s see what happens w/ the patterns.

Pingback: KRE – April 20, 2024 – Bart's Charts