WMT – into the high 60’s?
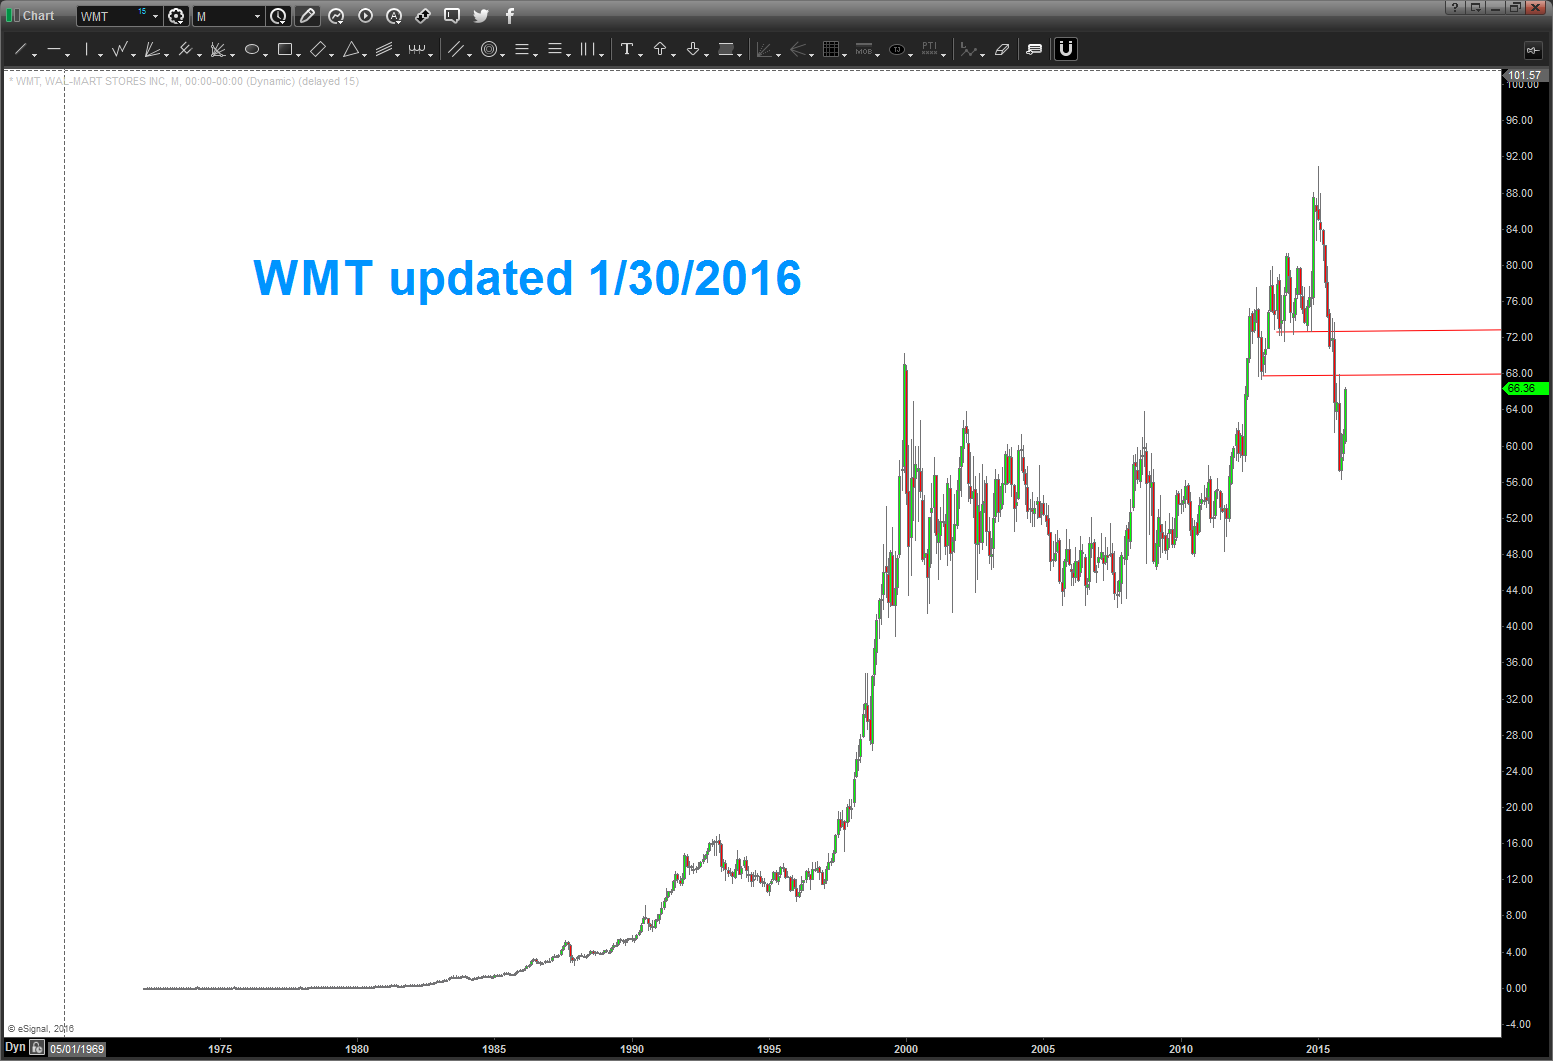
1/30/2016 – WMT propelling higher. 68 or 72 potential targets, or quite frankly, new highs? too early to tell but it has been extremely bullish.
if you want to follow along – scroll down to the bottom where we show patterns into the HIGH and then use geometry and patterns to find the 55-56 area as support.
THERE IS ZERO FUNDAMENTAL ANALYSIS IN LOOKING AT THESE SWING HIGH AND LOW TARGETS.
Bart
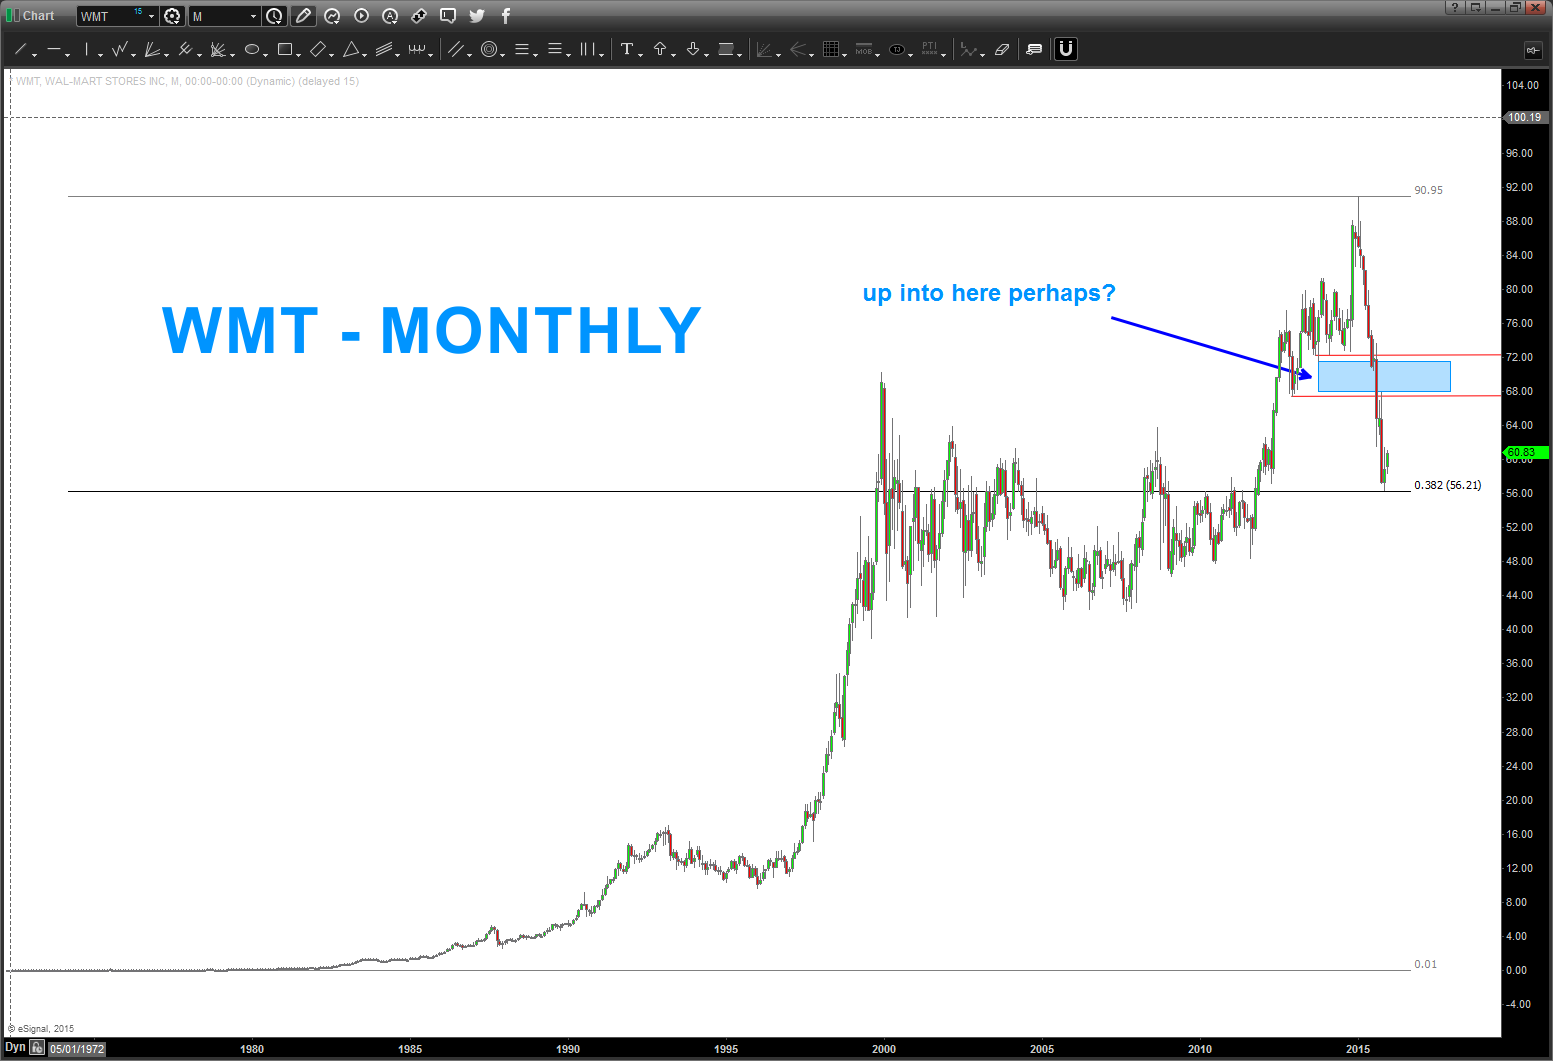
$WMT hit the support area and has been climbing. certainly appears the high 60’s could be in play? Please see below.
hope you had a great Festivus w/ family and friends.
spend some time working thru this post from the bottom up …
rock on, ok?
Bart
Just a heads up … were “there” or “close” w/ regards to potential WMT support.
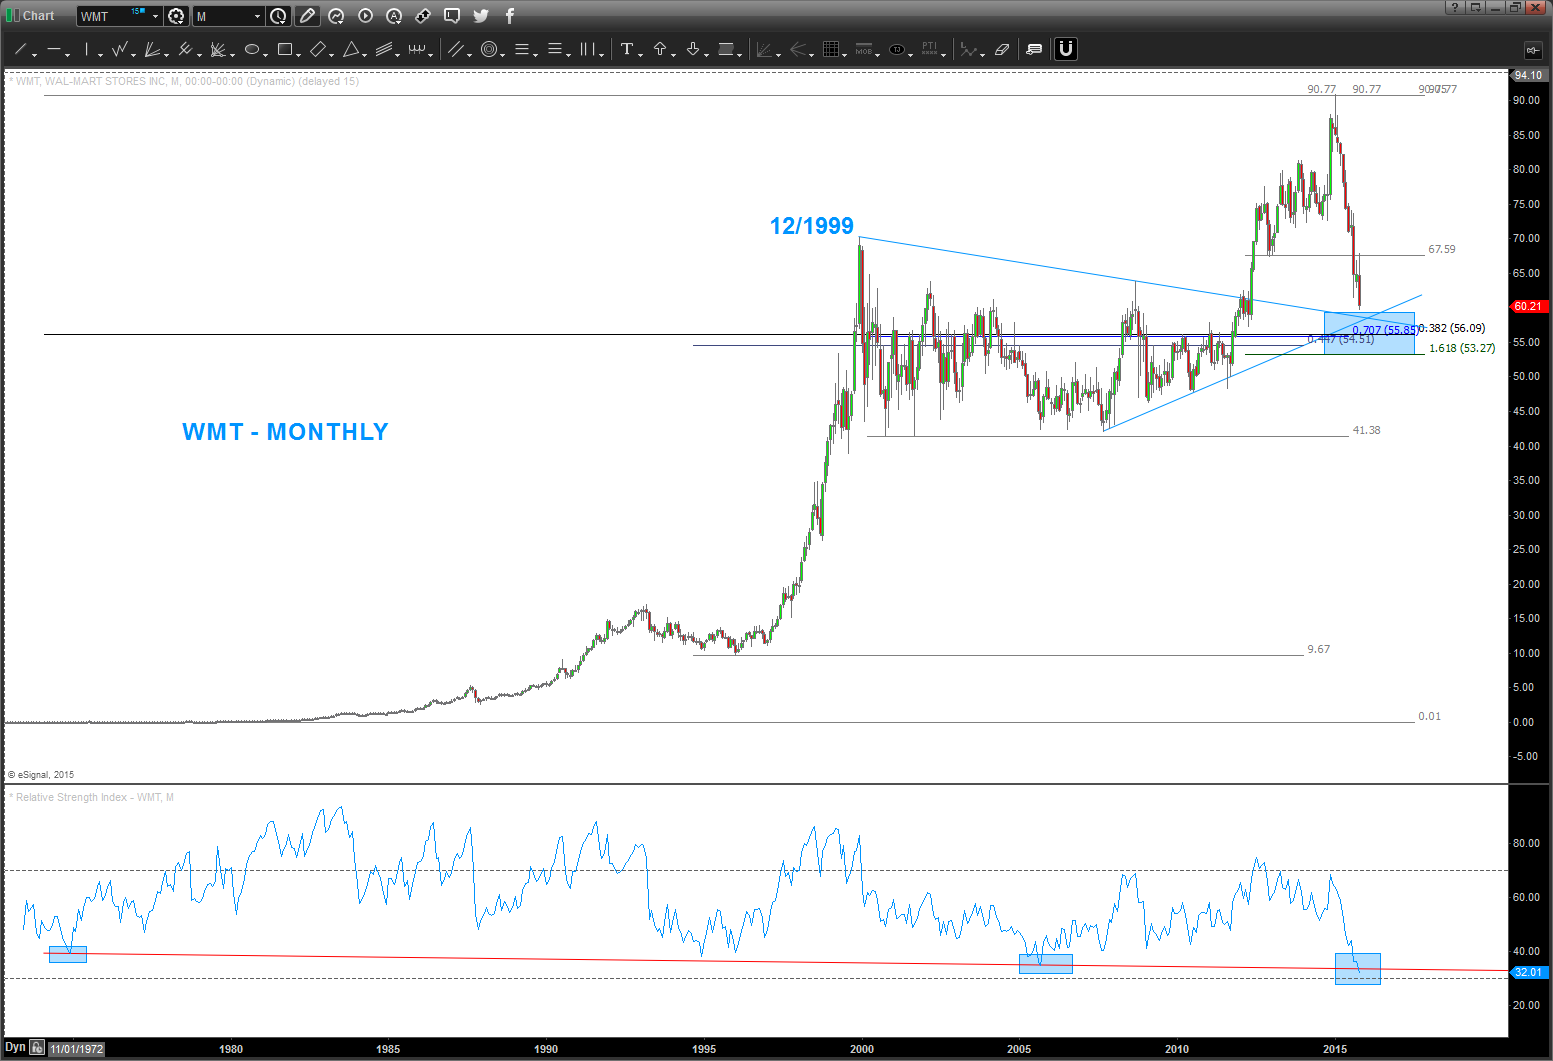
Here’s the picture of $WMT in 2013 – sure looked, at the time, we were finishing 5 waves and the circle area was the target area for a “potential” top.
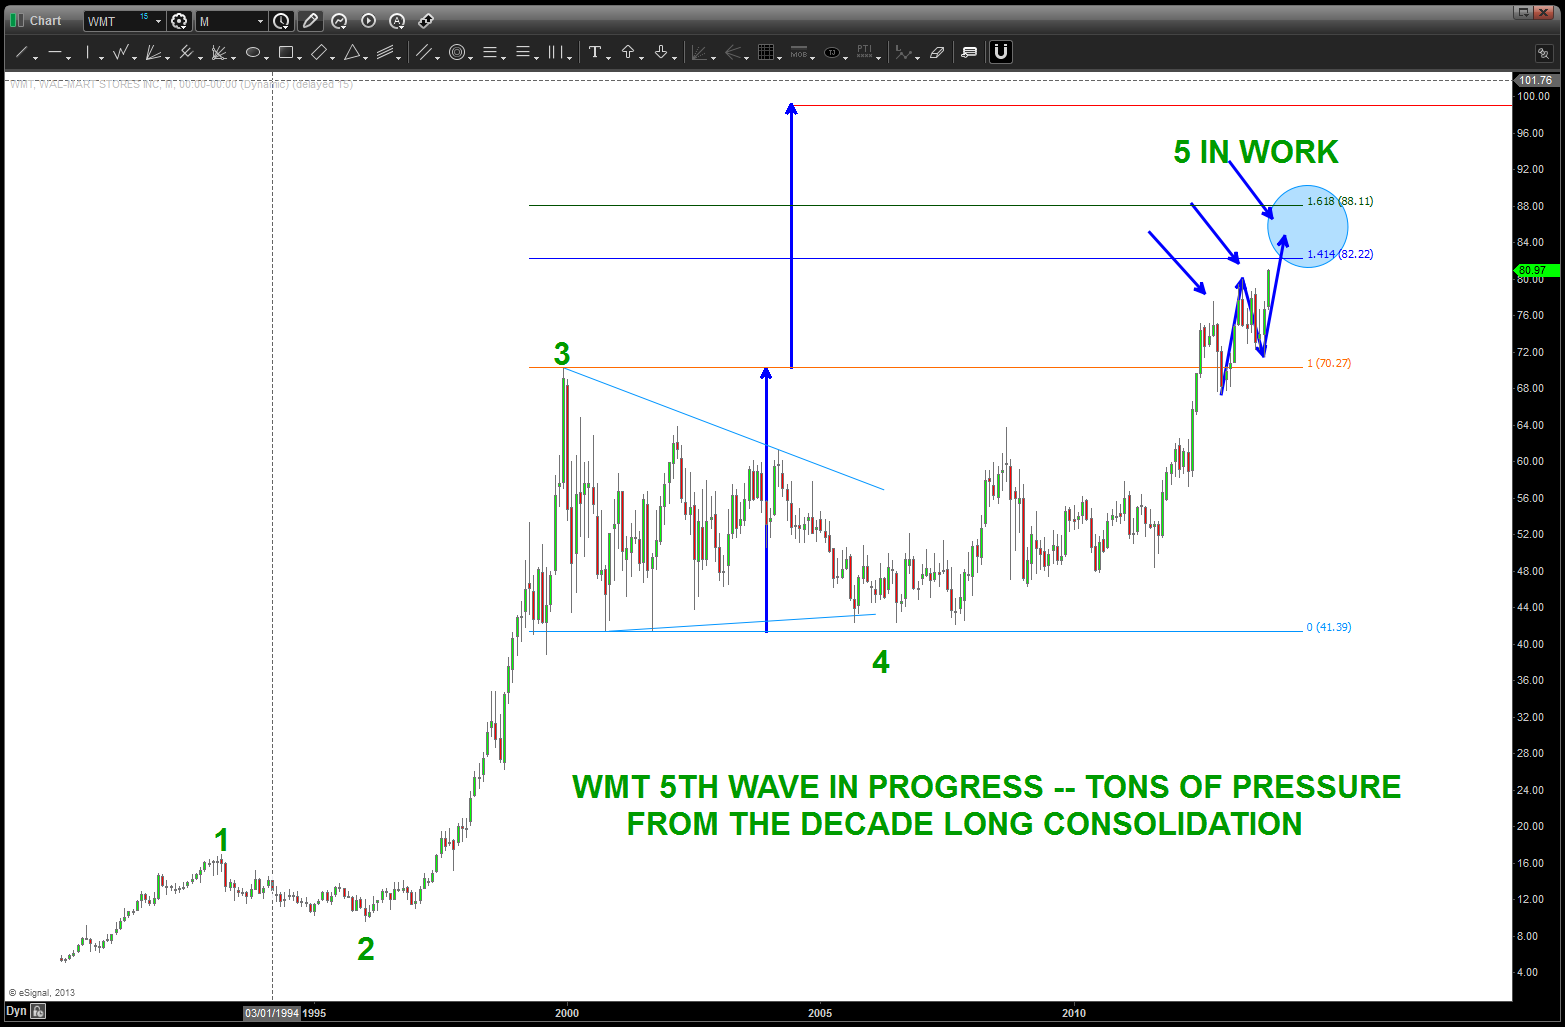
$WMT moving into the highs – Nov 2013
Target was hit and yesterday the move rally began. Hard to believe it’s roughly 2 years ago that this pattern was ID’d and it took that long for it to start to make the “news” so to speak. Anyway, now that the chaos and news is getting ahold of it, believe a look at a potential long swing trade in the mid to low 50’s is reasonable.
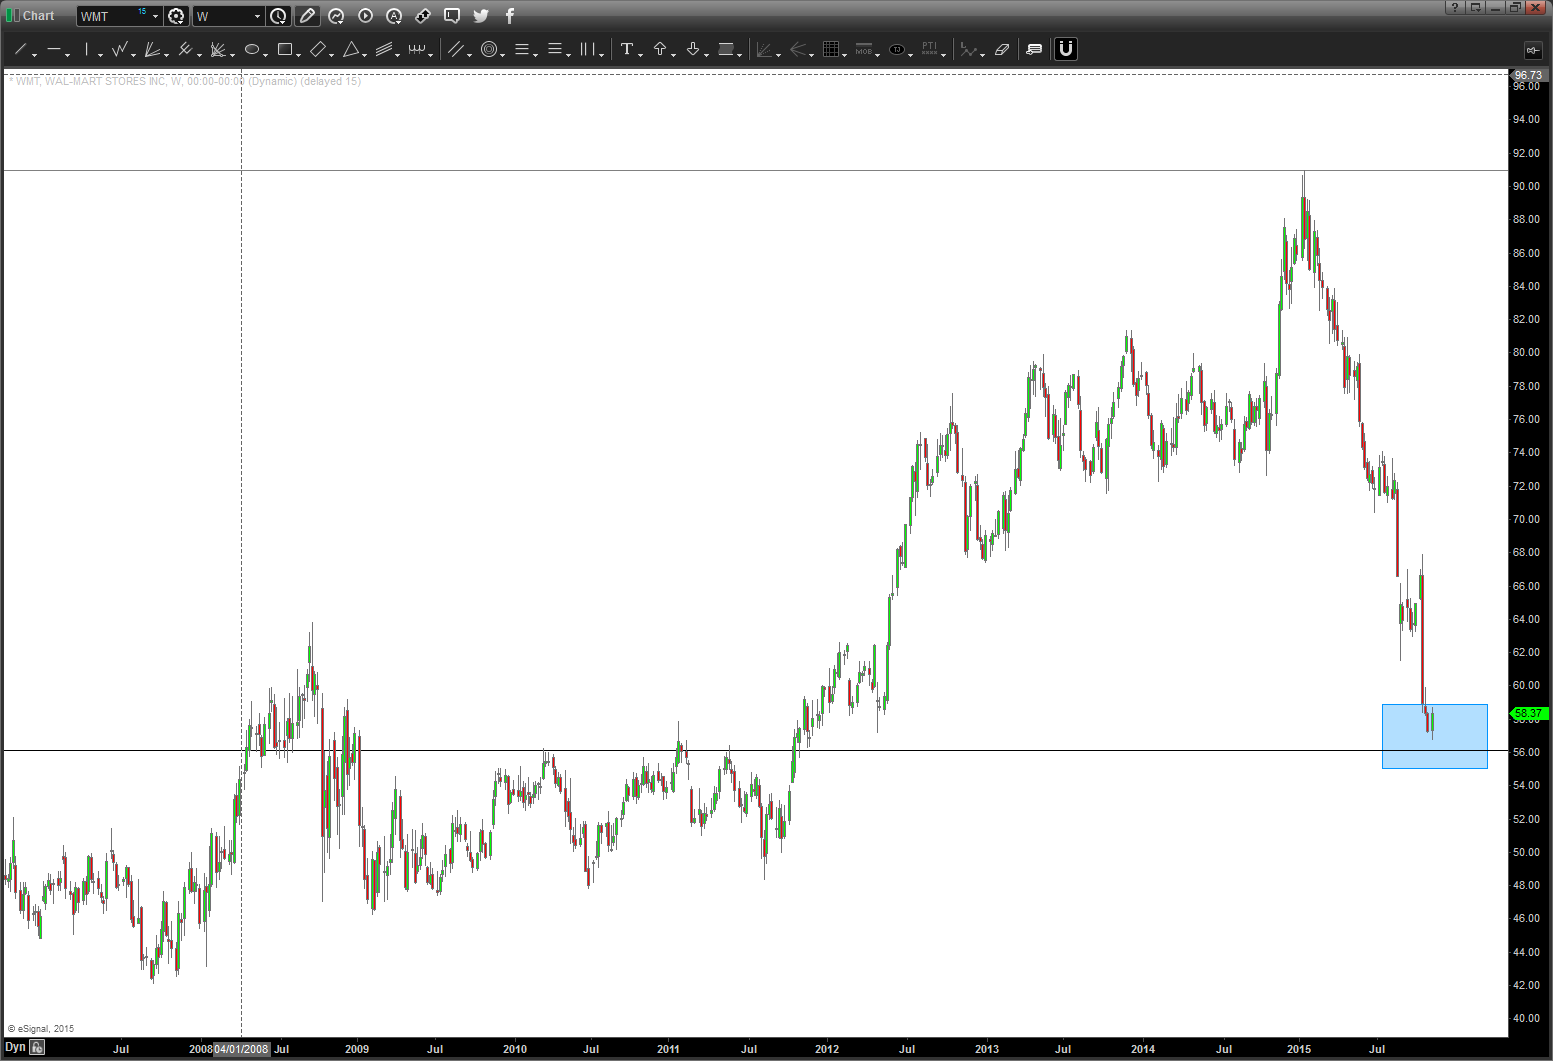
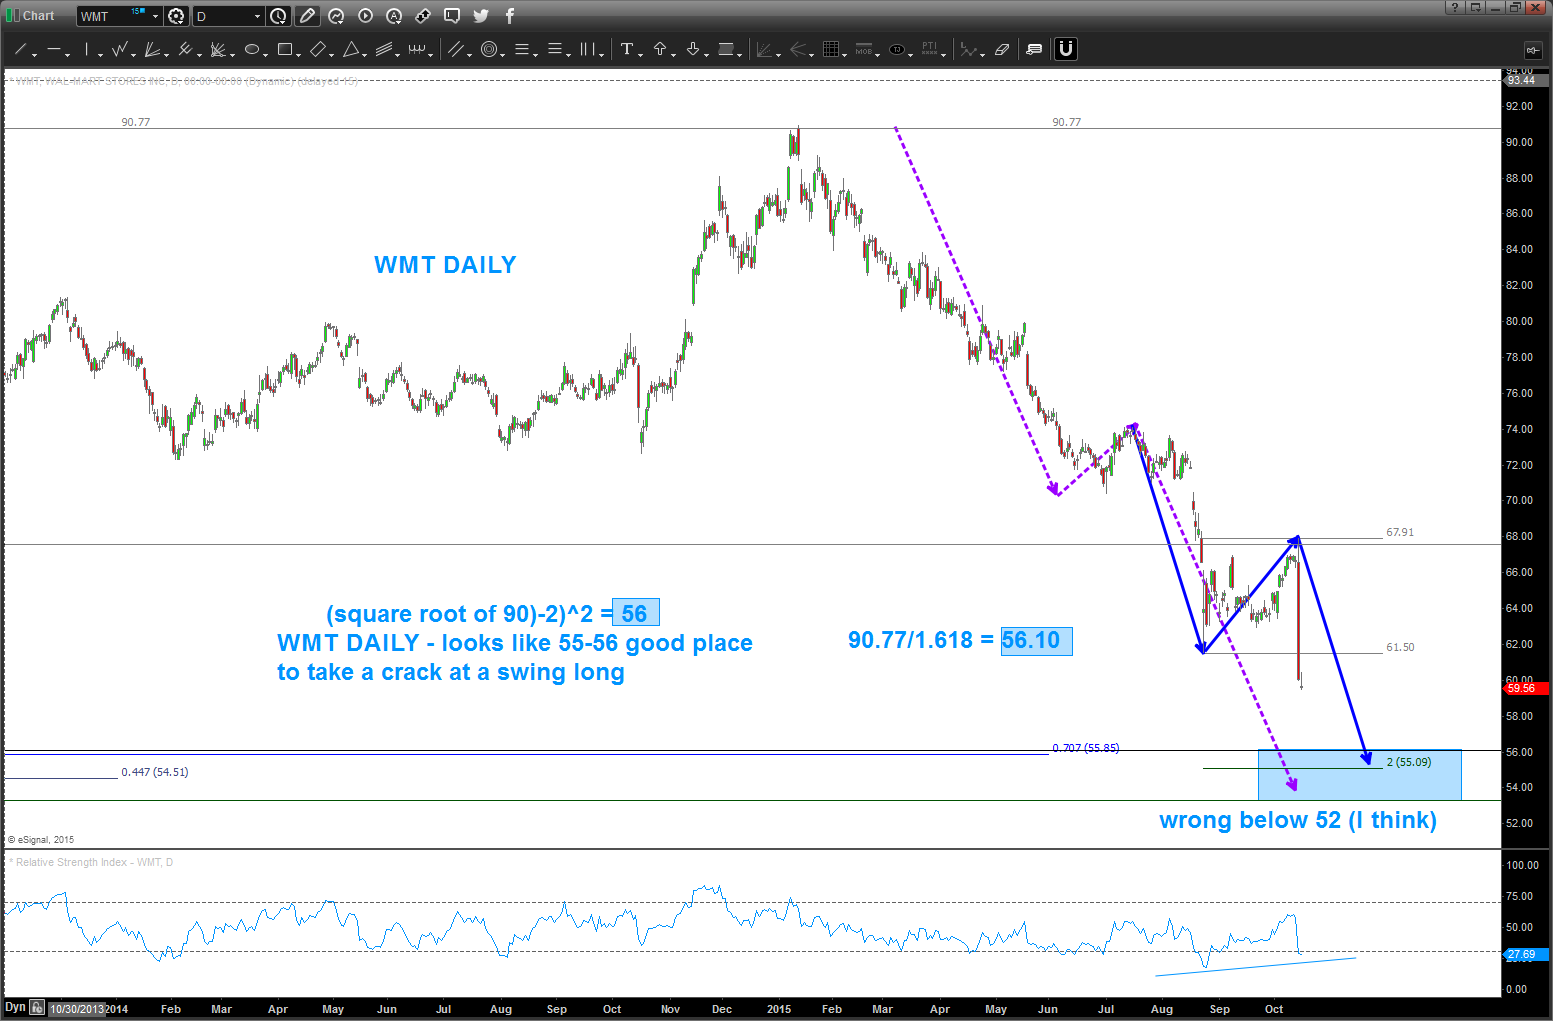
Here’s the daily chart … note the square root target of 56 lands right on the .382 retracement from the all time low. I like that … watch that 55-56 level.
Just another math thing … 90/1.618 = 56. Another reason to like the level.
Here’s the weekly 1/8th projection method …
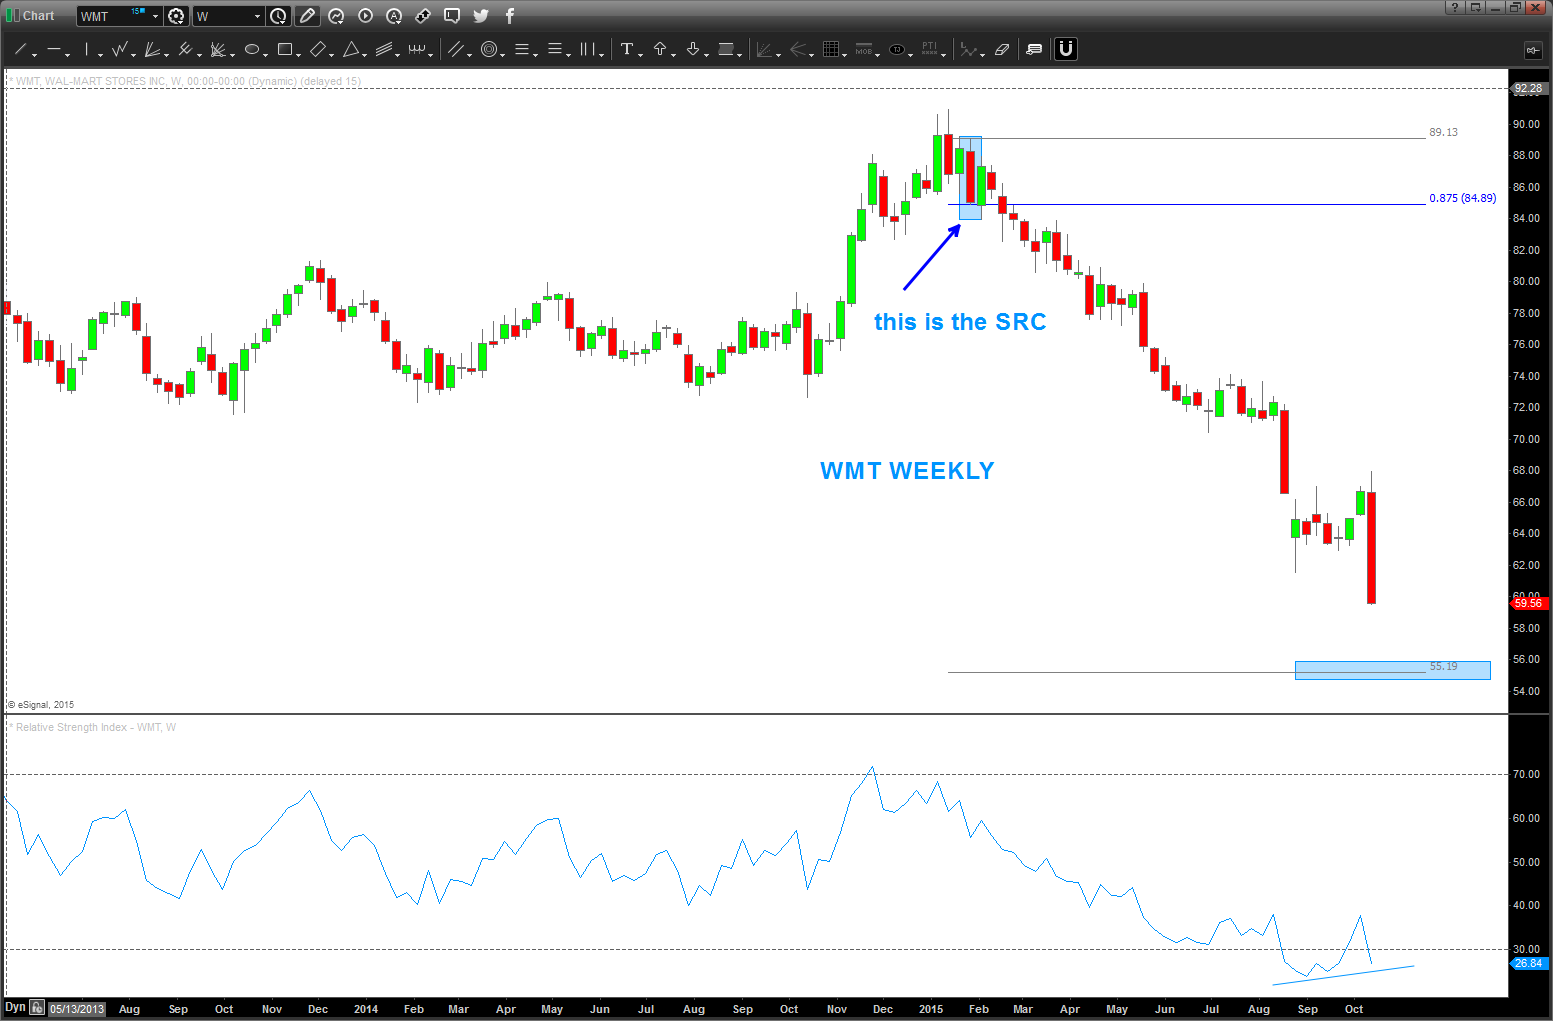
55-56 sure seems like it’s key WHICH MEANS IF IT FAILS THEN WE GOT SOMETHING REALLY WRONG AT THE CIRCLE K.
B

Hi Bart,
I admire your work looking back over the Walmart charts. Will be interesting to see if we keep pushing here to higher levels. Thank you for posting these, excellent analysis!
Alan, thanks for the comments and visiting the site. Let me know if you have any questions.
Pingback: Walmart WMT | Bart's Charts