UNG – March 13, 2023 (update)
Last post on Natural Gas: https://atomic-temporary-44460632.wpcomstaging.com/2023/02/24/natural-gas-part-ii-february-24-2023/
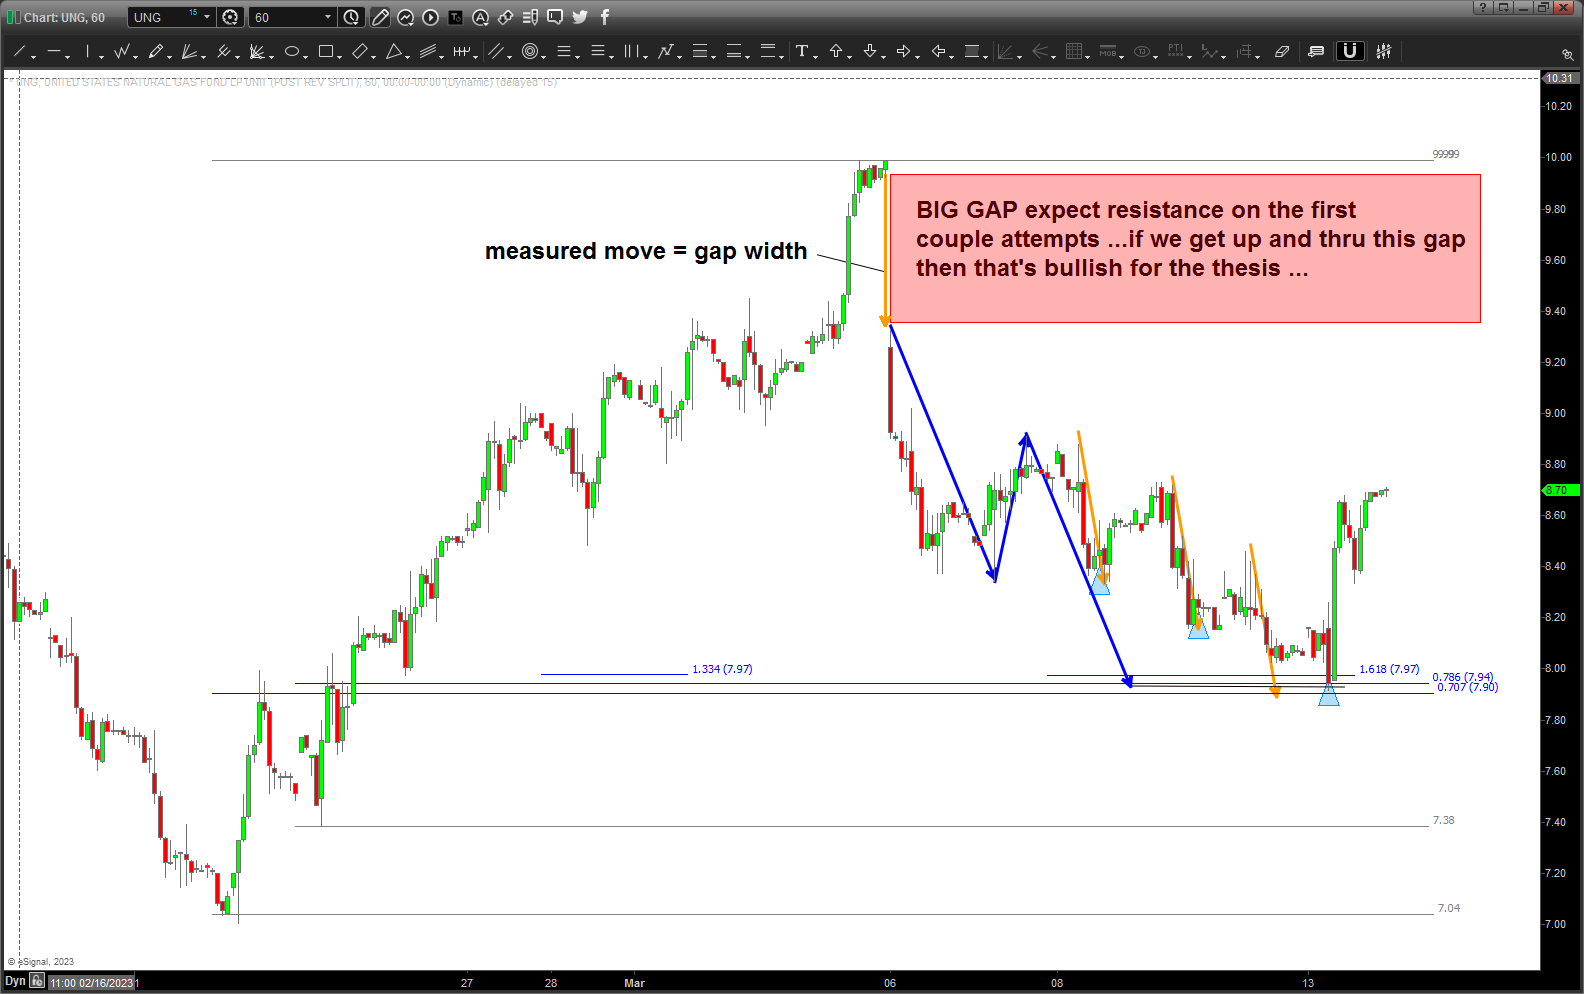
That gap down was a bummer … but, we have found support and bounced nicely. As you can see above, any move higher will run into the wall of China above (big gap) and probably fail the first or second time. But, obviously, we want it to close up and above that entire area so that is the immediate resistance.
The “ideal” PATTERN we would like is the a-b-c EWT corrective sequence that will set up a GART BUY.
You know I don’t like to do the “could have would have should have” but there is some nice little coloring techniques/tricks in the chart above so let’s take a peak.
First thing is to note the ABCD (blue arrows) into the low .. then, we have both a .707 and .786 retracement level with a 1.618 extension. I also (which I like to do, alot) extended off the last low before the march to the high and that was a nice ratio from the equal octave scale of music : 1.3348. Then, one last, take note of the “gap area” because that defined the measured moves into the low. No kidding … then, those orange measured moves set up what? A three drives to a bottom BUY pattern. (blue triangles).
