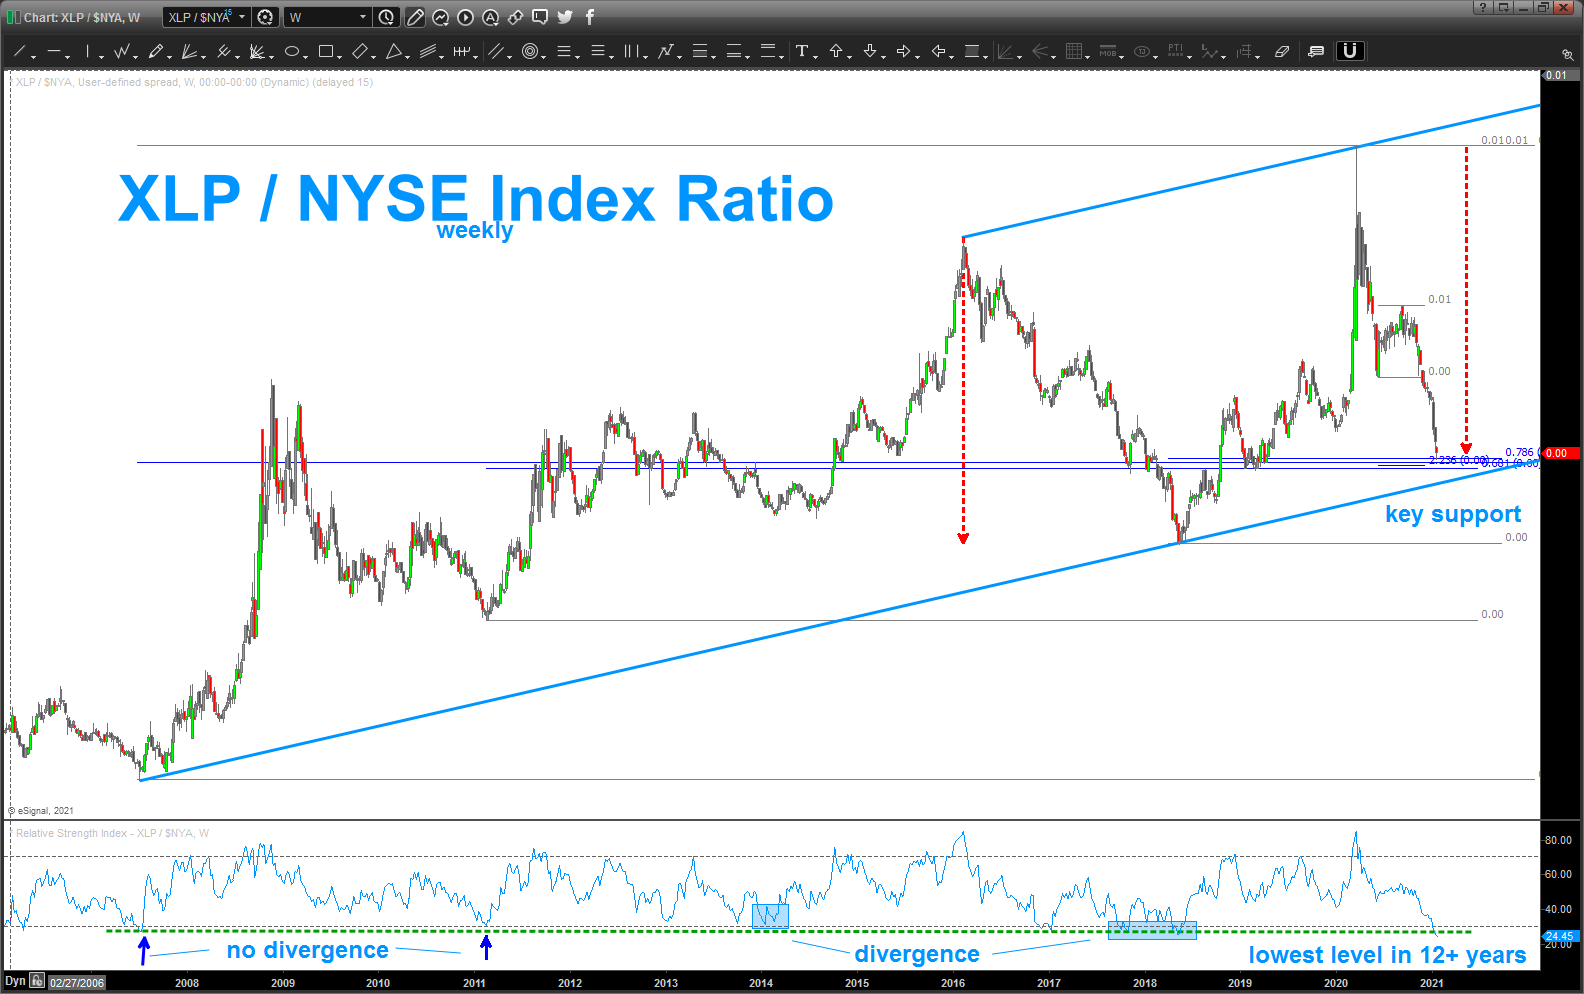
Ratio analysis, key level hit on the XLP/ NYSE Index
we have a very KEY level of support on the XLP/NYSE Index ratio.
as you can see below … we have the measured move (dashed red line) equal to the largest correction in the ratio since the low in 2007 and w/ that the lowest level on the RSI in 12+ years. note, a bullish divergence does not appear to be needed for the ratio to find support …sometimes there was some bullish divergence and other times it just hit the support level and reverse higher. I do think it’s necessary to to take this into account.
then, we have a significant amount of math coming into this level w/ the .786 retracement from the last swing low hit last week.
lastly, we have key trend line support a little lower … this is a “good” trend line because you can see that it was respected as resistance when we copy/pasted the lower trend line onto the higher prices to create the blue trend channel … bottom line is to expect support in the ratio.
so now to the IF and THEN statement of using PATTERNS.
IF the ratio does find support THEN the equity market should correspondingly correct/move lower. ELSE, a blow thru to the downside of the ratio will make the market continue higher and, perhaps, w/ force.
we will be in that key decision making process – next week.
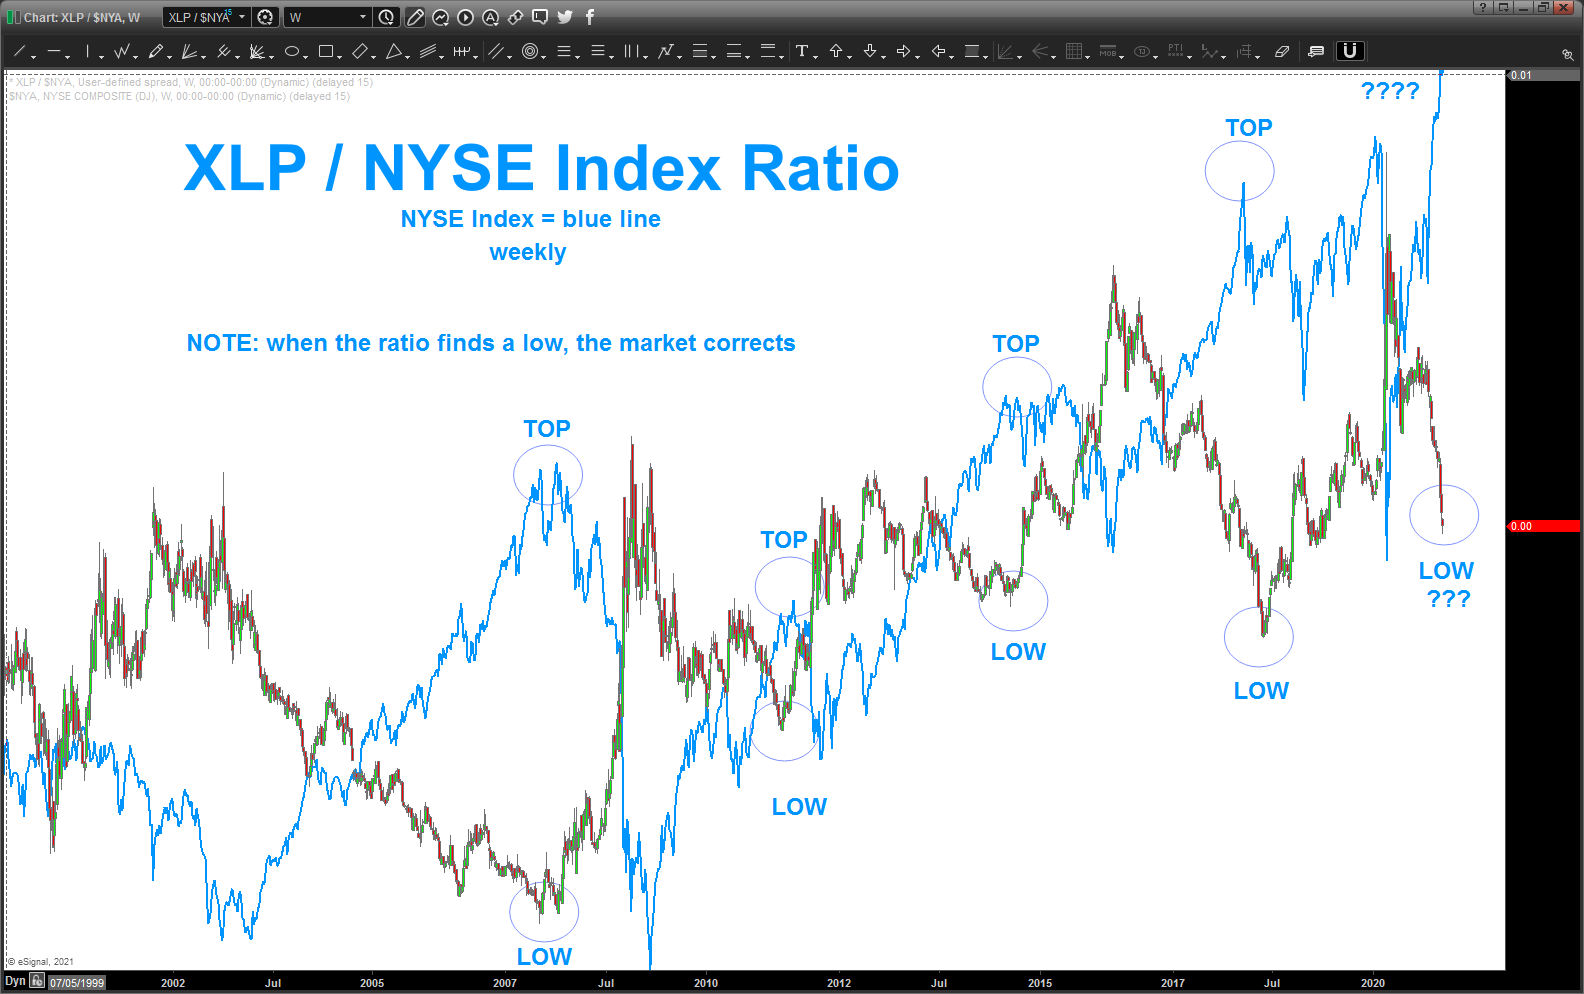
the second chart is just showing the NYSE Index overlaid on top of the ratio .. as you can see when the ratio finds support, the market corrects – every time.

Pingback: XLP/$NYA – intraday update – Bart's Charts
Pingback: the Ratio … XLP/NYA giving us clues – Bart's Charts