the Ratio … XLP/NYA giving us clues
the last time I posted about the XLP/NYA was here: https://atomic-temporary-44460632.wpcomstaging.com/2021/01/24/ratio-analysis-key-level-hit-on-the-xlp-nyse-index/
as you can see, the ratio hit this level, held and the market sold off for a couple days. the market strength the past week has been impressive and, with that, the ratio “failed” at the level indicated and, as you can see, we have a pretty big candle that is closing at the low, for now, so it sure looks like the pattern failed.
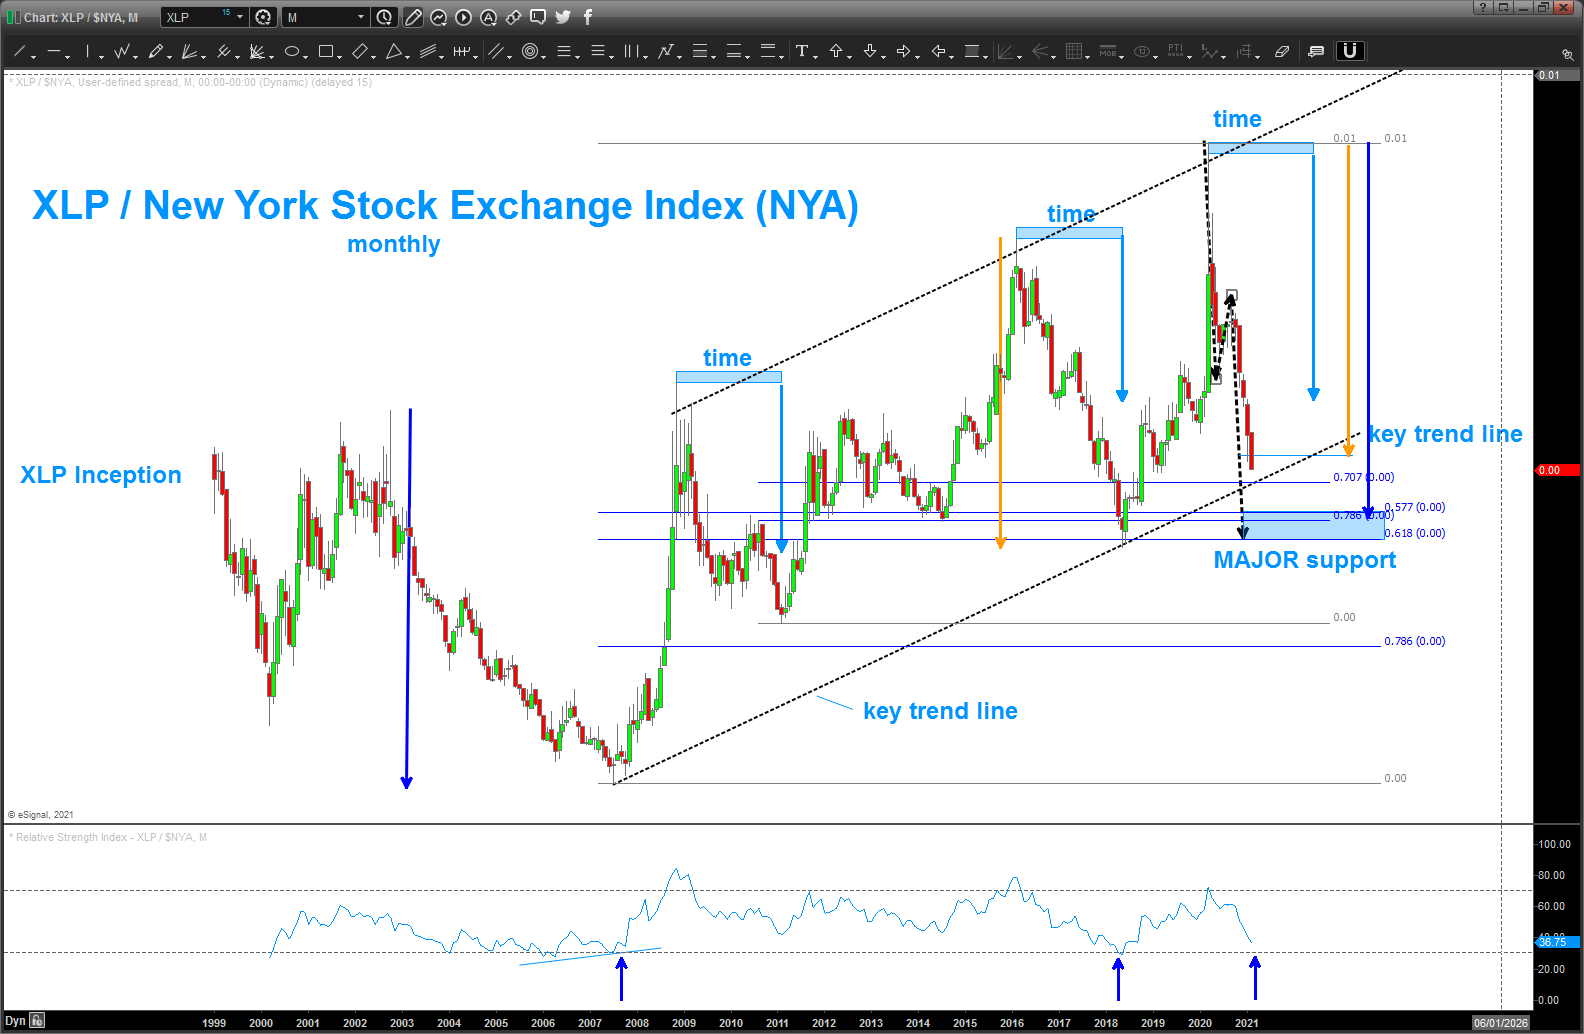
that being said, I’m not overtly bullish here, right now. note the key, dashed black line, trend line is approaching and then below that we have 3 ratio’s, an AB=CD (dashed black line) and the all important measured move from the 2003-2007 time frame. MAJOR SUPPORT for the ratio … also, of note, is the 14 period RSI is approaching a key support level …
could the market continue higher from here – of course – but there are some other sell patterns present on other indices so I’m just going to be flat/neutral here.
one last, note the TIME of the corrections .. on this leg up from 2007 the corrections (blue rectangle w/ ‘time’ written on top) has been nearly perfect and, if that is the case, then this current leg down, from a timing perspective isn’t ready, yet.
could we be at the start of a parabolic move higher? let’s wait and see what the “MAJOR support” level does before we get too far ahead of ourselves.

Pingback: the ratio (XLP/NYA) is the ONLY thing I’m watching w/ regard to equities … – Bart's Charts