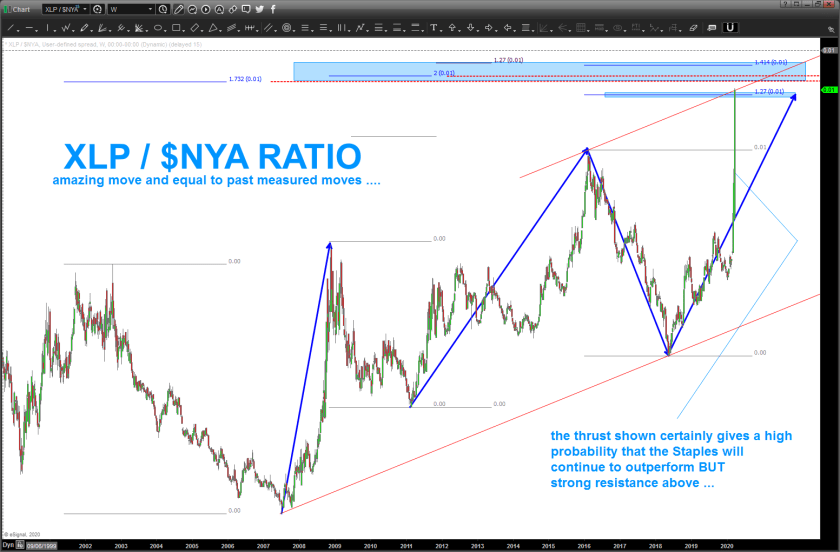
the ratio … what’s it saying

if you want to take a peak at what we’ve been doing w/ the XLP / NYSE Index (Staples/overall market) then search for XLP on the site at the top right of the home page …we very clearly saw the ratio bottom and start back up (which means, on a relative strength basis that staples were starting to outperform (negative for equities)) back in late December and January. what is fascinating to me is the STRENGTH and VOLUME of the candles of late. frankly,they are blowing away the candles from the 2007-2009. it sure looks like, from the ‘big boy lens’ (hedge funds, relative value funds, institutions, etc.) that they are moving into the safer names (staples) in a BIG WAY. I trust this ratio because, as you can see, it’s been responsible for guiding the MAJOR tops and bottoms since the XLP ETF was created back in 2000.
per the chart below, we are in uncharted waters … however, note the blue rectangle areas. if we take these areas and then look at the NYSE Index that I just blogged about earlier THEN we could very well see a sustainable bounce (note I did not say end of the dumping) but a bounce … so, pay attention to the level on the NYSE Index and also the blue rectangles below …