COST Costco

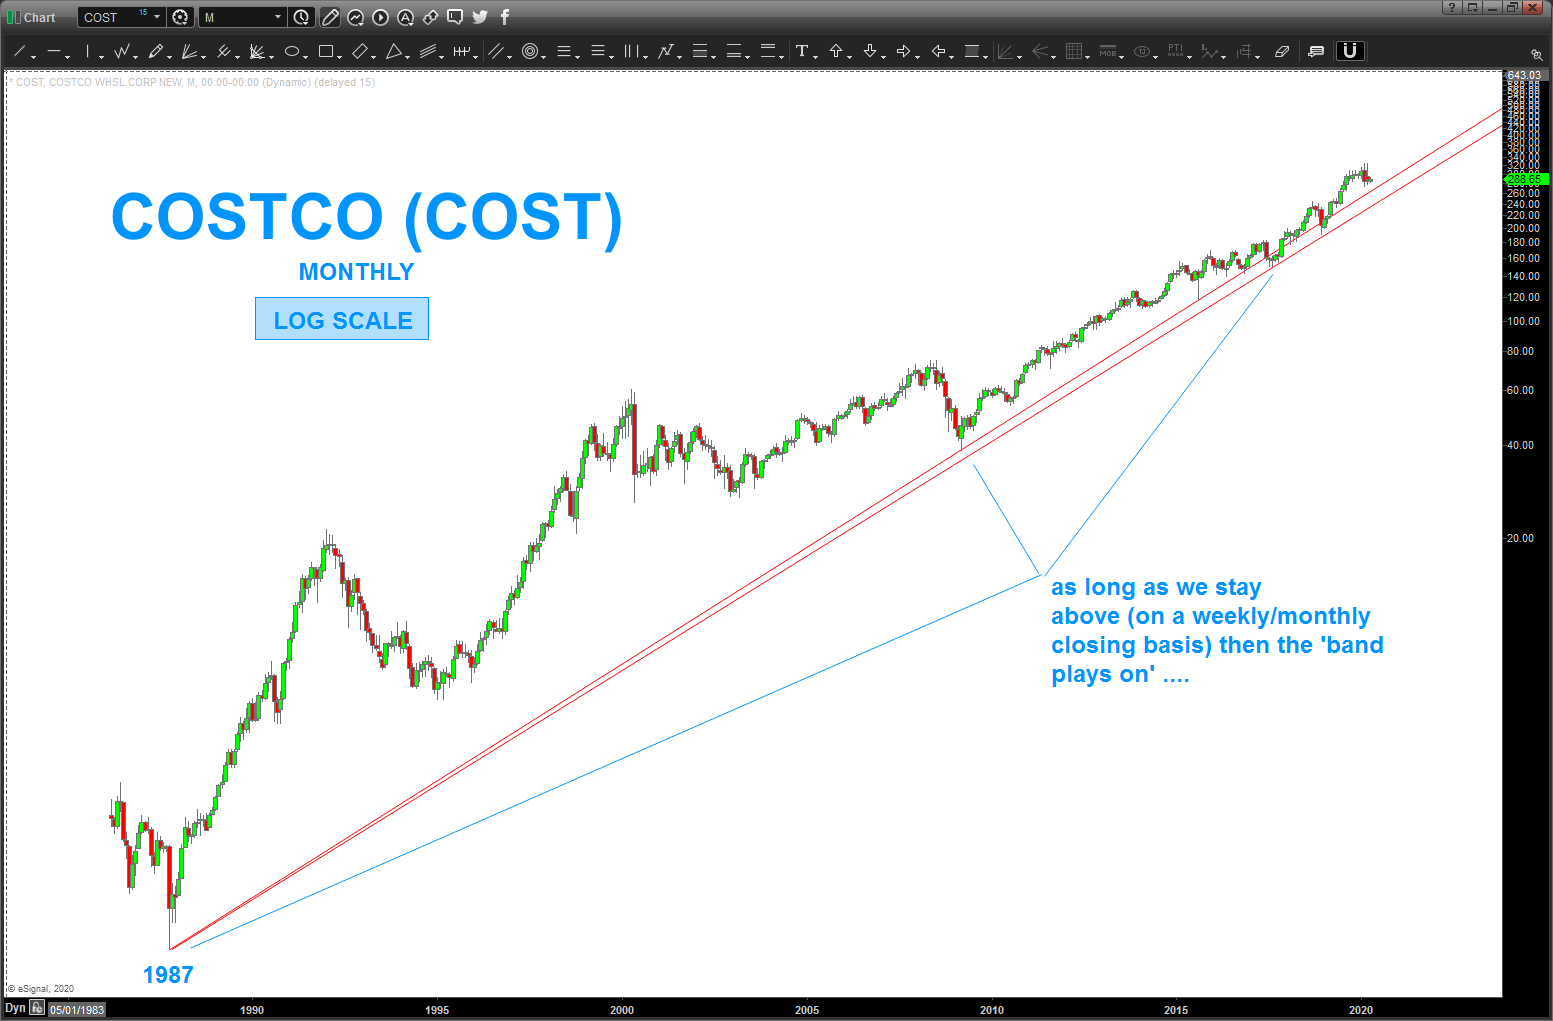
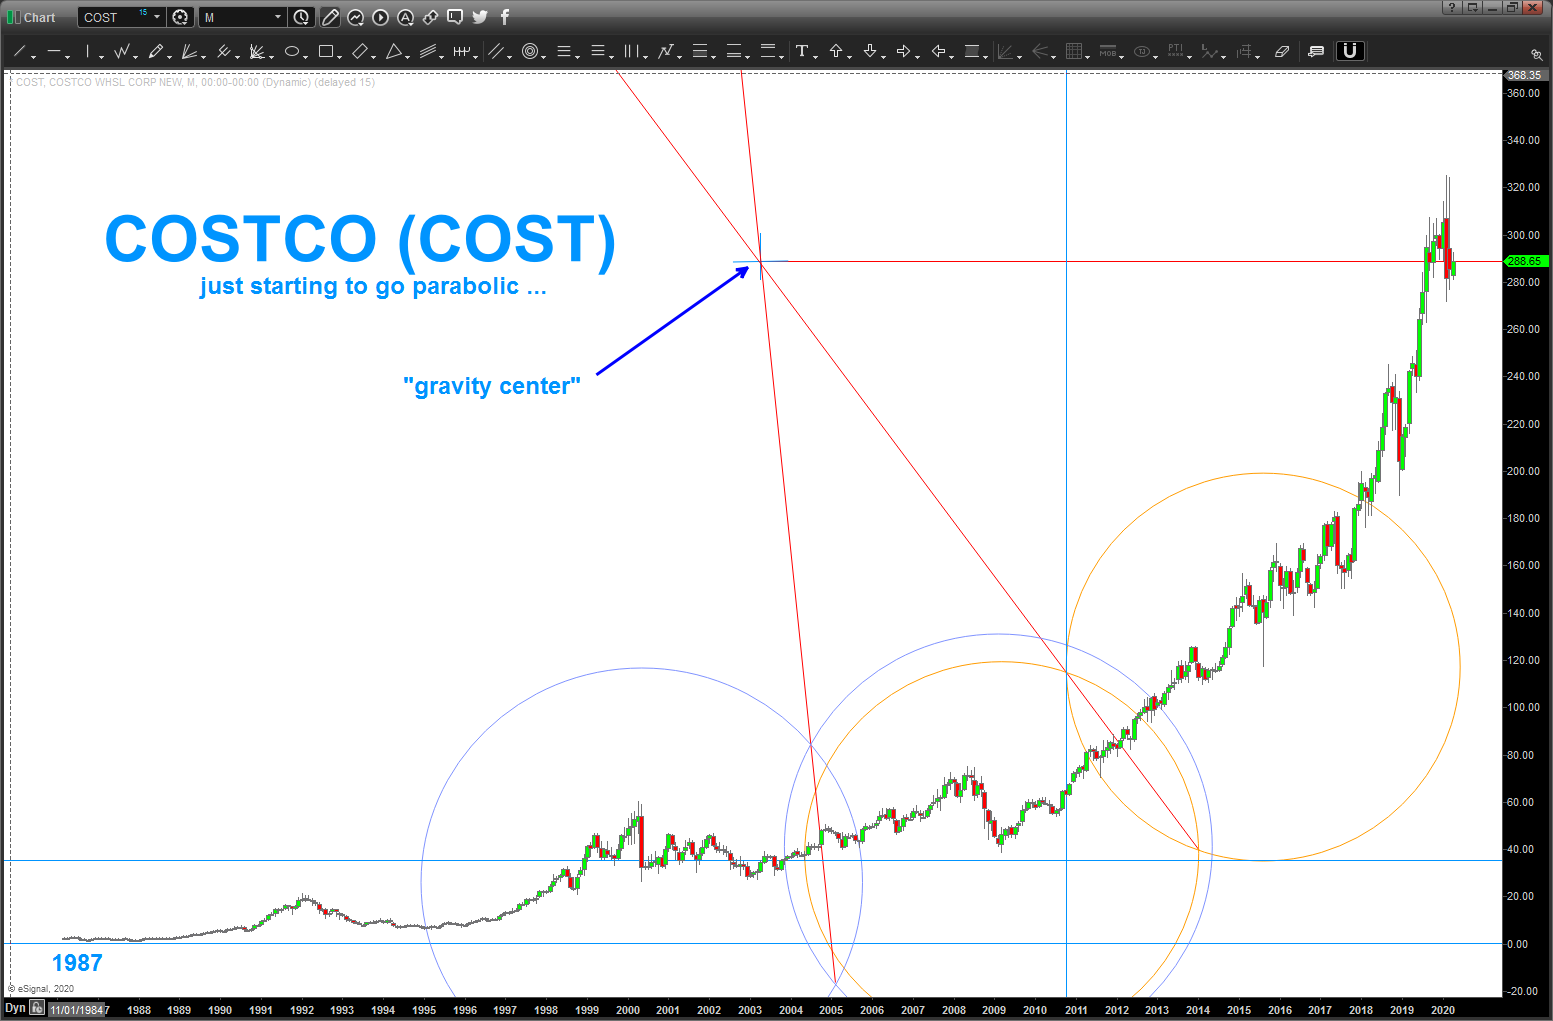
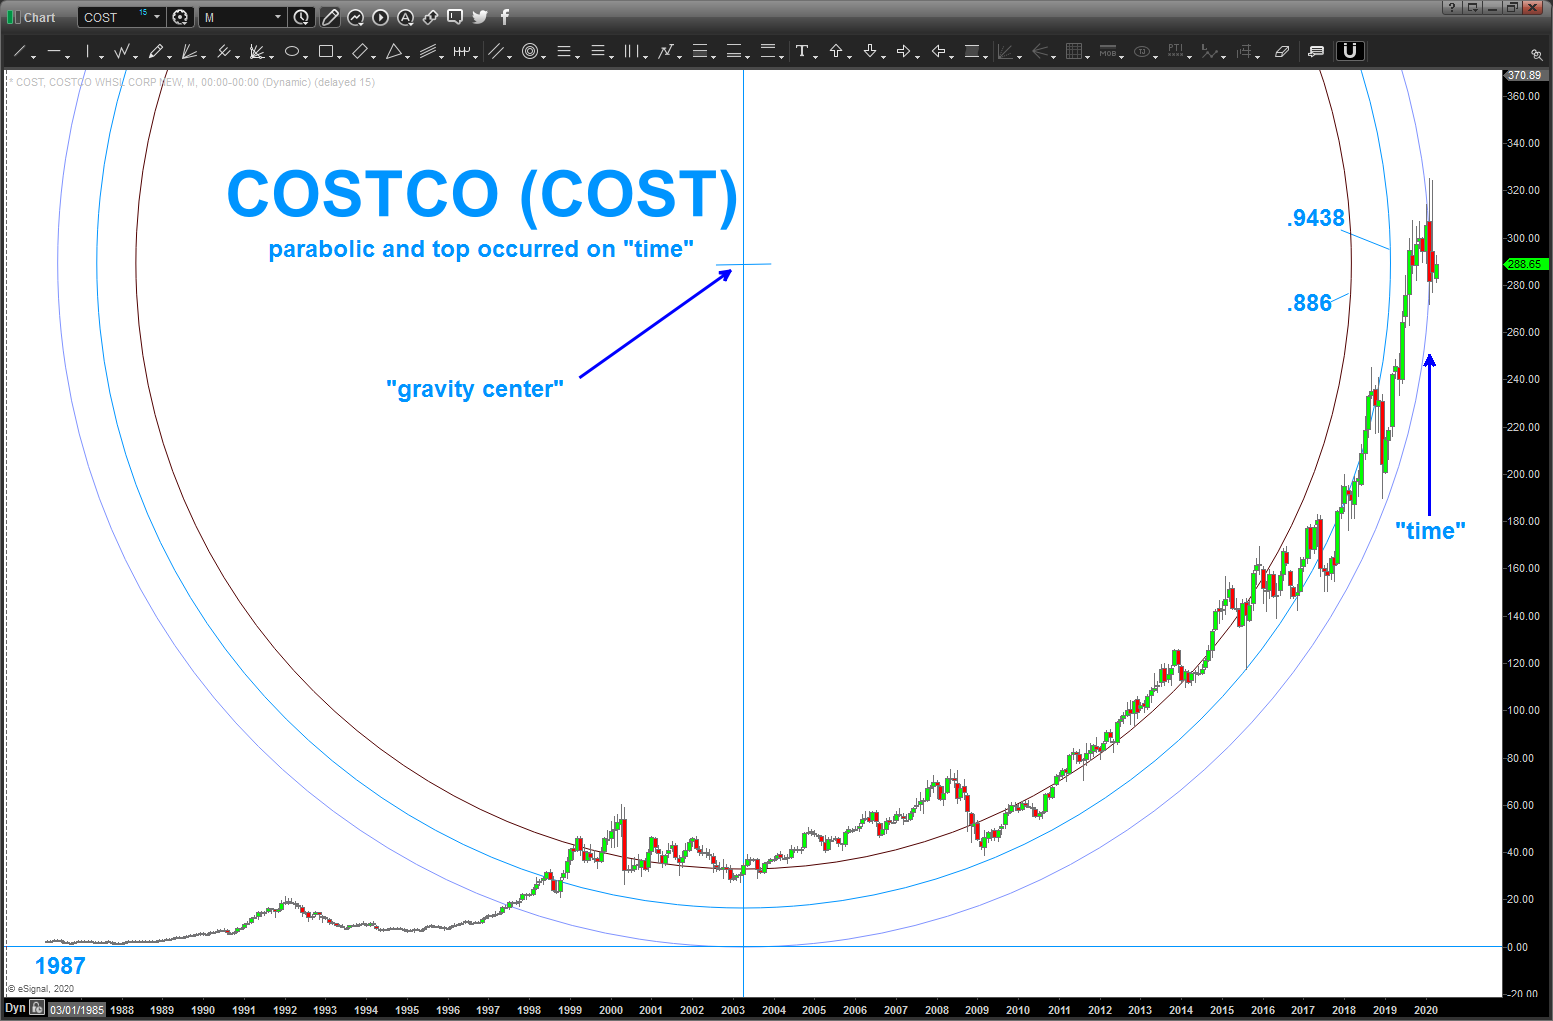
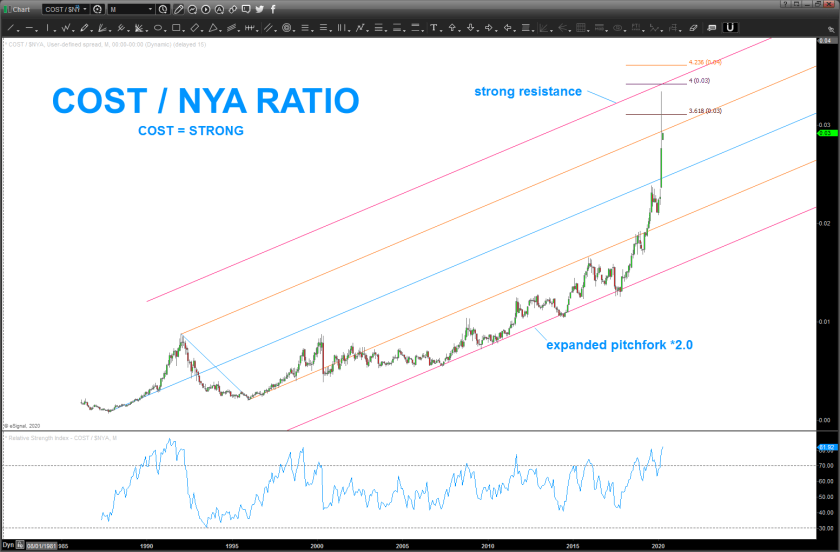
some significant relative strength shown by COST and, relatively speaking, guess people need their TP and bulk during the COVID. who knows …hard to get an accurate projection because it really hasn’t done a big correction – ever- to do a projection. some stuff to consider … 1/ it certainly looks like its going or gone parabolic. did a quick 3rd grade geometry trick and took 3 points to create a circle … COST has honored it, thus far so we can see that the high came right in ‘time’ of the arc. that could spell weakness in the coming days/weeks. 2/from the all time low in 1987 we have a very well defined LOG trend line and it’s NEVER been taken out so as along as we stay (weekly / monthly close above) those two read trend lines then the band should play on ….3/ the ratio of COST/NYA is showing the strength and we do see some resistance now and ahead …
note: I honestly never try to “curve fit” anything, I just picked the three points to create the arc and just did it … the fact that it appears price and time are holding to the arc doesn’t surprise me as I have 1000’s of hours on the charts and sometimes just see it .. looks like a fit, so let’s just go w/ it ok?
this stock, COST, is one of the more bullish sets of charts I’ve seen out there ….