Banks – where are they?
there is an old adage – the banks lead you up and lead you down. the market has blasted to old all time highs or thru them and the banks…? well, they rallied a little but have not shown the strength of the overall market, especially technology.
let’s keep a close eye on them over the coming days and weeks … important.
here’s the support charts that I posted back in the past to show the patterns at work – it has NOTHING to do w/ me. I just pull out the crayons and try to find the patterns. keep it simple.
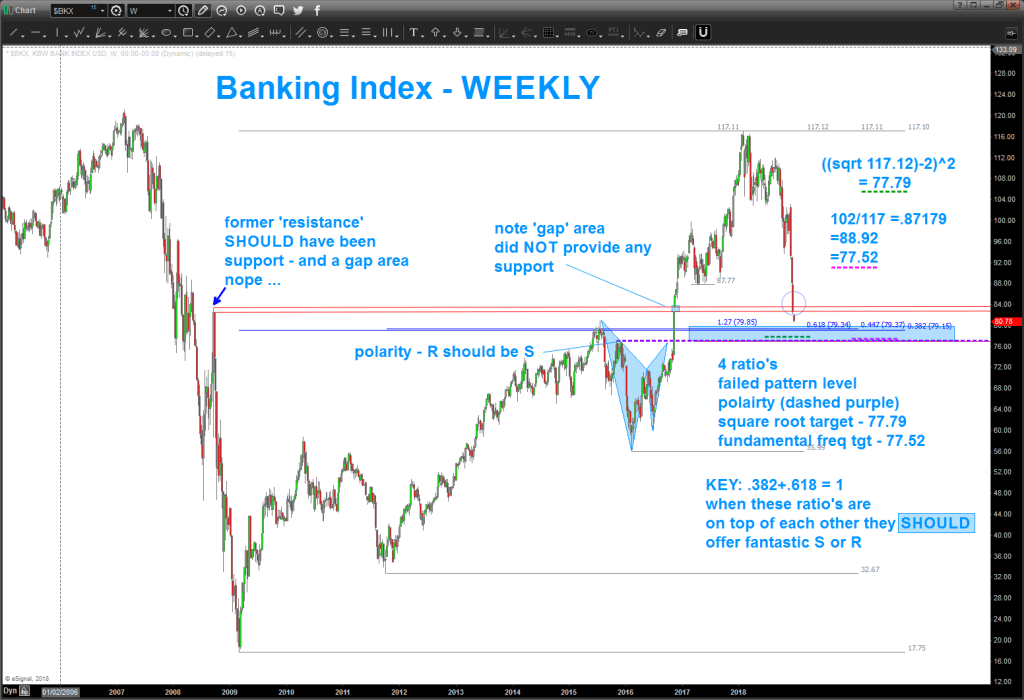
this chart was finding support at the “first” level after a pretty liquidating sell off from 112. pay attention … a LOT of math and patterns coming together. One of the key aspects of the chart below (if you have read this far) is watching for former FAILED PATTERNS.
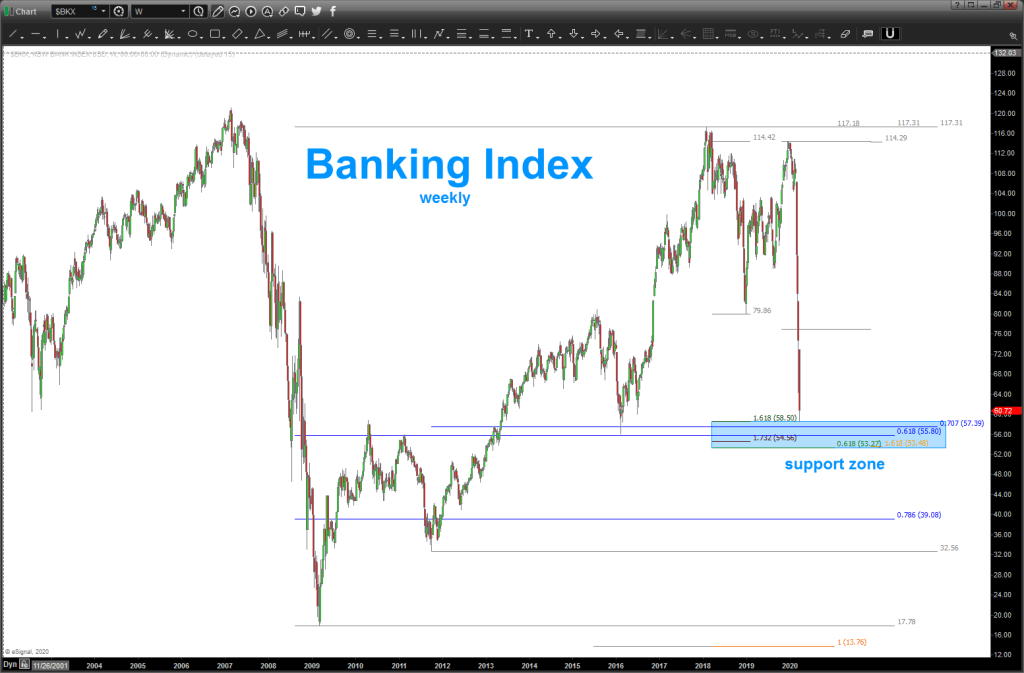
as you can see, that level worked and the banks rallied … I apologize for not having the SELL pattern but I never posted it. Do you see it? After not making it above the 117 level it sold off big time … and, using some math and patterns we found a support zone ….
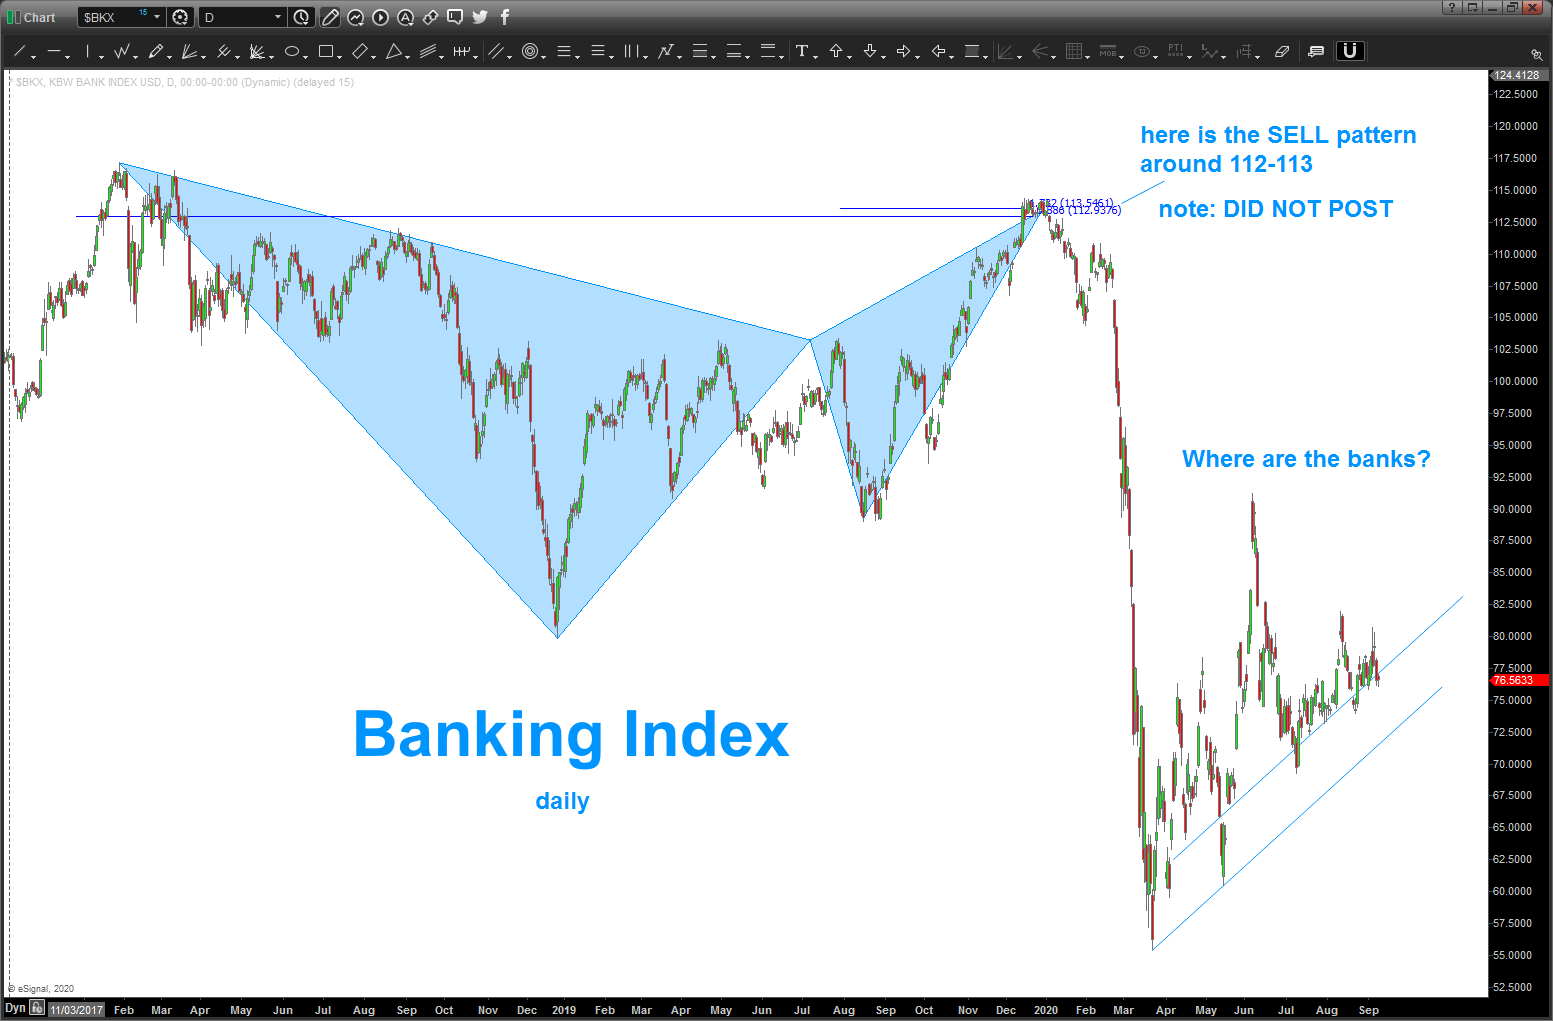
in the chart below I show you the SELL PATTERN on the banks. YES, this is after the fact and I DID NOT post this at the time but wanted to show 1/the harmony of this index and 2/ the pattern for illustrative purposes. the other reason for posting this is to demonstrate the bank rally off the March 2020 lows has been feeble …
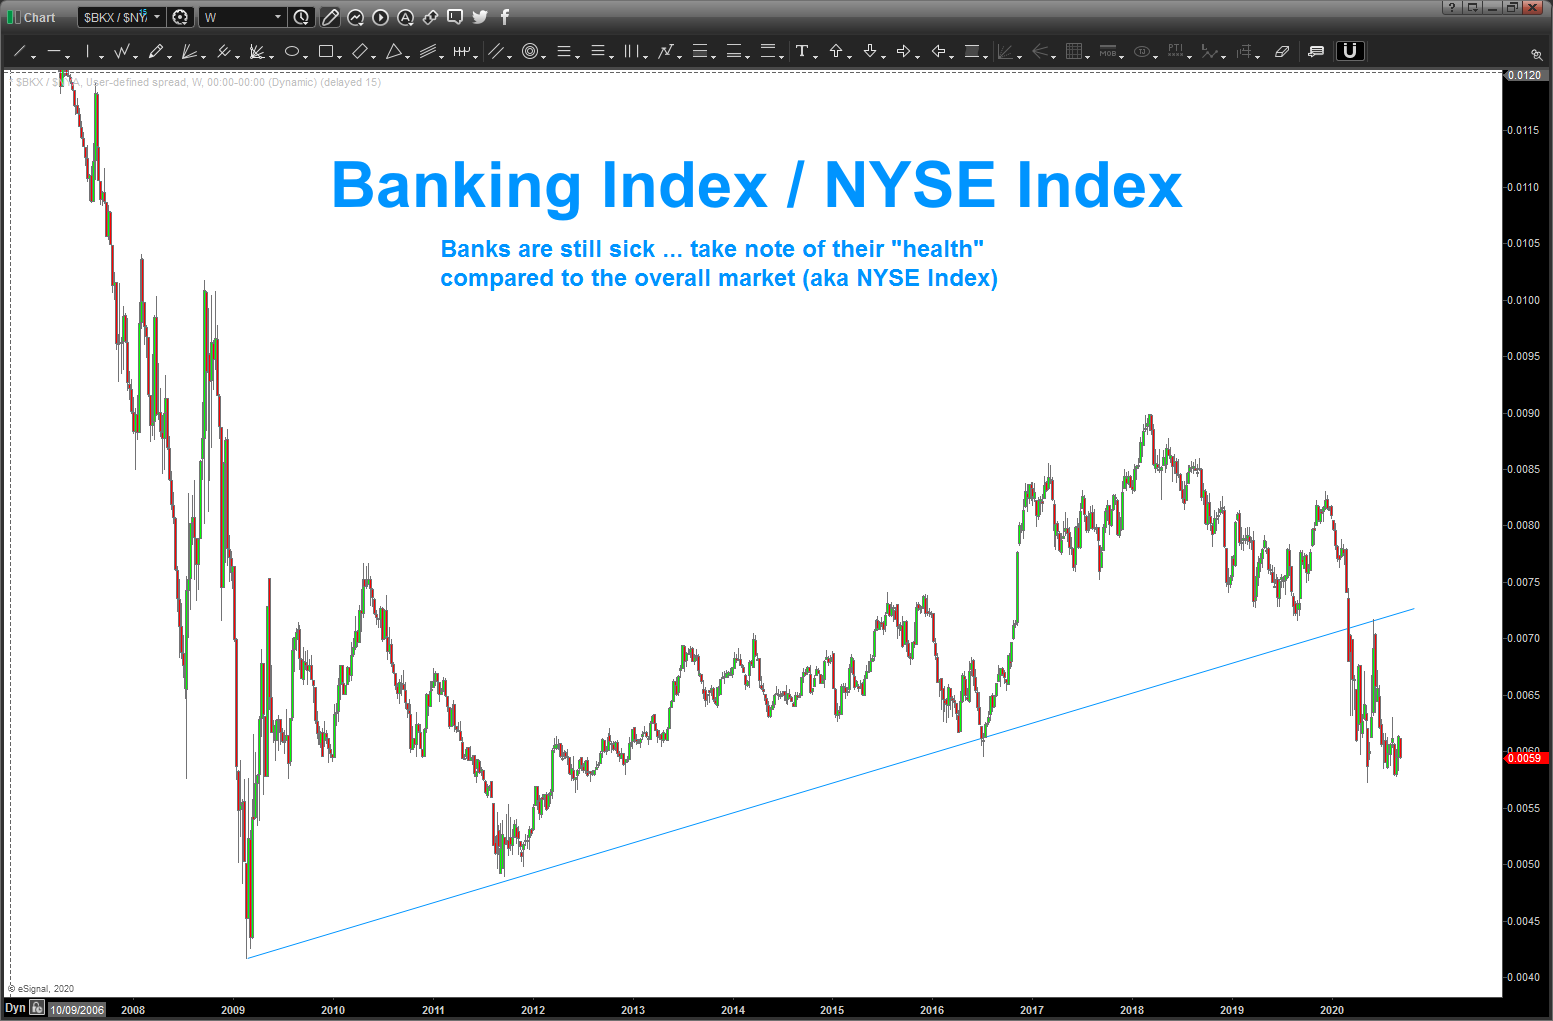
and as we can see, the banking index / NYSE Index is tepid, at best. really don’t think the banks are too healthy right now …