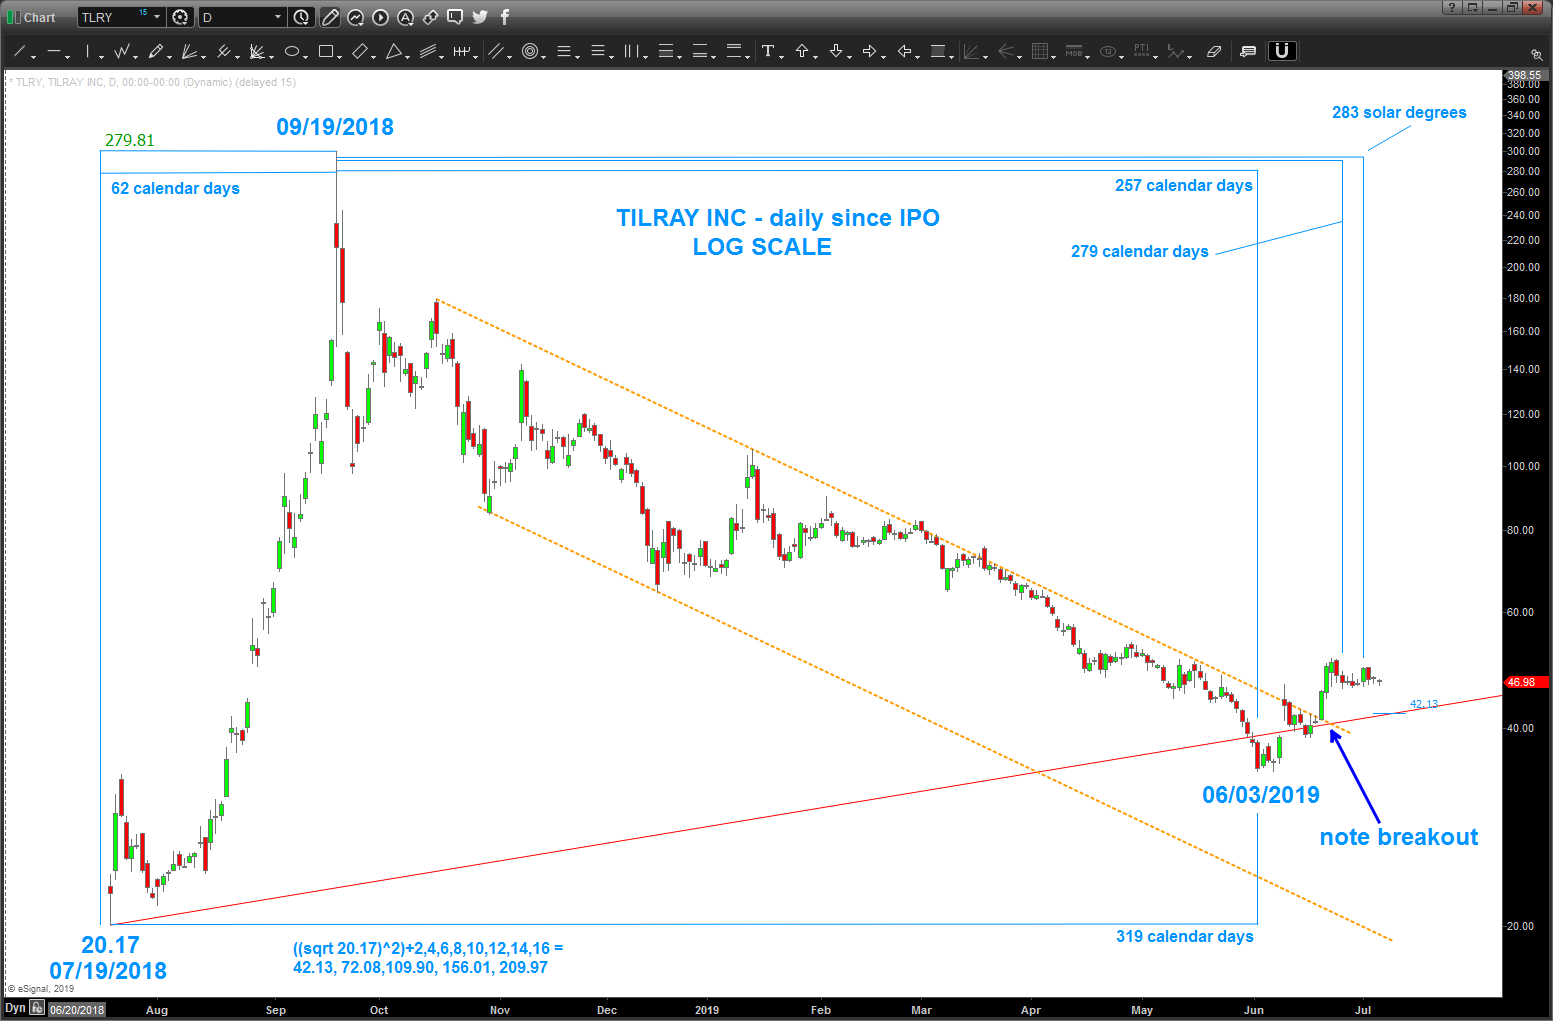
TLRY – major square out complete/happening (TILRAY)
take note of Tilray (TLRY) and put this one on your radar screens.
we have a big ‘square out’ occurring and this theory is based on the fact that PRICE and TIME are the same thing … so, the theory goes, if we start from a low (in this case) and go up to a high then we have a certain amount of PRICE. (in this case 279 points) so, from that HIGH we convert the PRICE to TIME and we get 279 calendar days and we can also use solar degrees and other ‘stuff’ to look for possible turns ..
so, from the former ATH we have a PRICE and TIME square out and we can also use a technique taught to be my friend Michael Jenkins called the Jenkins true trend line … I won’t go into too much detail but just know that using square roots from price and converting them into TIME produces excellent trend lines …
so, TLRY, might have a bottom in place here and I’ll be looking for 42.13 in the next week or so to give me a clue as to where we are … also, note the log trend line (dashed orange lines) held price all the way down, most recently, price broke above that trendline (bullish?) and did it all around the red trend line that came from the low of the IPO … hmmmmm 😉