NVDA
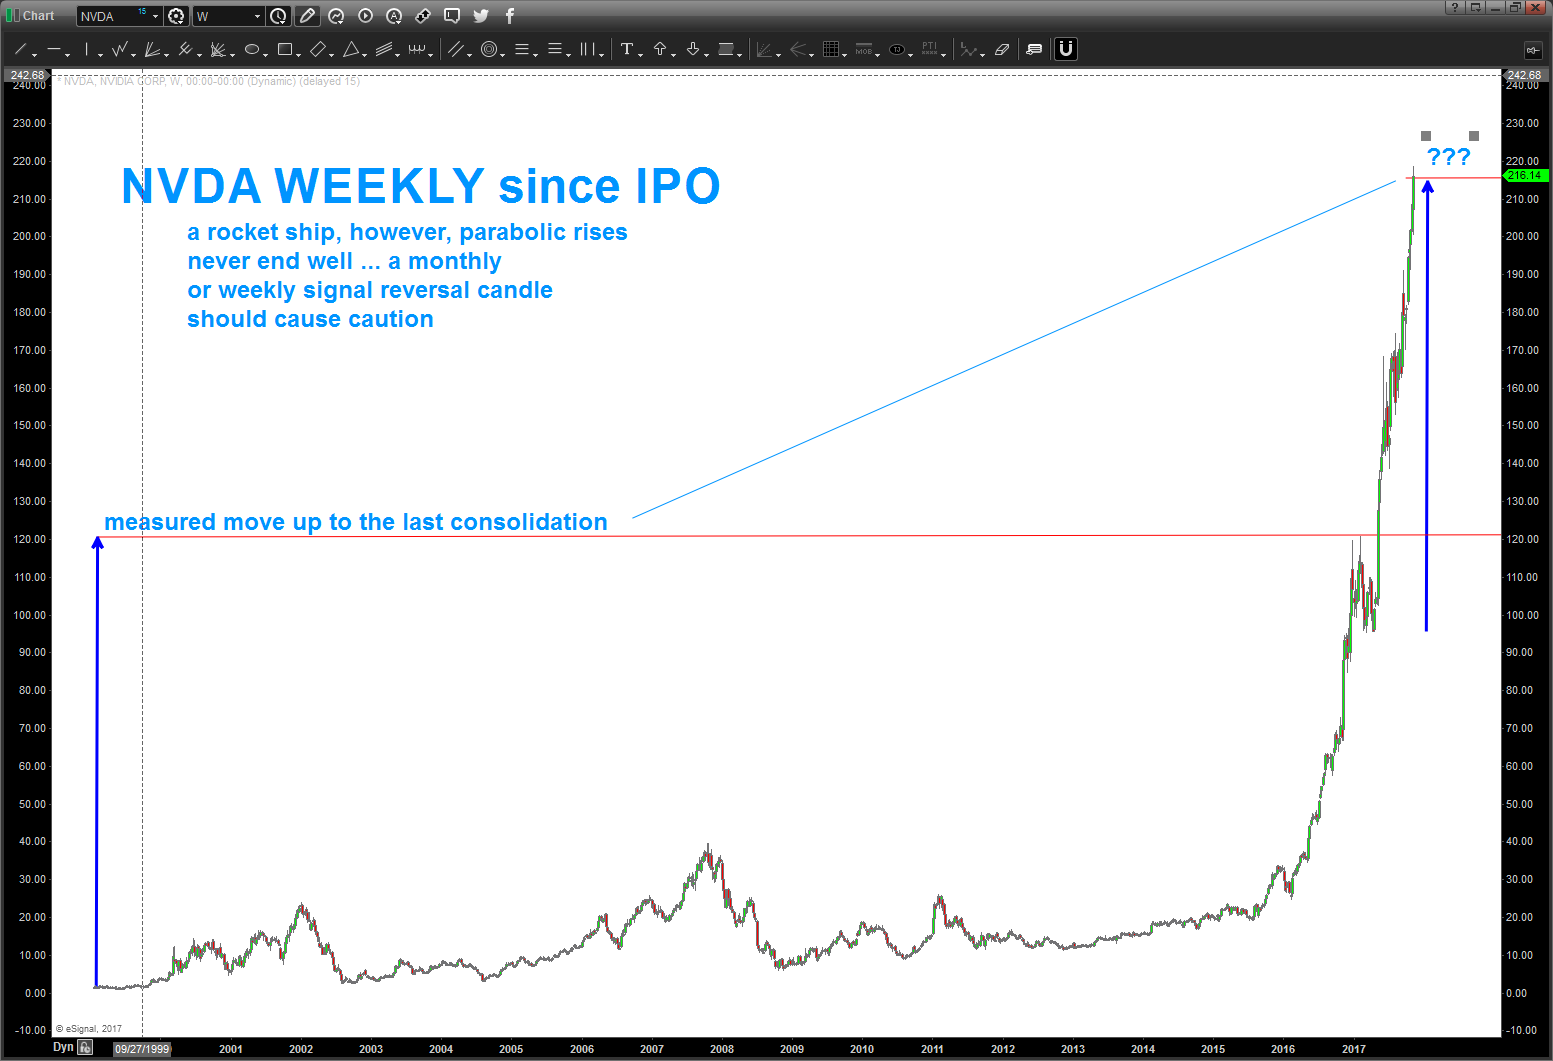
11/12/2017 – been almost a year since we looked at NVDA. Below you’ll see the area ID’d for a correction. This level did hold NVDA at bay and the price stayed here for roughly 6 months and THEN EXPLODED. It’s going parabolic so at a certain point, it should fall like a rock but for now the beat goes on …
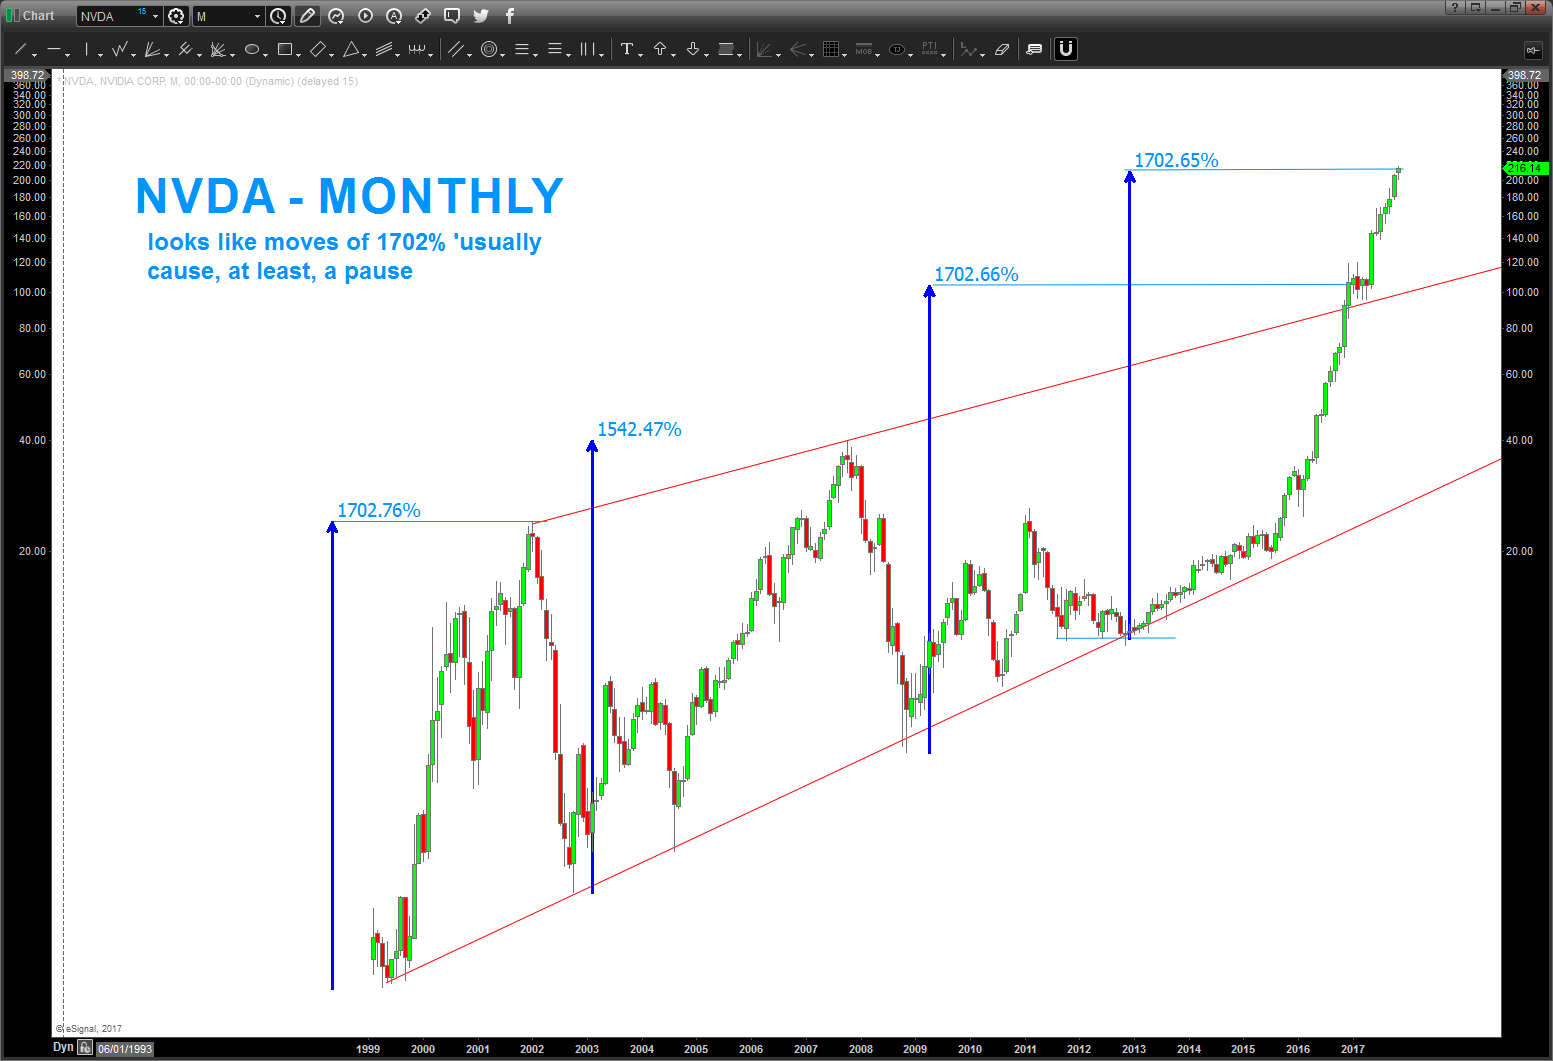
did some basic price techniques that show this area ‘should’ hold it or cause a pullback. it doesn’t have to but it appears that 1700% moves usually cause consolidations or corrections and, yes, you read that correctly: 1700%. What a rocket ship.
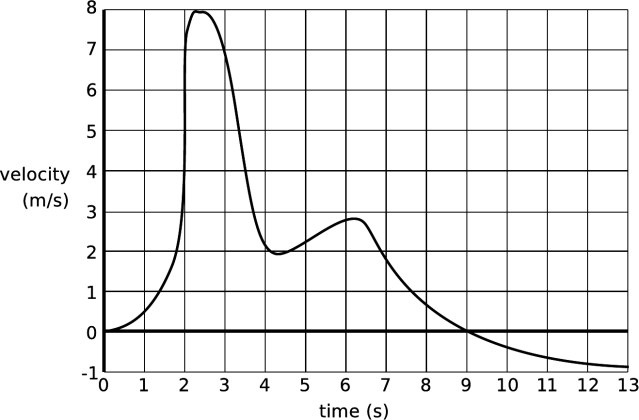
also, you’ll see what happens in the 3rd chart below what happens when the velocity final runs out of gas … it has to fall back down to earth.
———————————————————————————————————
was asked to take a look at NVDA.
what an amazing parabolic run and that’s what scares me right now … parabolic explosions do not end well so I expect now to very soon a very violent and CORRECTIVE move … however, I’ll watch this stock to find, hopefully, a pattern to BUY because this entire moves feels like a 3rd wave so another leg up is coming but for now … watch for weekly/monthly signal reversal candles to get defensive.
also, note the ‘extreme’ reading on the RSI. there is no bearish divergence, yet. so, it certainly appears that it needs/wants to correct from current levels to ‘set-up’ the bearish divergence play when it gets to new highs. but, again, this correction starting/coming is from a parabolic move so don’t get spooked if it’s violent and much more deeper than anticipated – it’s just working off the parabolic energy that blew it out.
the monthly signal reversal candle level is roughly 85, still a ways away. for now, that corresponds to the ‘top’ of the log trend line is broke out above earlier this month.
hope this helps …
B

