Silver following the script …
What do we know about Silver ….? Well, for starts it was supposedly found in 5000 BC , has a melting point of 1,763 F and it’s atomic number is 47. Also, it sure has followed an ORDERLY, MATHEMATICAL and rather PRECISE PATTERN for the past couple years. I don’t know a darn thing about the fundamentals of silver … I do know it goes UP when there are more buyers and DOWN when there are more sellers. I like to tell people I’m an “Intermarket Musician” in that the only thing I do w/ regards to equities, FX, fixed income and commodities (I like to call them the circle of life) is look for PATTERNS in price and time based on sacred geometry and music. I draw pictures w/ crayons …
So, I have fielded a TON of questions about SILVER and also just watched another financial SILVER commercial and thought, “well, since JC convinced me to blog, perhaps I should post the moves in SILVER and the POTENTIAL move to come and a relatively SAFE and RISK CONTROLLED opportunity to buy ….”
I apologize in advance if the charts get too technical (again, it is BartsCharts) but it’s what I’ve trained my eye to see and since I have NEVER taken an economy or business course it’s this language that I pay attention.
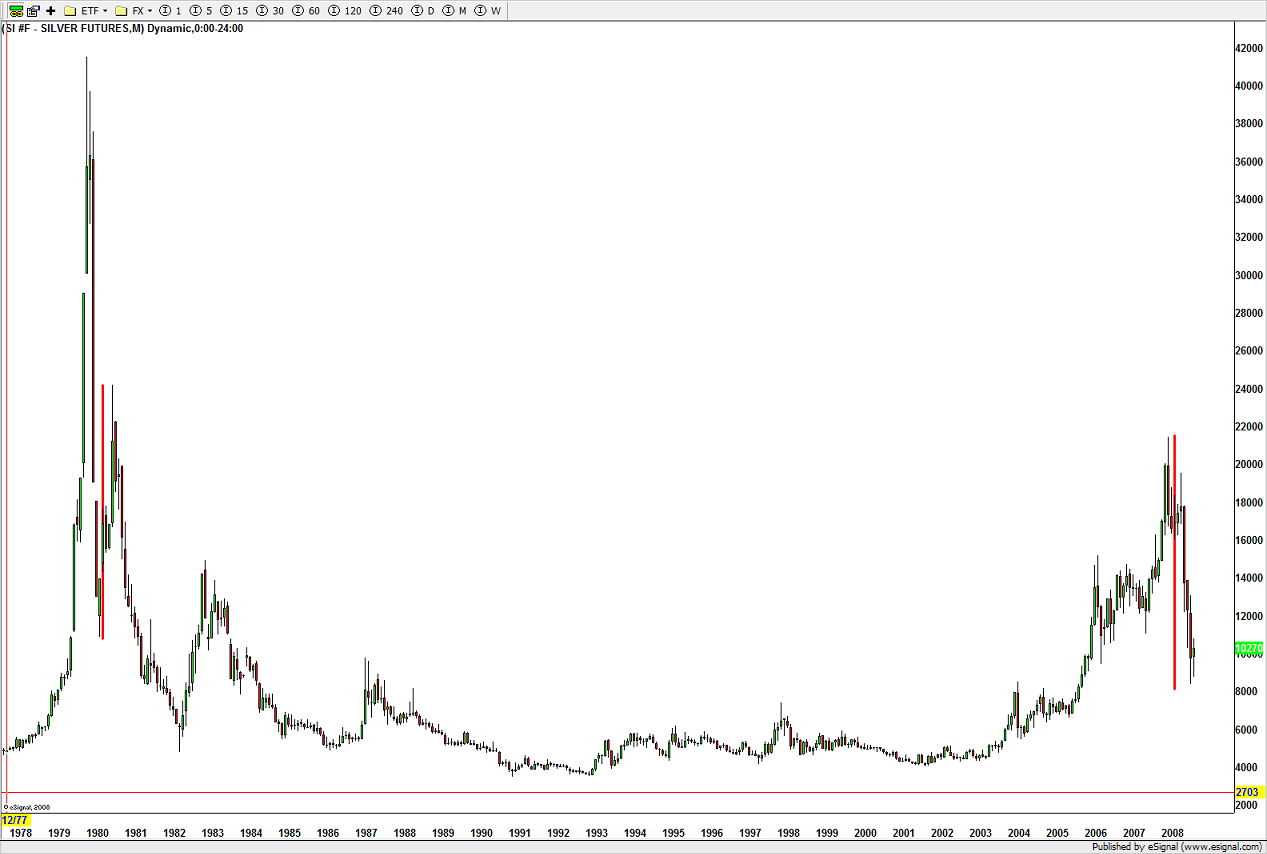
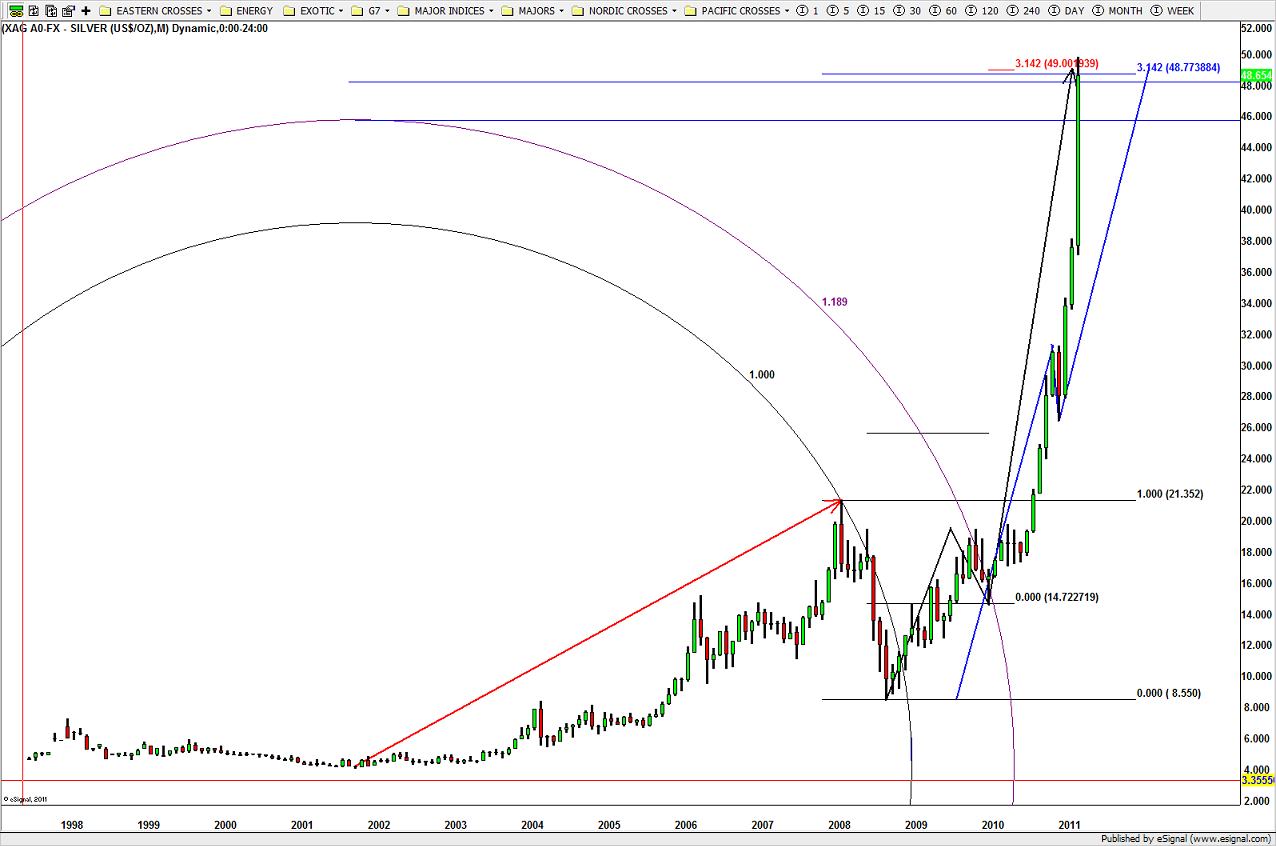
Silver pulling back EXACTLY the same amount as the mirror image from 1980
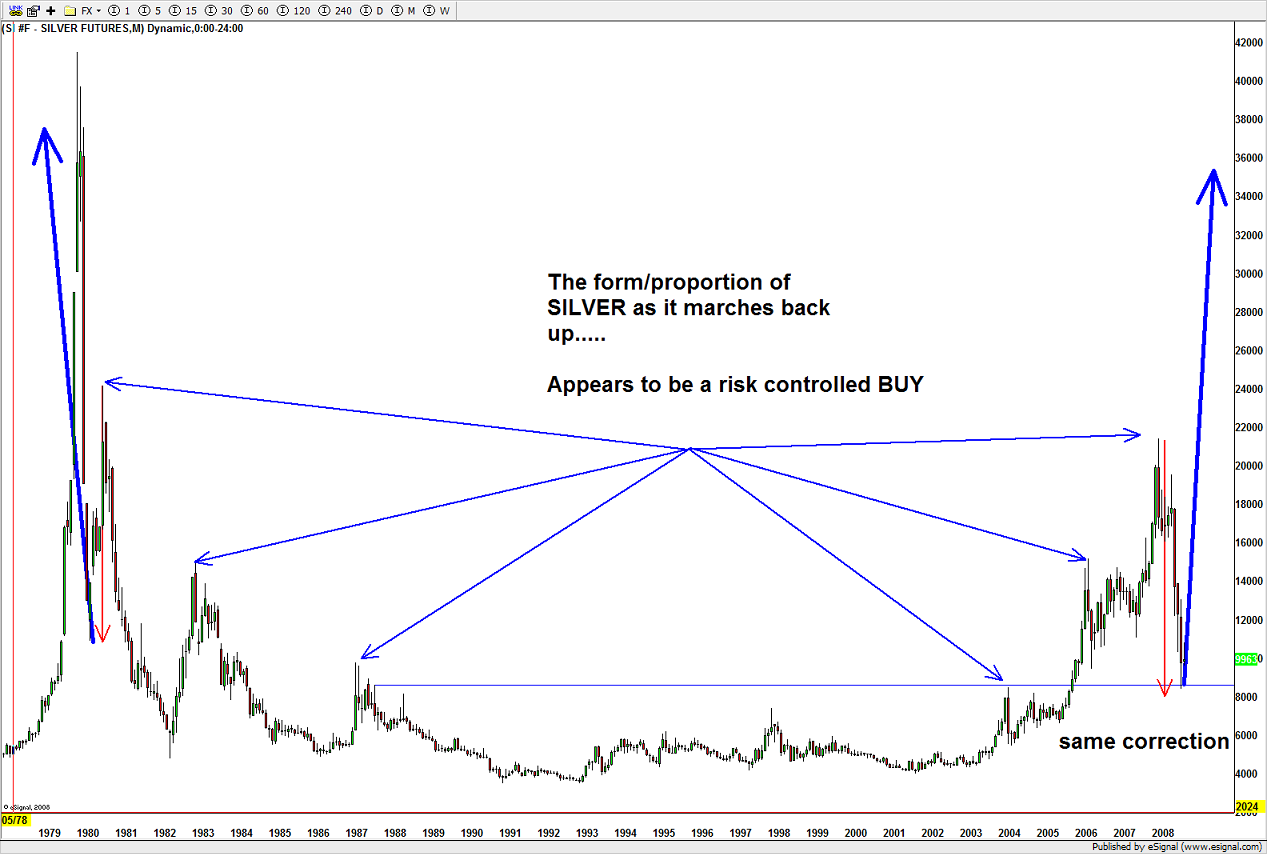
The charts above show the “center point” for a foldback pattern … foldbacks are powerful in that “as above, so below” / “ying yang” / “black white” they will come into a point and leave a point in the same fractal. Note, the center points and the blue arrows pointing to the corresponding “node” which is balancing the move. Bottom line, at key nodes on the foldback you can find different techniques to get LONG and UP UP and away ….kaboom, hugh?
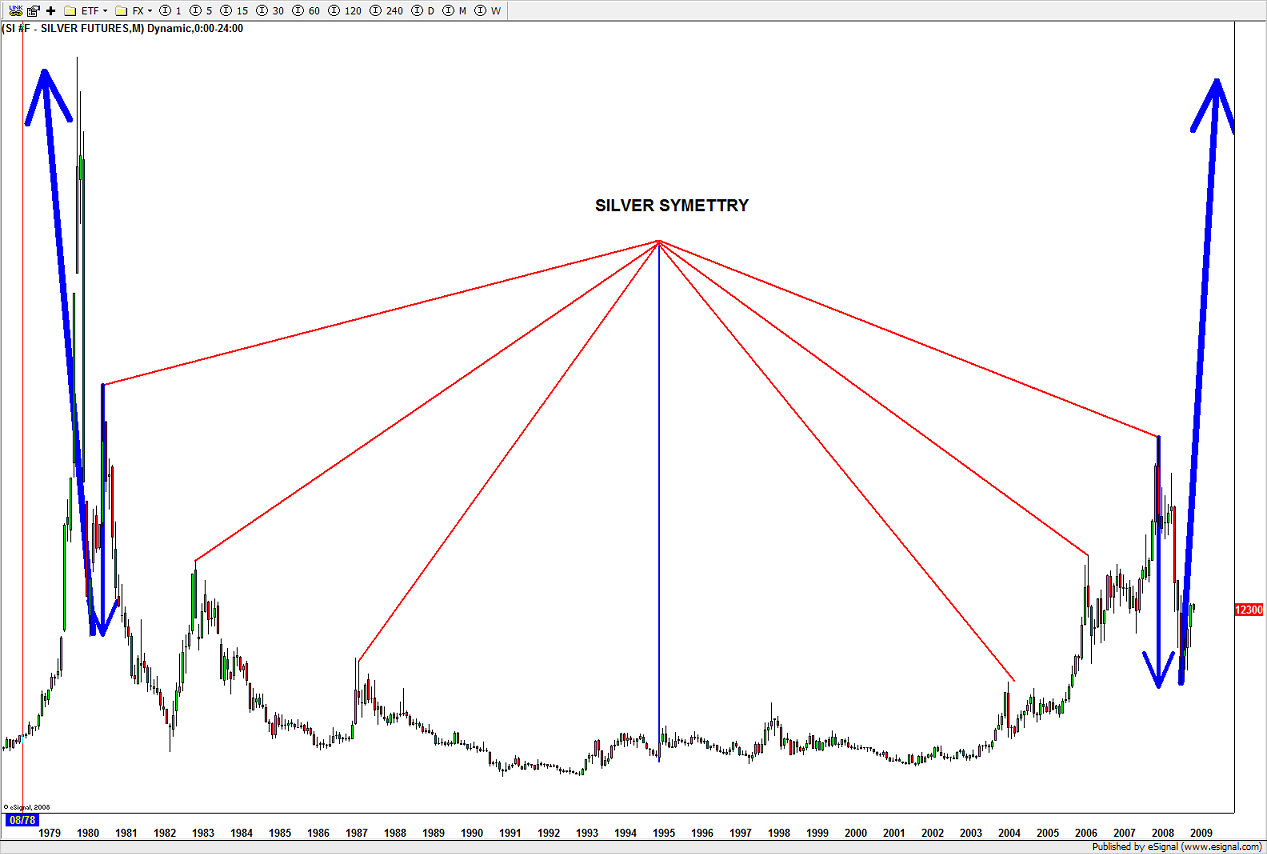
Chart shows it all …
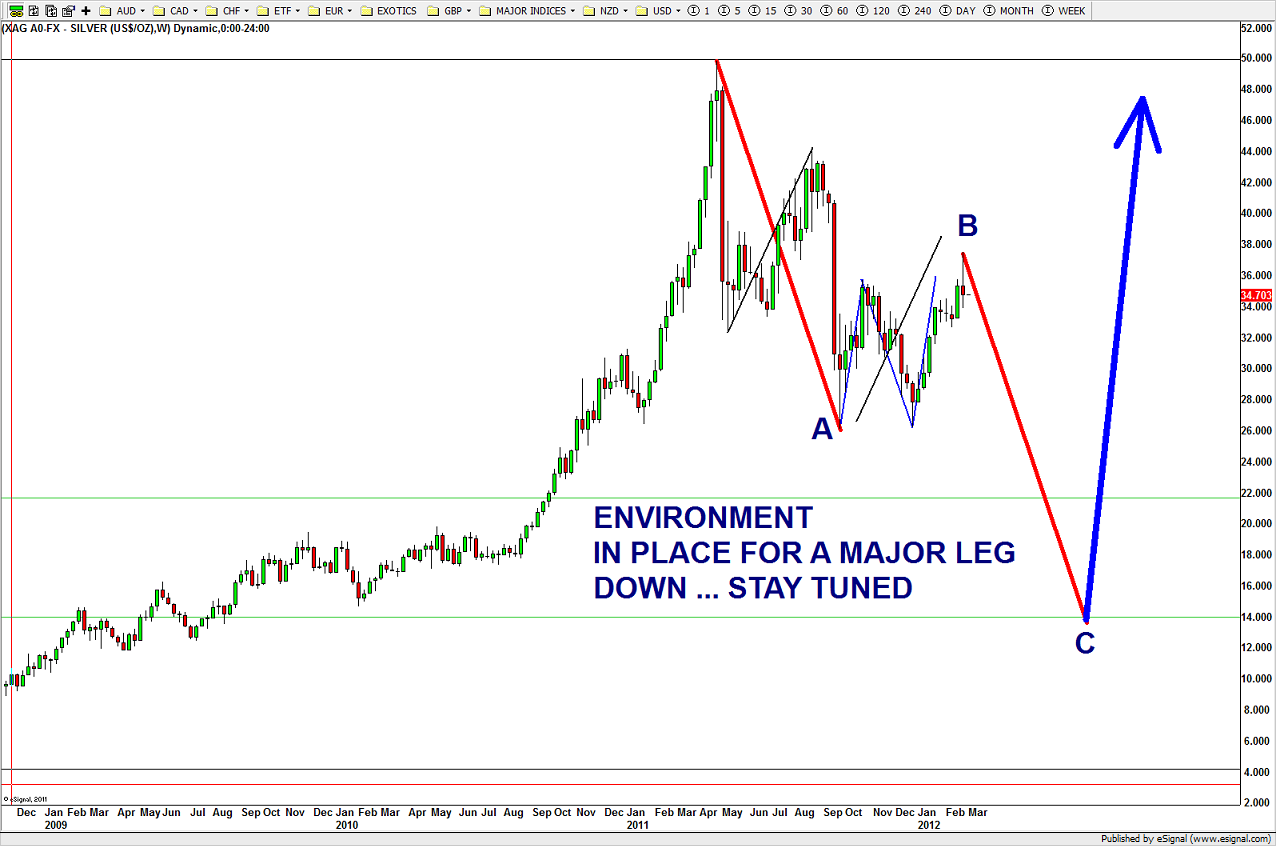
Chart above shows the POTENTIAL move coming …
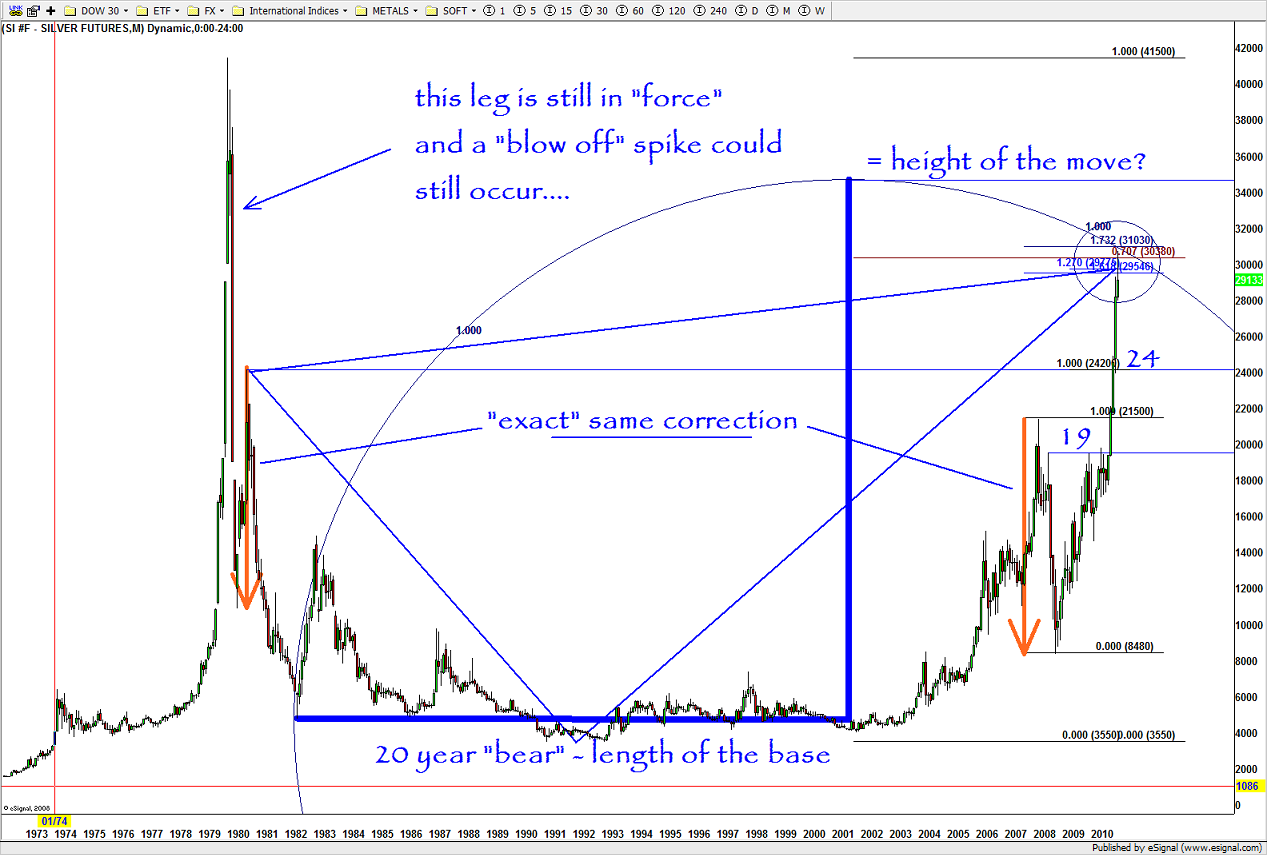
HEIGHT of the MOVE can equal the length of the base … as the move is in full affect, I was starting to shift my mindset to taking profits for clients. Bottom line is like the $AAPL chart (potentially $MA), parabolic and emotionally fueled rallies will be taken out, very powerfully. So, targets are being found and discussed. However, remember the left side of the chart “a “blow off” spike could occur” KABOOM …..
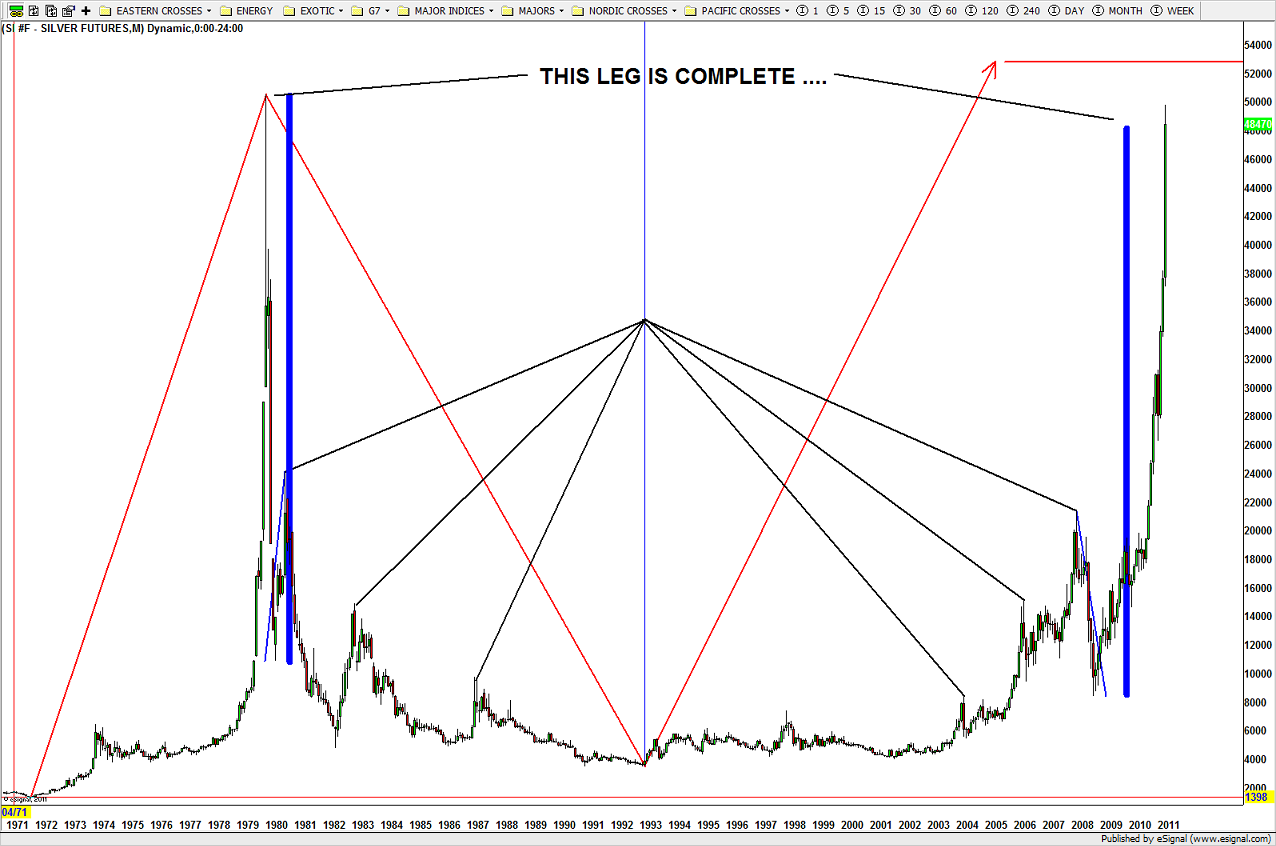
Silver had finished it’s very PRECISE and ORDERLY pattern … the red arrows in the lower image are showing one more potential target around 51, but overall, the run had completed. Note the top chart … 3.1412 was used a bunch, musical notes were used and PLEASE NOTE a top at a natural square 7*7. Interesting …hugh?
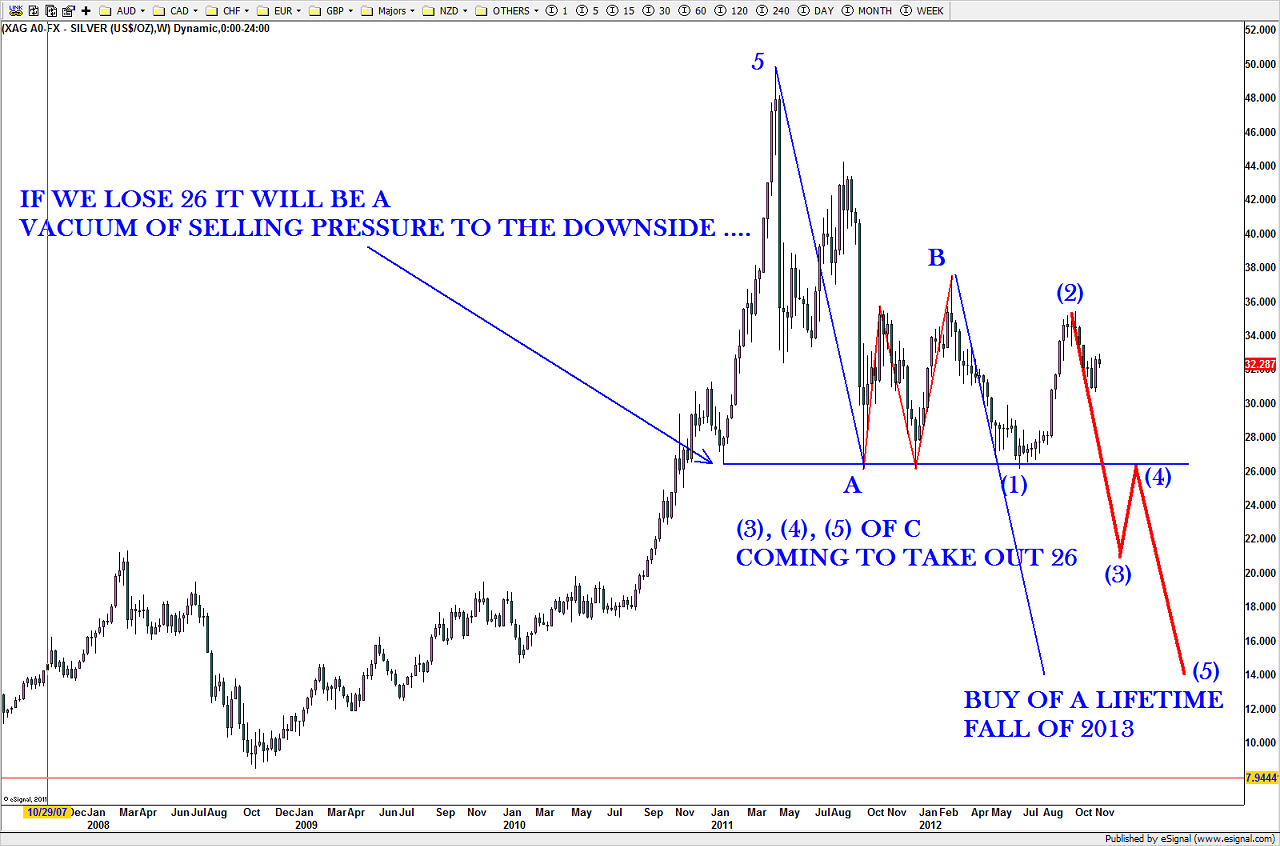
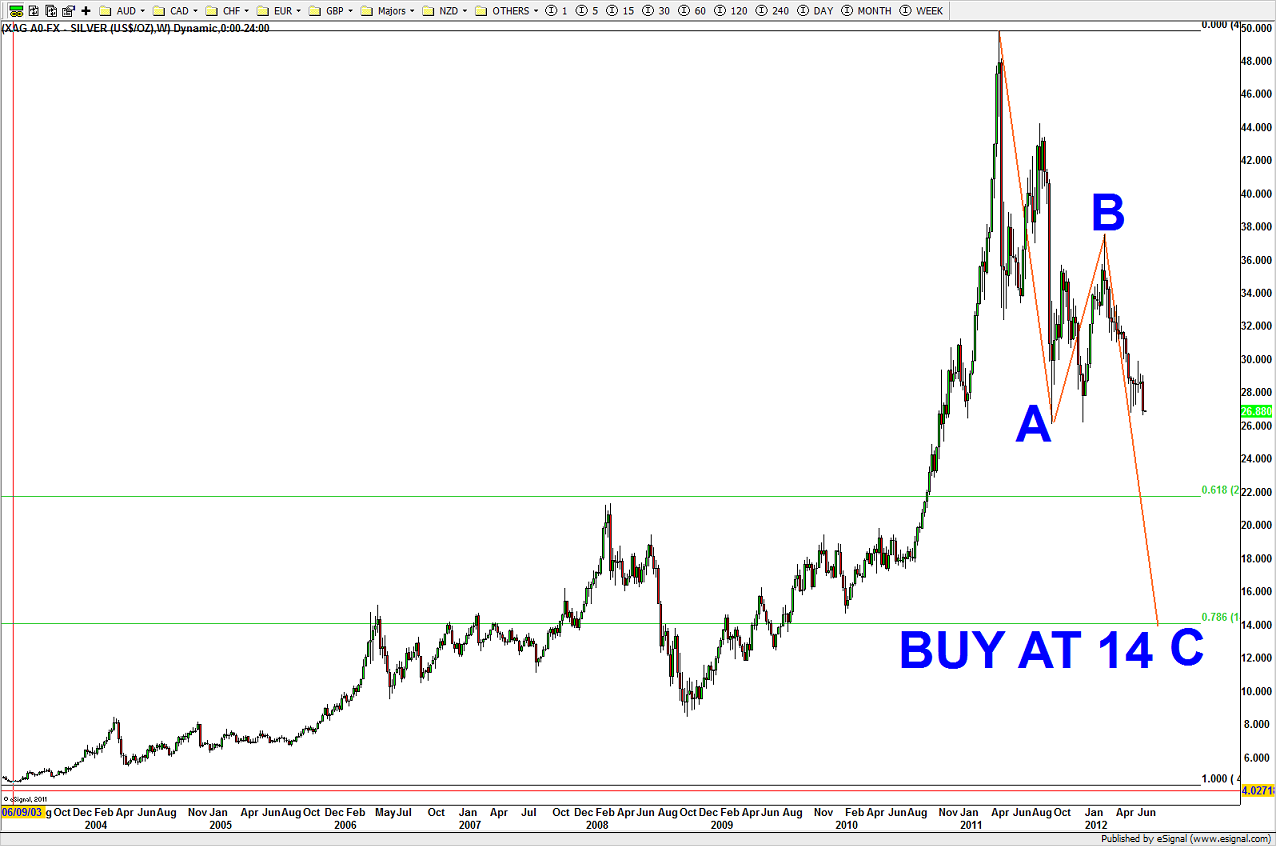
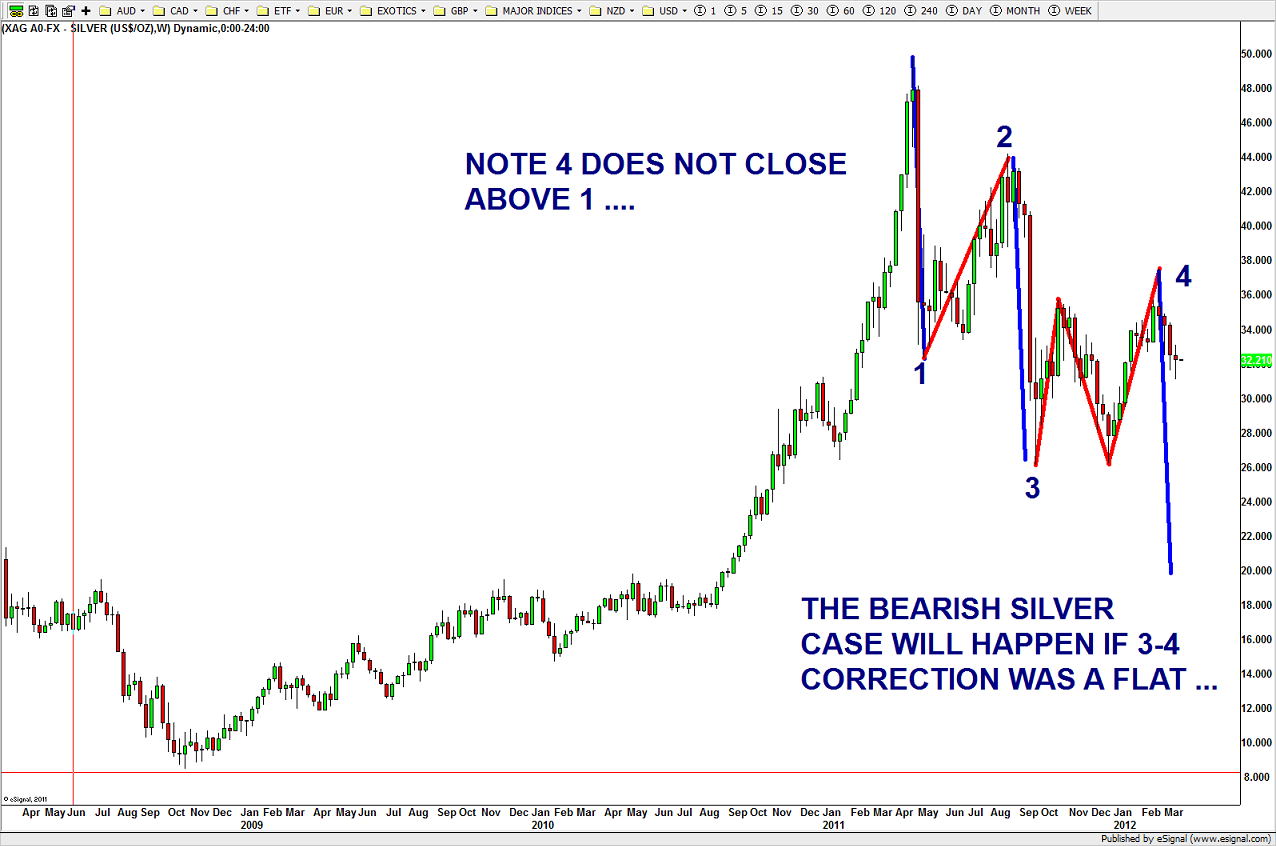
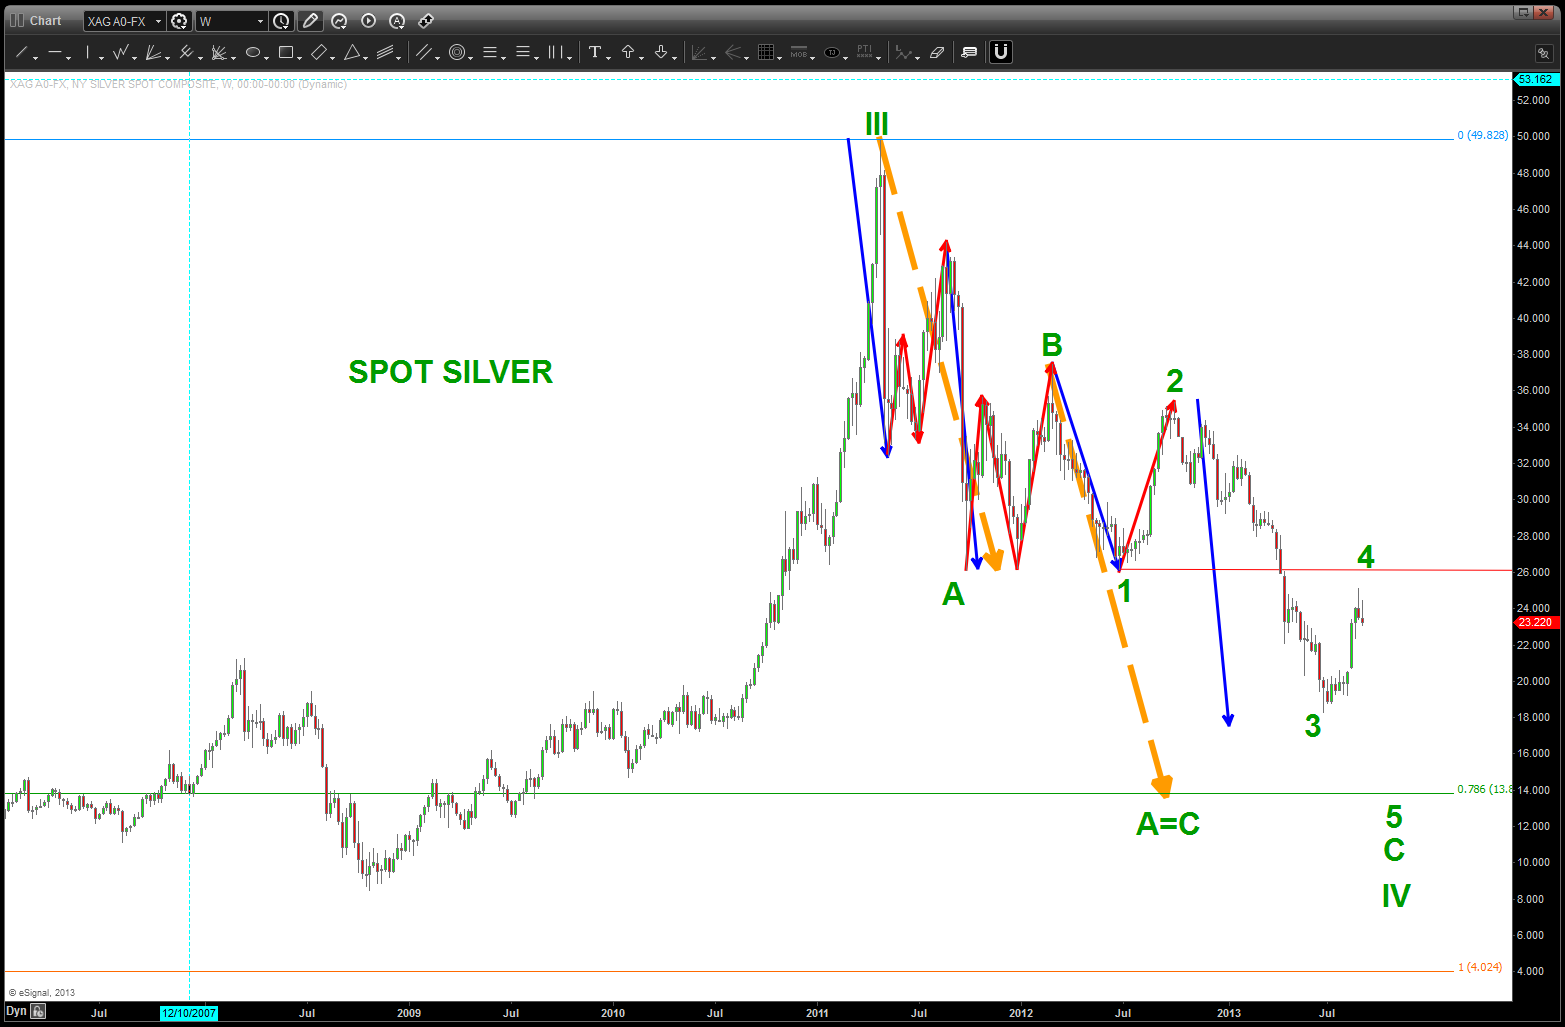
Yes, your seeing some Elliott Wave counts. On a longer term basis, the wave patterns appear pretty harmonious so I’m sticking w/ them. My issue is IF the top at 49 was a big wave 3 or wave 5. Right now, I’m favoring it was a wave 3 top and we are correcting A-B-C in 4 w/ a 5 and new high to come. Here’s that picture:
Let’s get it on … not bad drawing pictures hugh?
Rock on, always’
Bart

Can I borrow your GOLD crayon 🙂
HA! Not yet … still hasn’t broken down. man, we blow thru this level and it could be a rocketship! good to hear from you dude …
Pingback: silver following the script – part II | Bart's Charts
Pingback: Geometry – March 5, 2025 – Bart's Charts