Surf’s Up (or down) AMAZON ($AMZN)
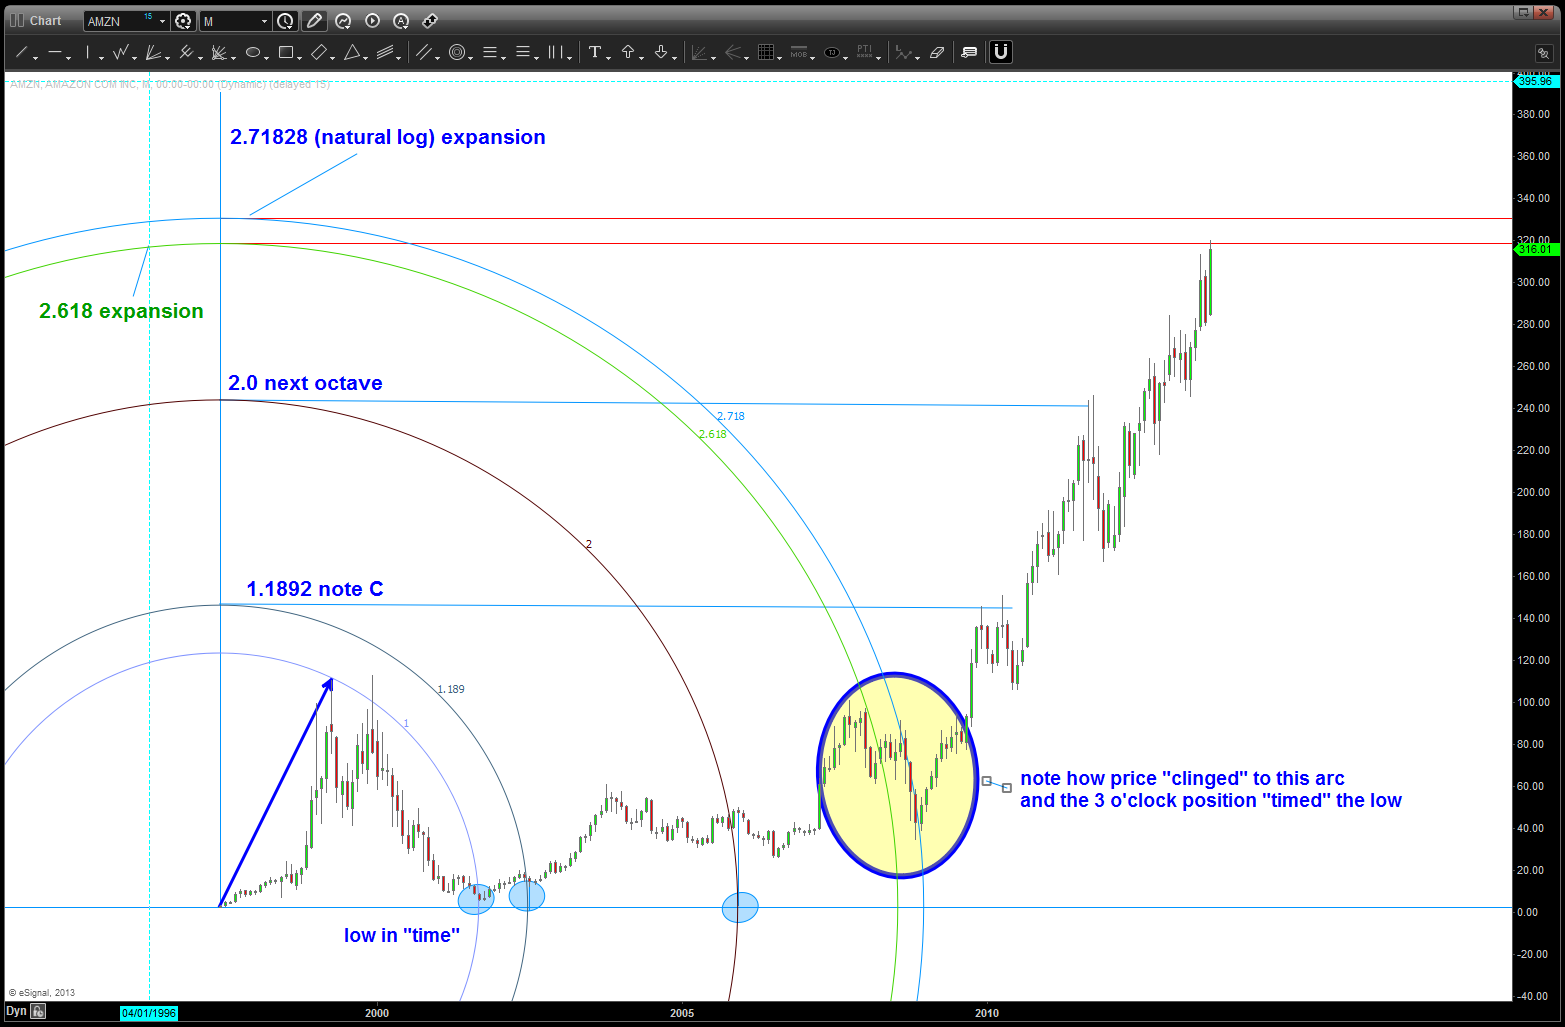
Here’s an update to the AMZN charts below …while I still feel this count is correct, we did make another high. Therefore, new targets calculated. I like to call the following chart, below, “musical polarity.” As you can see, the blue arrow to the left is the “rock hitting the water” and it causes the “waves.” In this case we try to align price and time to PROJECT areas of support and resistance. We use the past support/resistance and time components to project potential inflection points.
Note how the first arc down EXACTLY nails the low in TIME ….I then use the next points in price to project using 1.1892 (musical note C of equal octave scale) and 2.0 which is the “next octave. as you can see they were important points in TIME and PRICE. The 3 o’clock position on the arcs are timing components. All this tells us is that we have a “good arc” or “good splash of the rock.”
Now my eye is turned to the yellow highlighed area in/around 2007-2008. Note, by expanding the initial arc by 2.618 (fibonacci) and 2.71828 (natural log) we have arcs that EXACTLY gravitate price to them and the timing of the low is precise. Again, all that tells us is that we have a good arc. Now, we project all the way up to the top of the circle and now we have a target zone. one of the targets was hit Friday and we’ll see if the upper is hit around 329. We have NOT been given a signal reversal candle so the trend is still alive ….again, I like the count so I’m now “looking” for targets to adjust/confirm targets.
Still believe and looking for a TOP in AMZN to come ….
waves ….
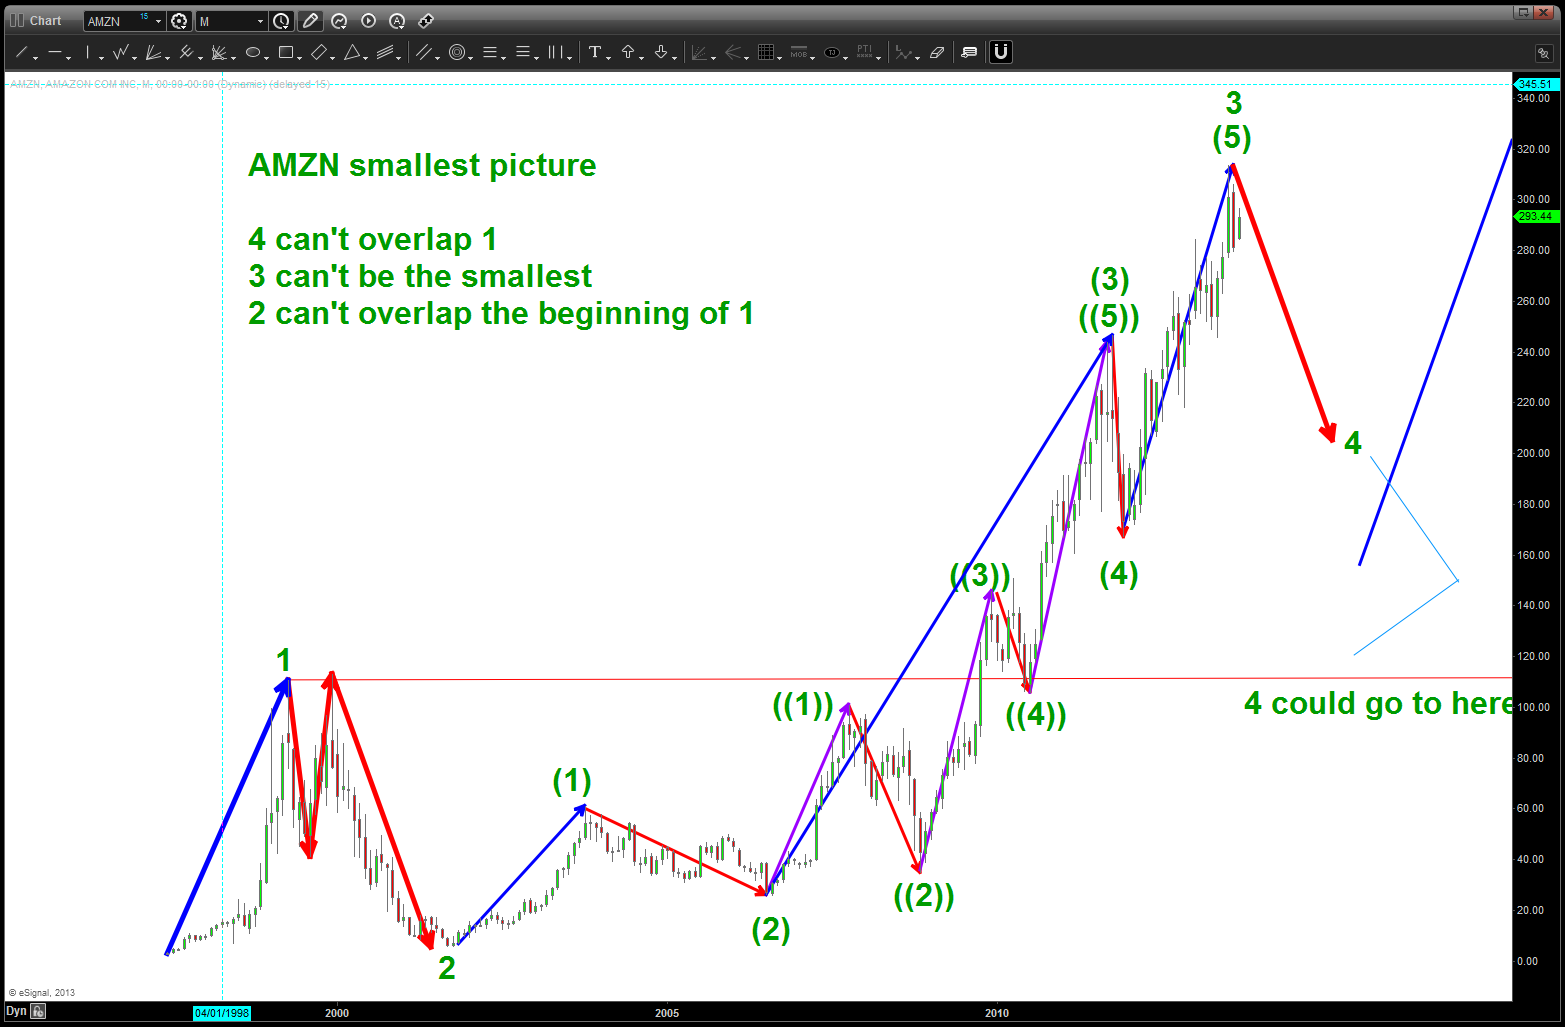
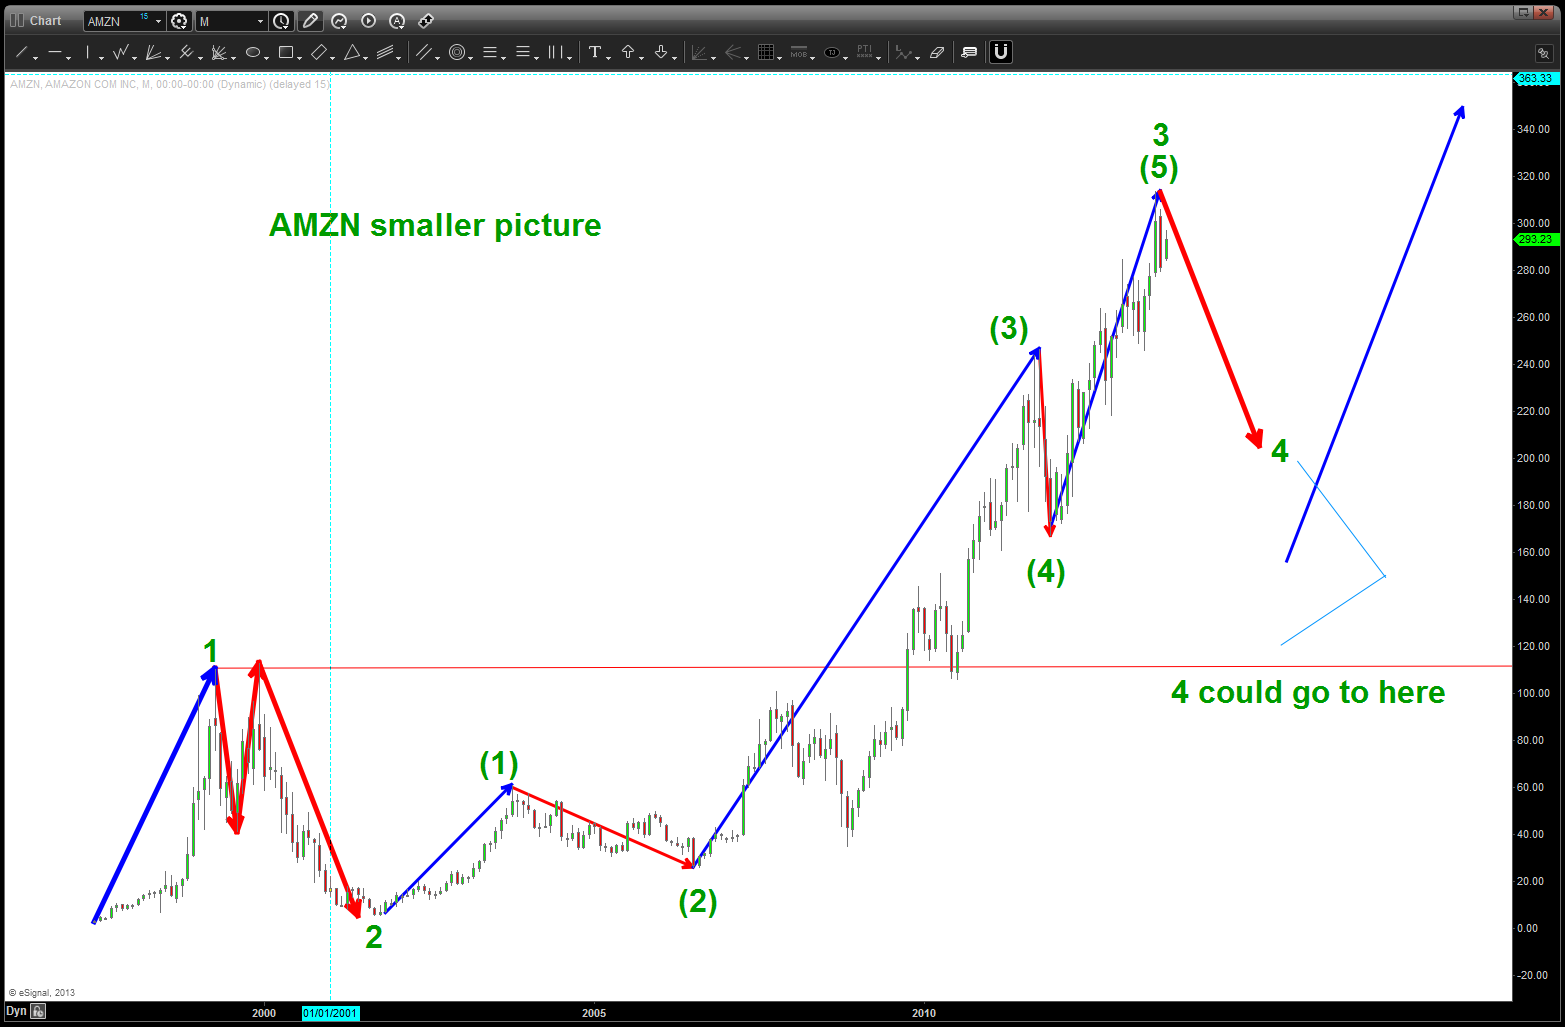
The waves in AMZN ($AMZN) have been extremely harmonic and, quite powerful to the upside. I’ve included a set of charts that are mean to show you the “subdivisions” that lead to, as my best, subjective, viewpoint can produce. Elliott Wave is hard and you either “see it” or you don’t. What most people do is count and use it as their only technical method. I never use it alone and, usually, only count when I have some very strong targets that have appeared ….
So, as you walk thru the charts, what I’m trying to do is work largest to smallest and break down what I see as a possible count …. remember three simple rules:
1. Wave 3 can never be the smallest / 2. Wave 2 cannot go below/above the beginning of Wave 1 / 3. Wave 4 can’t overlap end of wave 1. That’s pretty much it …
So … here ya go. Expect a top followed by a pretty big correction and then one more new high…? Stay tuned ….
Rock on, always’
B
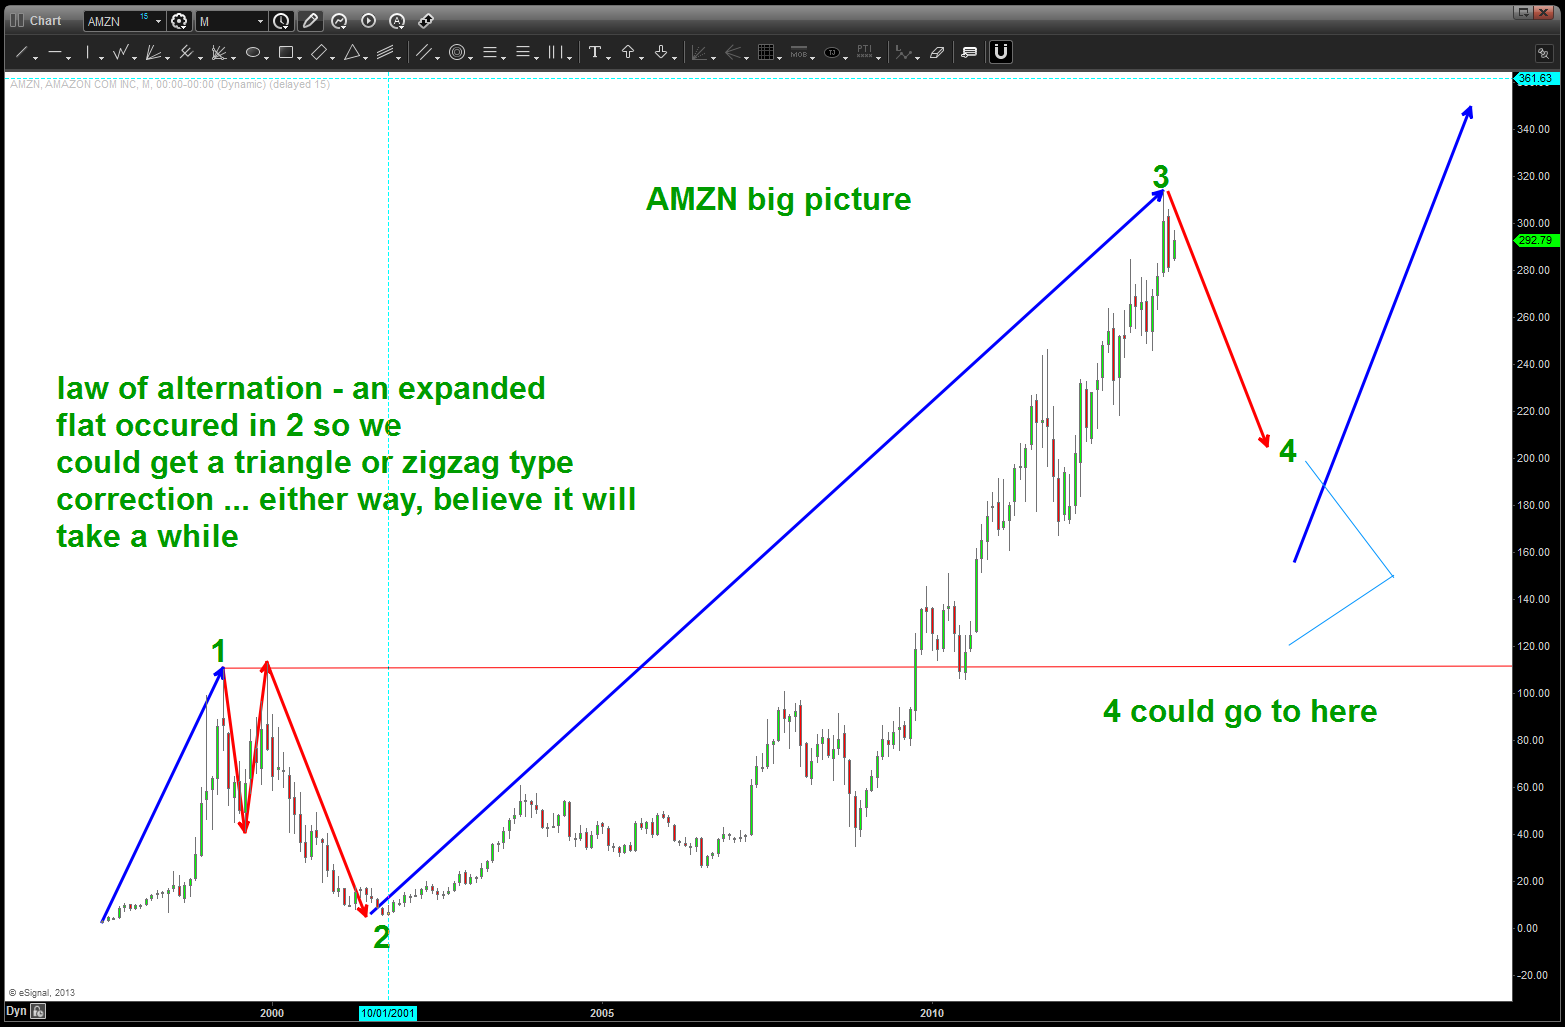
the Big Picture Count
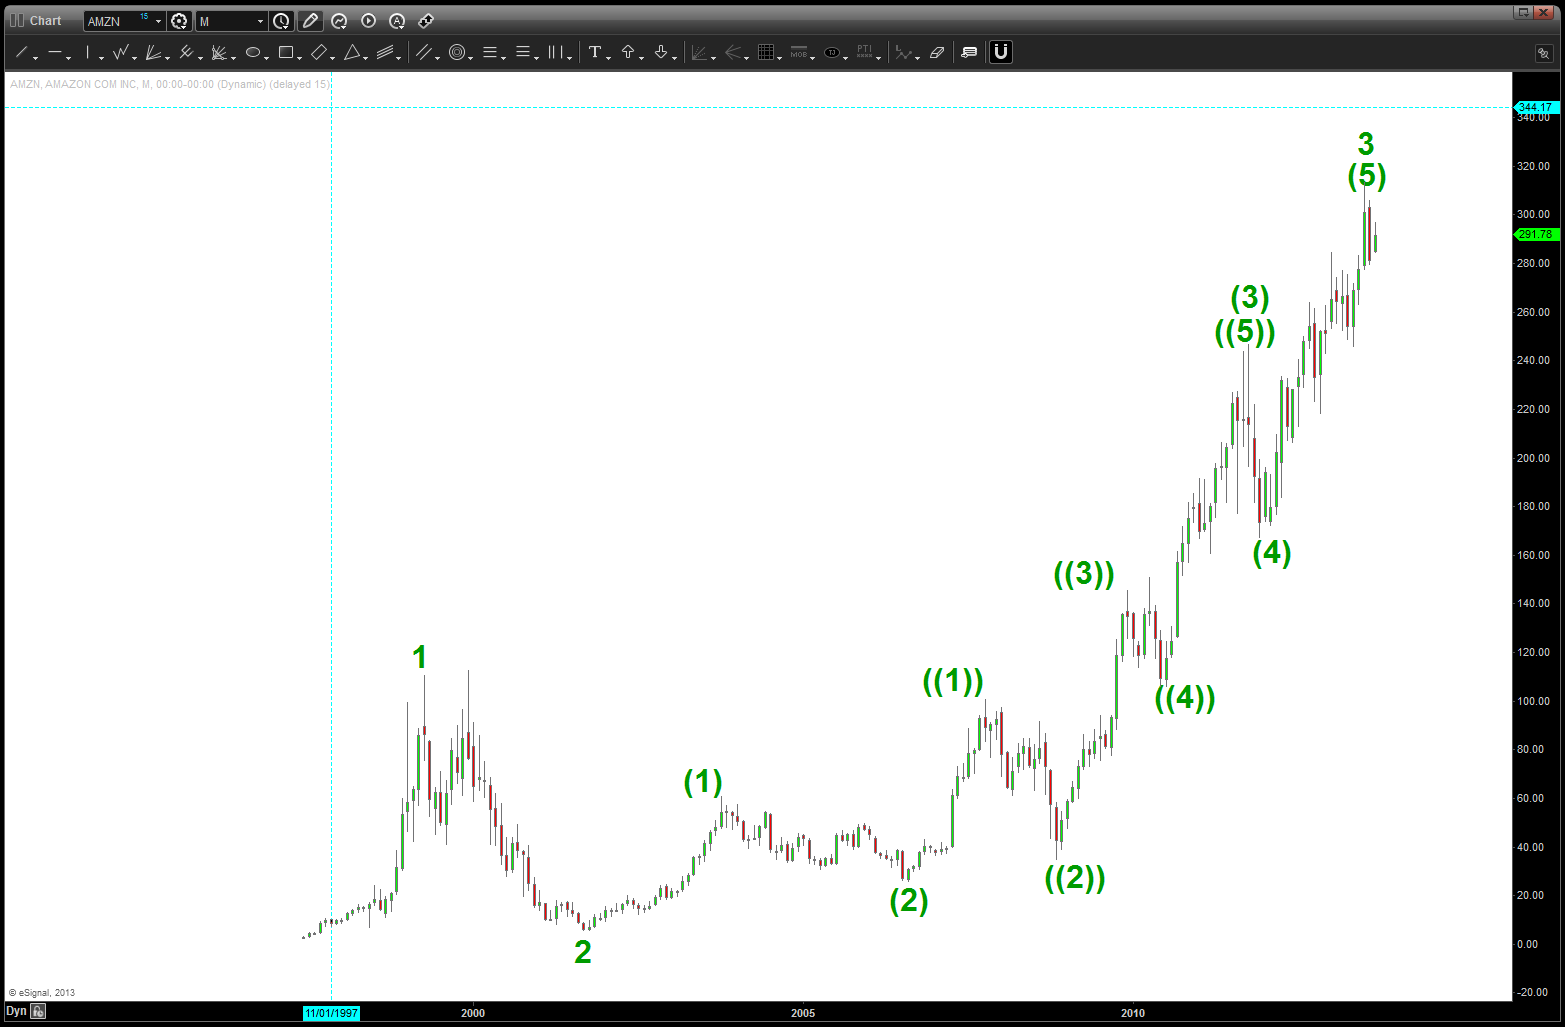
a small subdivision/fractal of the Big Picture

- the smallest subdivision of the Big Picture

- The count w/out the lines