USD Index – close to a BIG move UP?
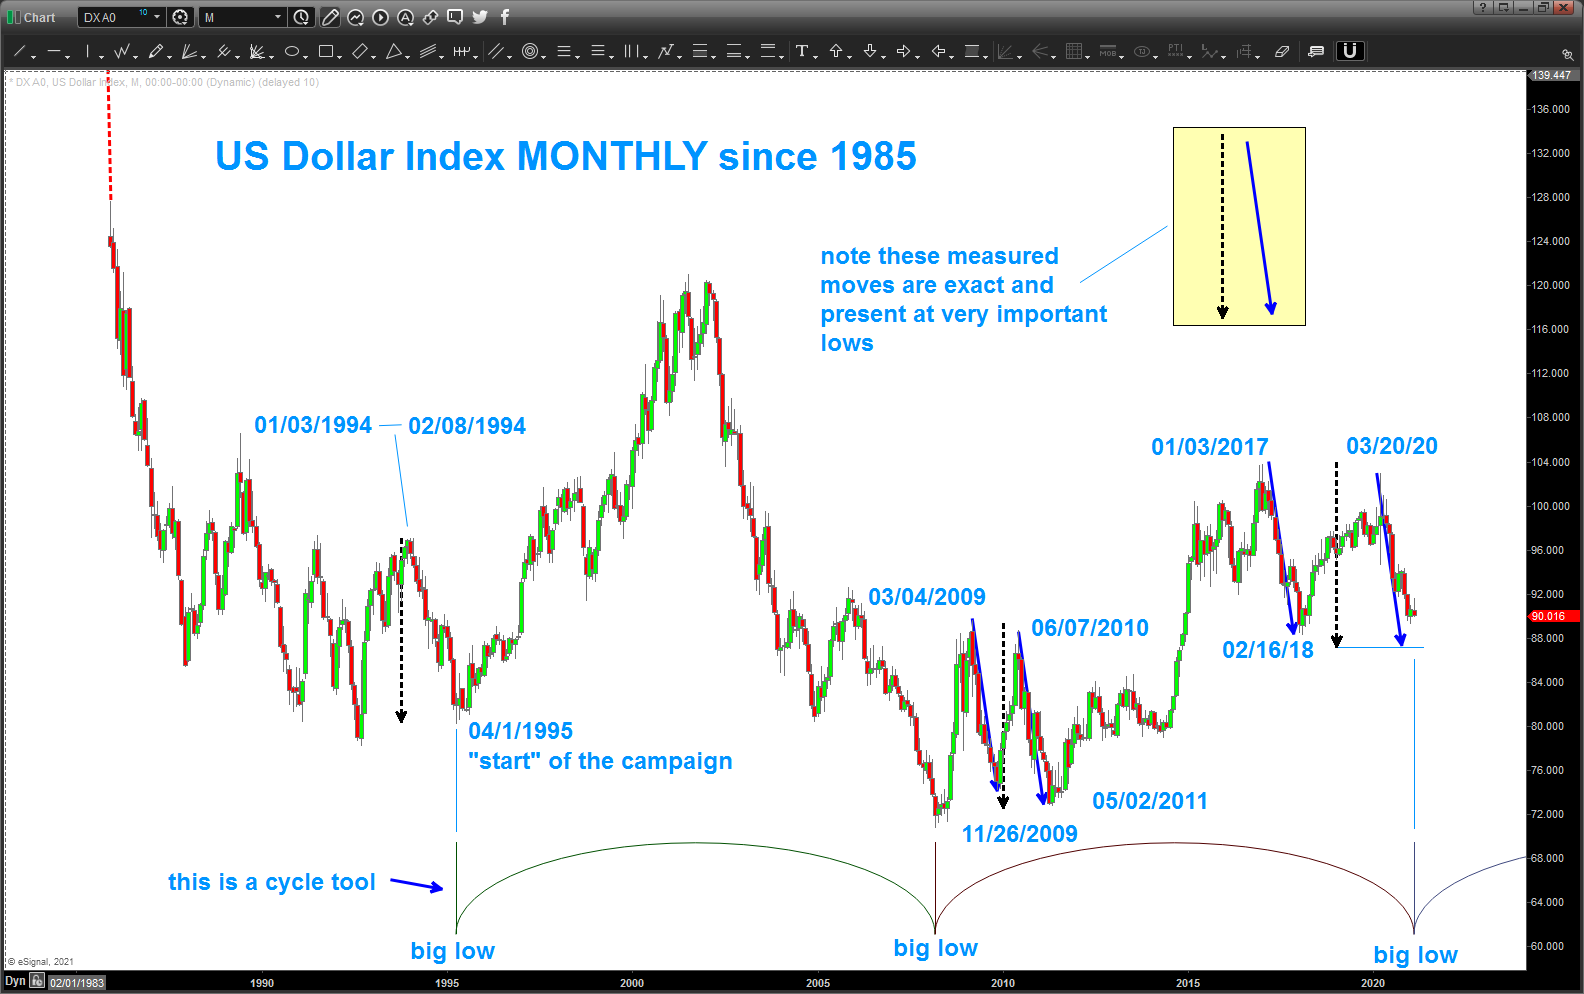
if you have been following my blog, you’ll remember the big measured moves that were around when the dollar was carving out THE low. they have appeared/are appearing again. w/ a wrinkle … using “basic” monthly cycle tools you can see that we have a BIG cycle coming in this month which lines up w/ the measured move target zone a little lower in the index. this could be a BIG DOLLAR MOVE higher ….
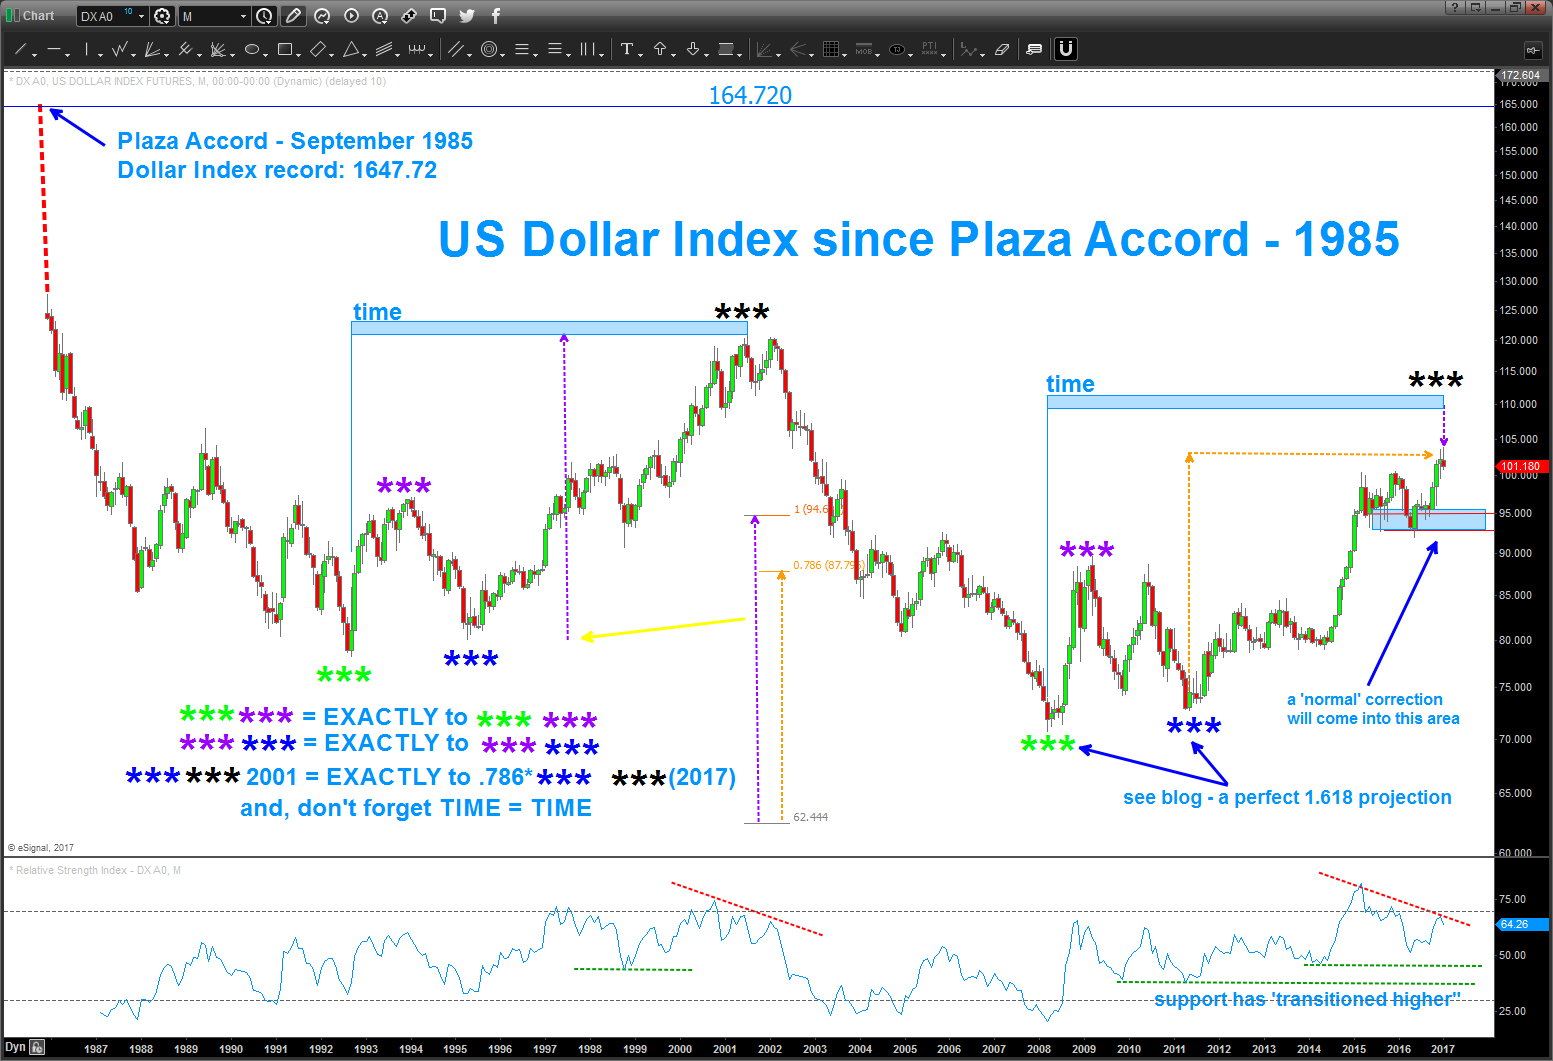
below you’ll find the chart that started the dollar bears growling and stopped the dollar bull in it’s track. the form, proportion and balance are amazing and exact. take time to study this chart
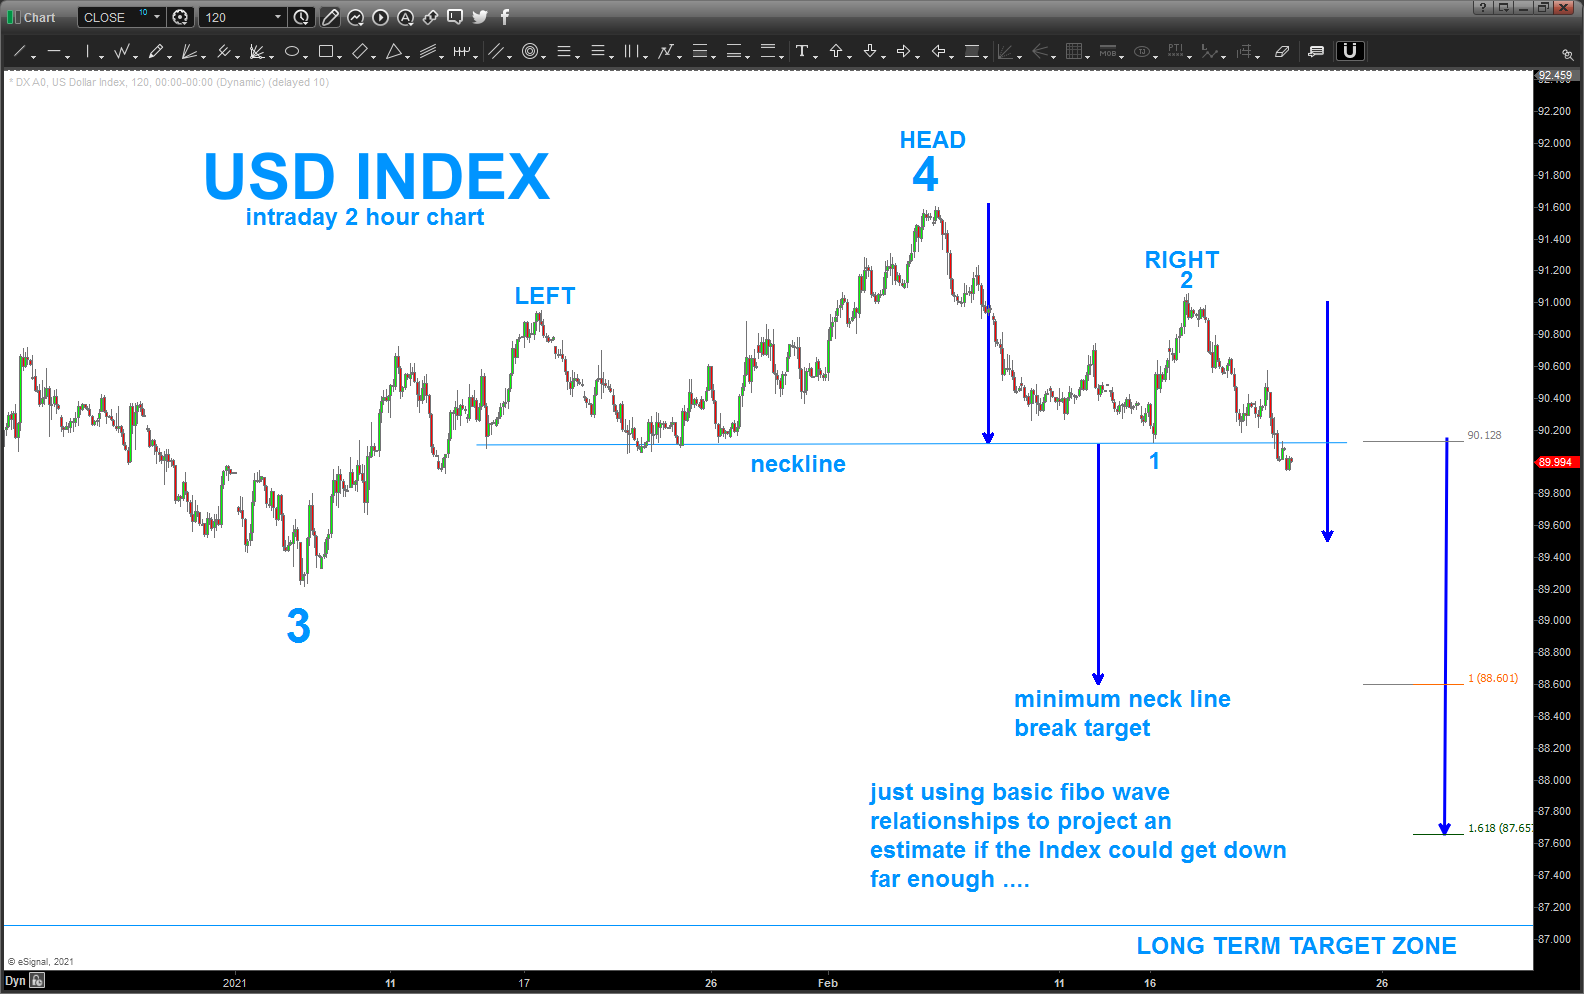
since then, the USD Index has basically been carving out what looks like a flat correction and then higher … you can read prior posts to see if this was an A-B-C correction or 1,2,3,4 (in work/finishing) and then higher in a big 5th wave. we are getting a little below the end of wave 1 which breaks a rule if your a purist but it sure looks like we are bottoming. then, the last chart is an intraday chart showing a possible mathematical derivation of wave length based on fibo relationships that could get us into the target zone … so, stand by, as this is a BIG level coming up on the USD.

Pingback: FX Currency update – Bart's Charts