S&P 500 – March 09, 2023
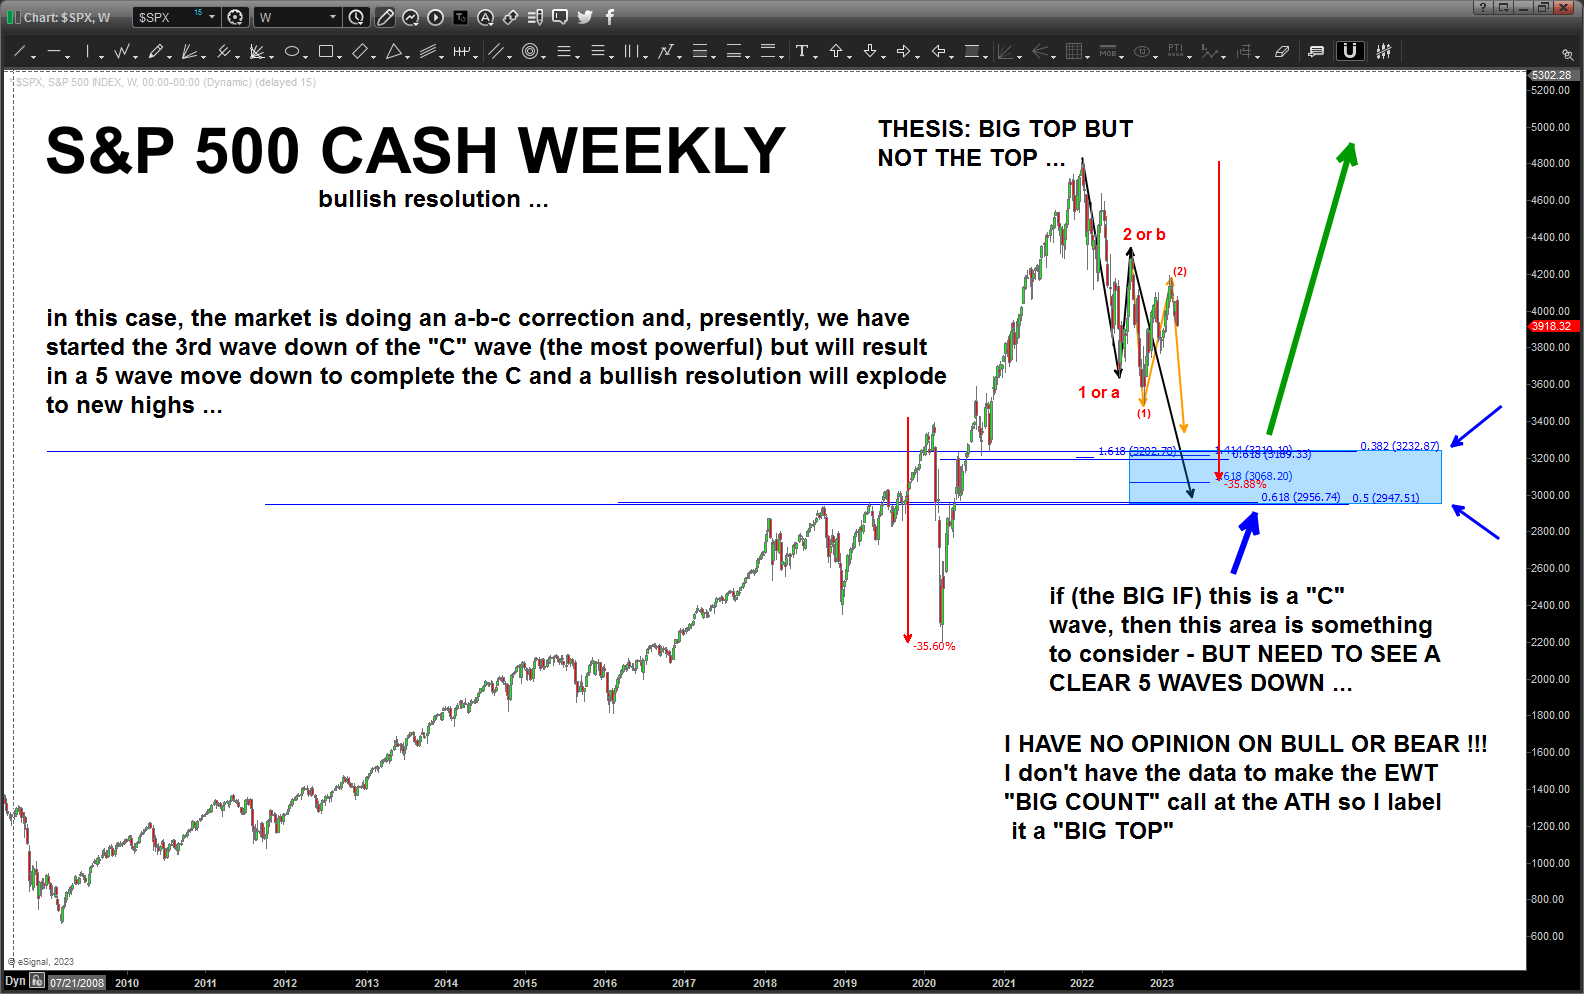
I try to make it clear on the chart below that I just “don’t have a clue” if the ATH on the S&P 500 is THE HIGH or A HIGH … I don’t have the data and, frankly, I’ve seen very amazing professionals say it is THE HIGH and also say A HIGH. Both, totally possible. NOBODY KNOWS except the Architect !!!
With that backdrop, you can see that this chart is a “bullish conclusion” of this correction and support shall be found and off we go.
I would hold my powder dry to go long … remember, in this case we have a 3rd wave of the C wave starting and that’s UGLY so we’ll have plenty of time to get long and, as you can see, using our measured moves you can see we have a nice thumping coming lower.
So, there we have 3232ish level w/ 4 ratio’s and a little higher a 3 drives to a bottom (orange arrows) and the percentage decline from 2020. the 2950 ish is our ABCD (black arrows) and a nice overlap of .618 and .5 from the 2009 low.
One of those two should hold … and then, guess we’ll just have to wait and see. I’m not really looking forward to that …
One of these amazing professionals will be proven correct and they both have the guts to make “the call” … my call will be 1/ trying to get short into the zone shown (I’ve been stopped out twice trying to short this market but my analysis has been spot on … yup.) and then 2/ stepping up to BUY to test the “trend is your friend till it ends” thesis.
If our levels work, then were long for a multi year run into new highs.
If they get blown thru and fail either like a hot knife thru butter or provide some support but then, after a week or so, are taken out THEN things are really in the “other” category of the good/other grade category.

The weak banking sector is a great signal to me that more of the same to follow.
“NOBODY KNOWS except the Architect !!!”
I love that comment!
Hey, Richard, thanks for reading it and commenting .. not sure how many do! 🙂