JNK Geometry – June 27, 2023
Spent some time on JNK today/tonight and tried some square outs in both calendar days and planets and blah blah blah. Even pulled out the Pythagorean ABC^2. To no avail .. then, I thought I’m “curve fitting it” so I just started to do some geometry.
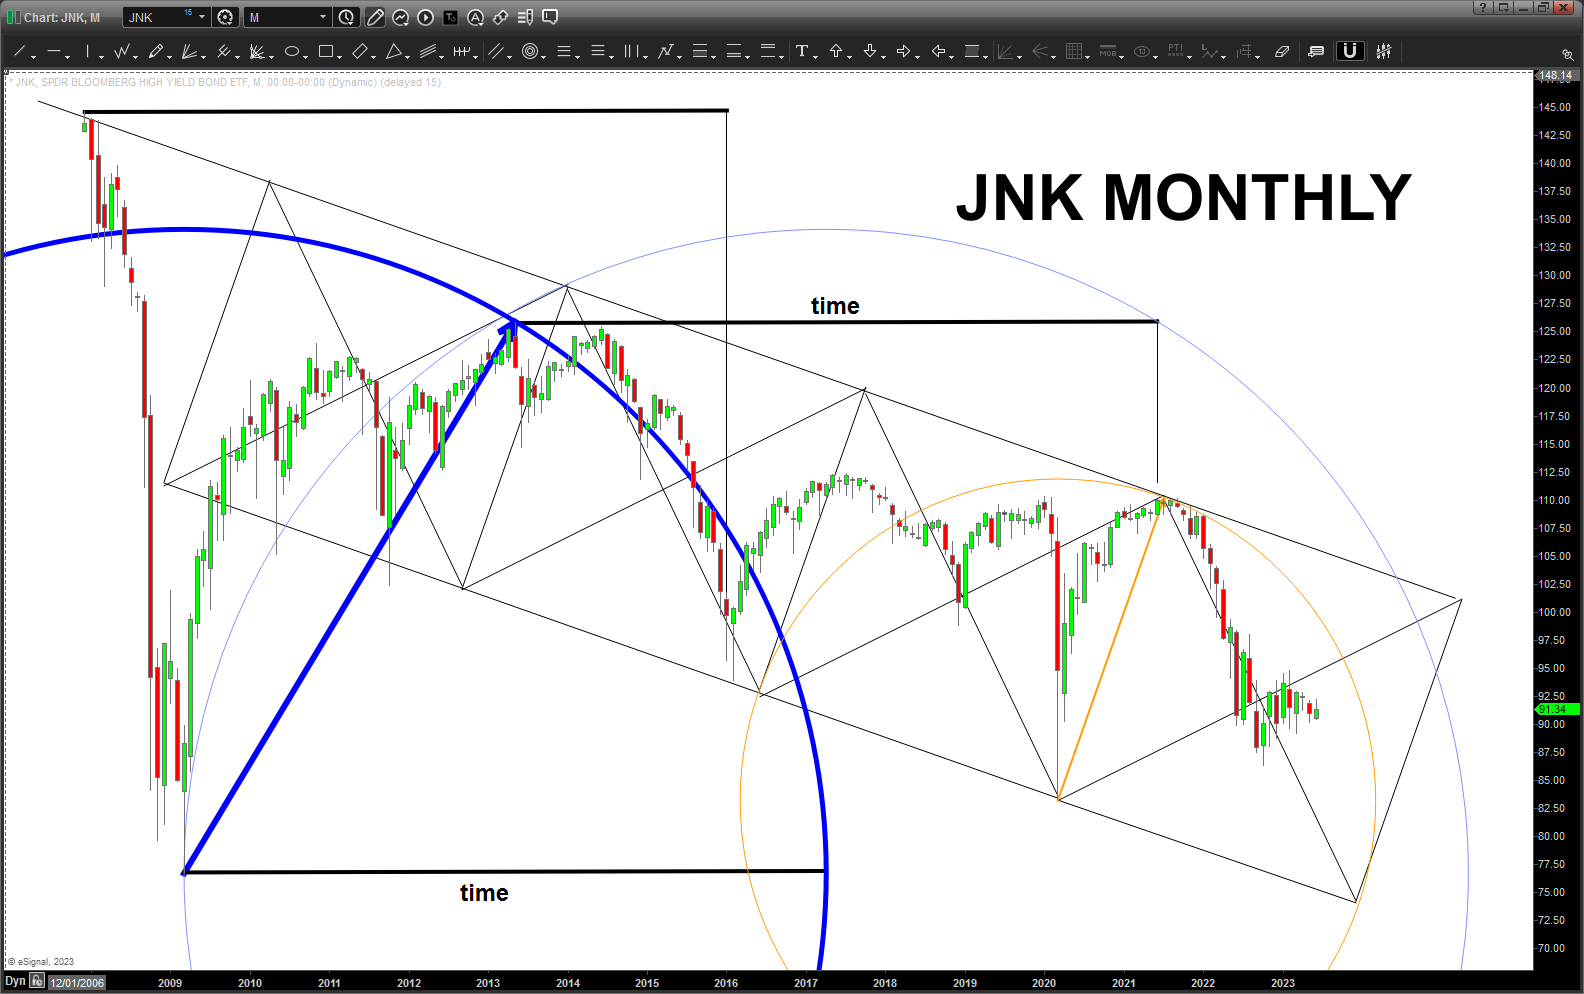
I’ve been sketching before I meditate based on Robert Edward Grants recommendation .. it’s pretty trippy. As you square the circle and then step back and throw some flower of life on top and then, what the heck, throw Metatrons Cube into the mix and … well … you start to see creation in an amazingly beautiful way. The perfect – form, balance and proportion.
So, using the dark blue arrow and the orange arrow near the bottom – that’s it – we were able to create a time cycle … that was from the Vesica Pisces. Then, we were able to create the “past trend channel.” I didn’t work from left to right .. I went from the Orange Radius, the Orange Circle and then created the first triangle that is too the far right. And, that’s when the trend lines/boxes were created working back up right to left. And, I’ll be darn … it WAS THE TREND CHANNEL and just follow the market in the trendlines that were created from simple squares … amazing.
Why is this important?
As I’ve blogged before – we can make a comparison to JNK BONDS GOING UP UP UP to “risk on” and JNK BONDS GOING DOWN TO “risk off” and the risk is minimized by the institutions. I monitor them … they are very important.
So, here’s the daily (artistry removed 🙂 )
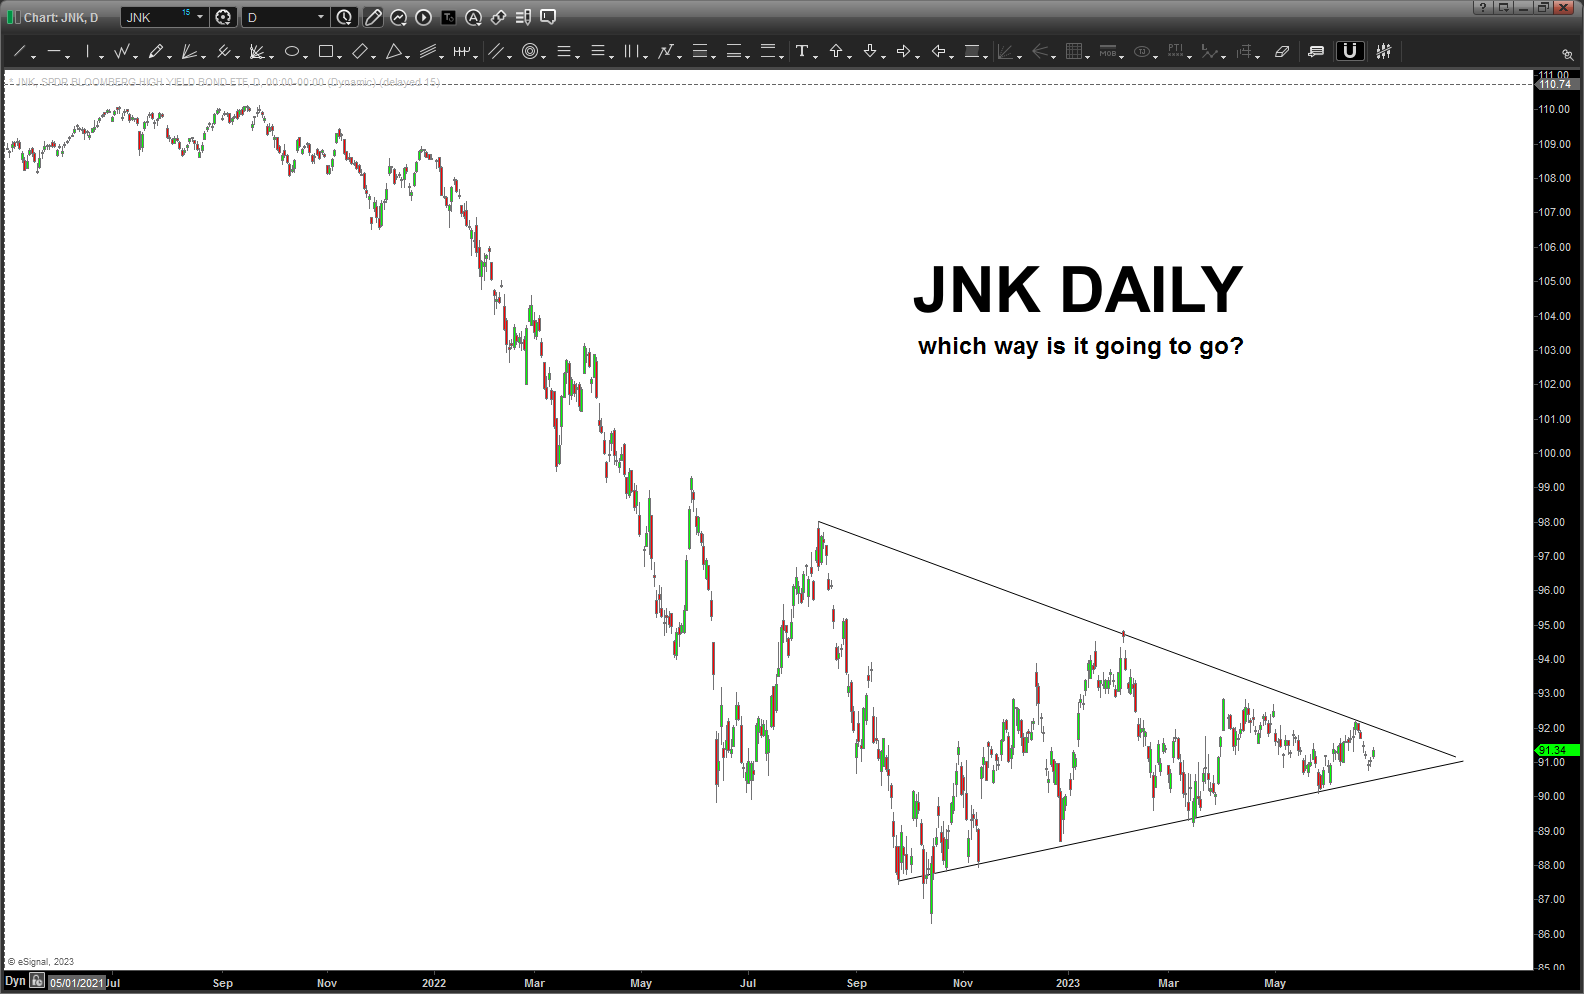
it’s showing a pretty important set of trend lines …for sure. but, as I state on the chart, which way is it going to blow?
now, interestingly, take a peak of JNK w/ the S&P 500 overlaid on top of it:
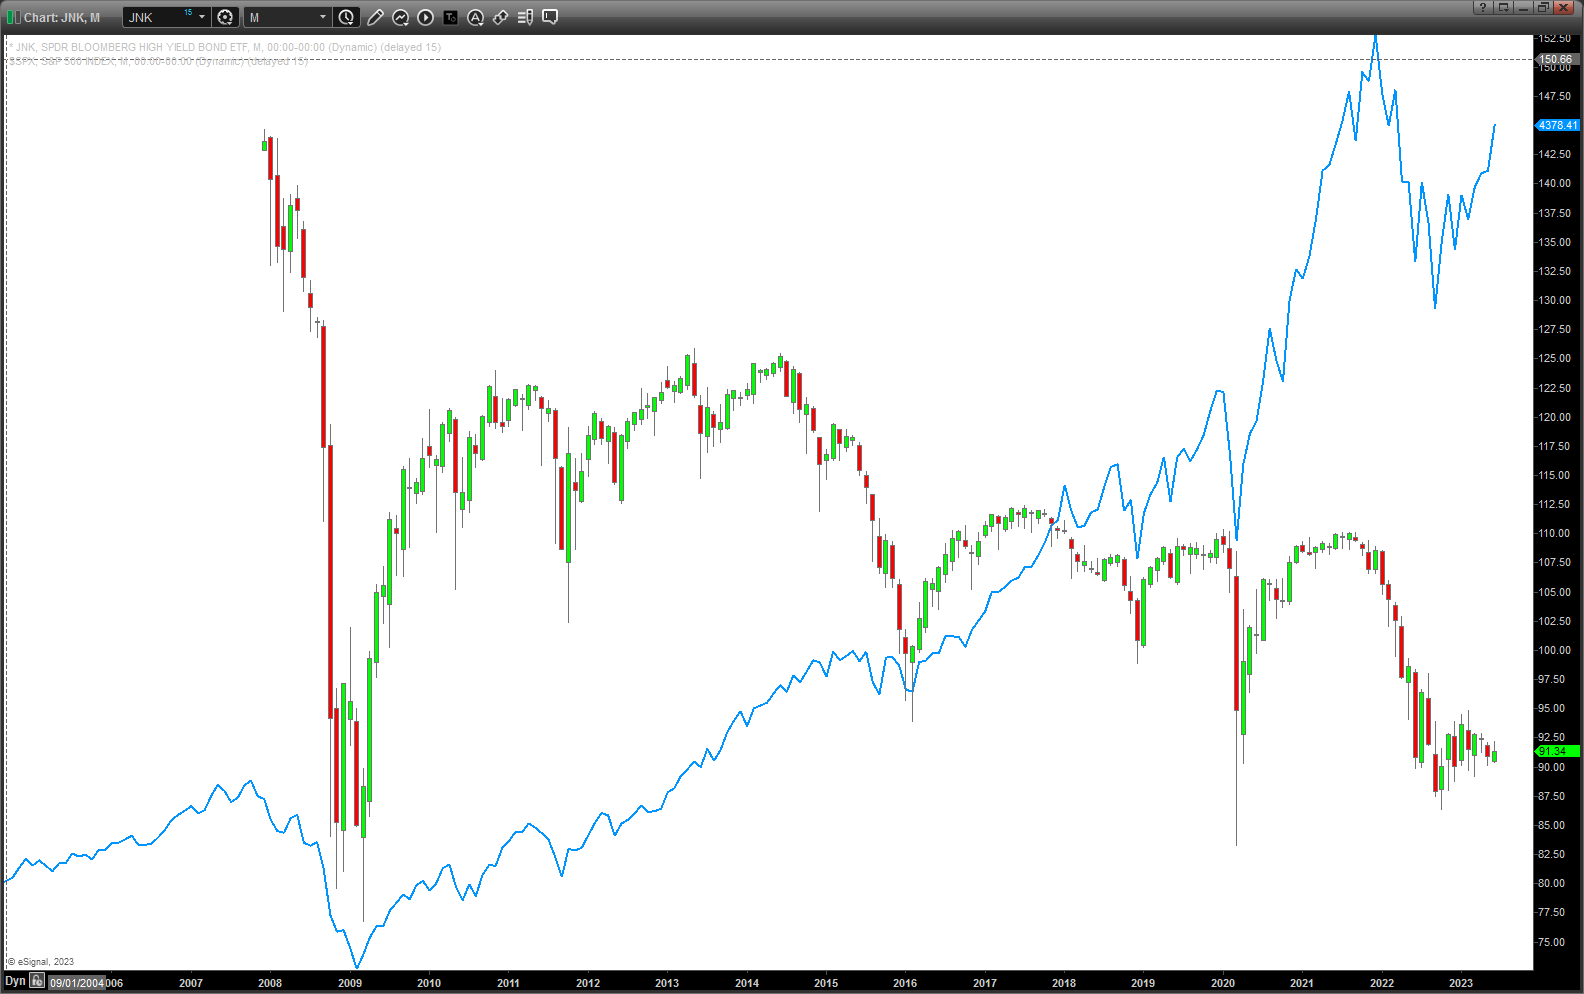
not immediately obvious .. but if you look at times when junk bonds were topping you would see some resistance or bumps and the market could continue higher, the junk bonds would kind of stall and shuck and jive BUT when they sold off, the market was soon thereafter.
So … what I don’t like is that the JNK bonds have not rallied like the others times and, in fact, “most” of the time, when they rallied there was a big monthly “spike” or “wick” from a candlestick perspective. Seriously, I think this is an important point. If we take at look at the first low on the chart to the far left you will see multiple monthly candles leaving a wick/spike before pretty strong rallies .. now just work left to right as we see the monthly wicks that resulted in a rally for the Junk Bonds .. allowing the market to relentlessly drive higher. But, this time … just saying .. where is the wick? where is the rally? if we take a look at how ALL the rallies started you will see the wick present and the subsequent rally. Not this time.
Certainly looks like JNK BONDS should get going pretty quickly to keep the party rolling. Else, we break that daily neckline I think it’s going to hard pressed to be long equities.
So, just keep watching that daily trendline convergence on JNK bond if you want an “outside the squawk box” objective look at the health of the market.
PS – Technical Analysis 101. This chart has lower highs and until this last “bounce” it had lower lows since 2010.
PUNCH LINE: does the S&P 500 have enough gas in its tank to explode higher and bring it’s pal, the JNK BONDS, with em’? Or, do they both look like it’s been a great run and they are just going to roll over and go blehhhhhh ….
I think we’ll know, pretty soon.
THEN RIDE THE WAVE!!!!!

Pingback: JNK – August 16, 2023 – Bart's Charts