Natural Gas and UNG
if you search for Natural Gas on the blog, you’ll see for almost 3 years – yes 3 years, I’ve been flirting w/ a low (big low) on Nat Gas and looking for the pop … back in 2017 we ID’d a pop but it quickly got run over. Wrong …and, since then, I’ve really just dropped it off my radar.
two of my really good virtual (unfortunately) friends from the Academy, Rugby, flying and blah blah and me trade texts back and forth. they act all smart like they are finance guys about the news and the P&E (did I spell that right) and fundamentals .. I just look at PATTERNS.
they asked about Nat Gas. “Great,” I thought “I can go back and visit my old nemesis. and, I would be an idiot to forget what now President Biden said about energy, right? One would think it would be falling out of the sky. EXACT opposite.
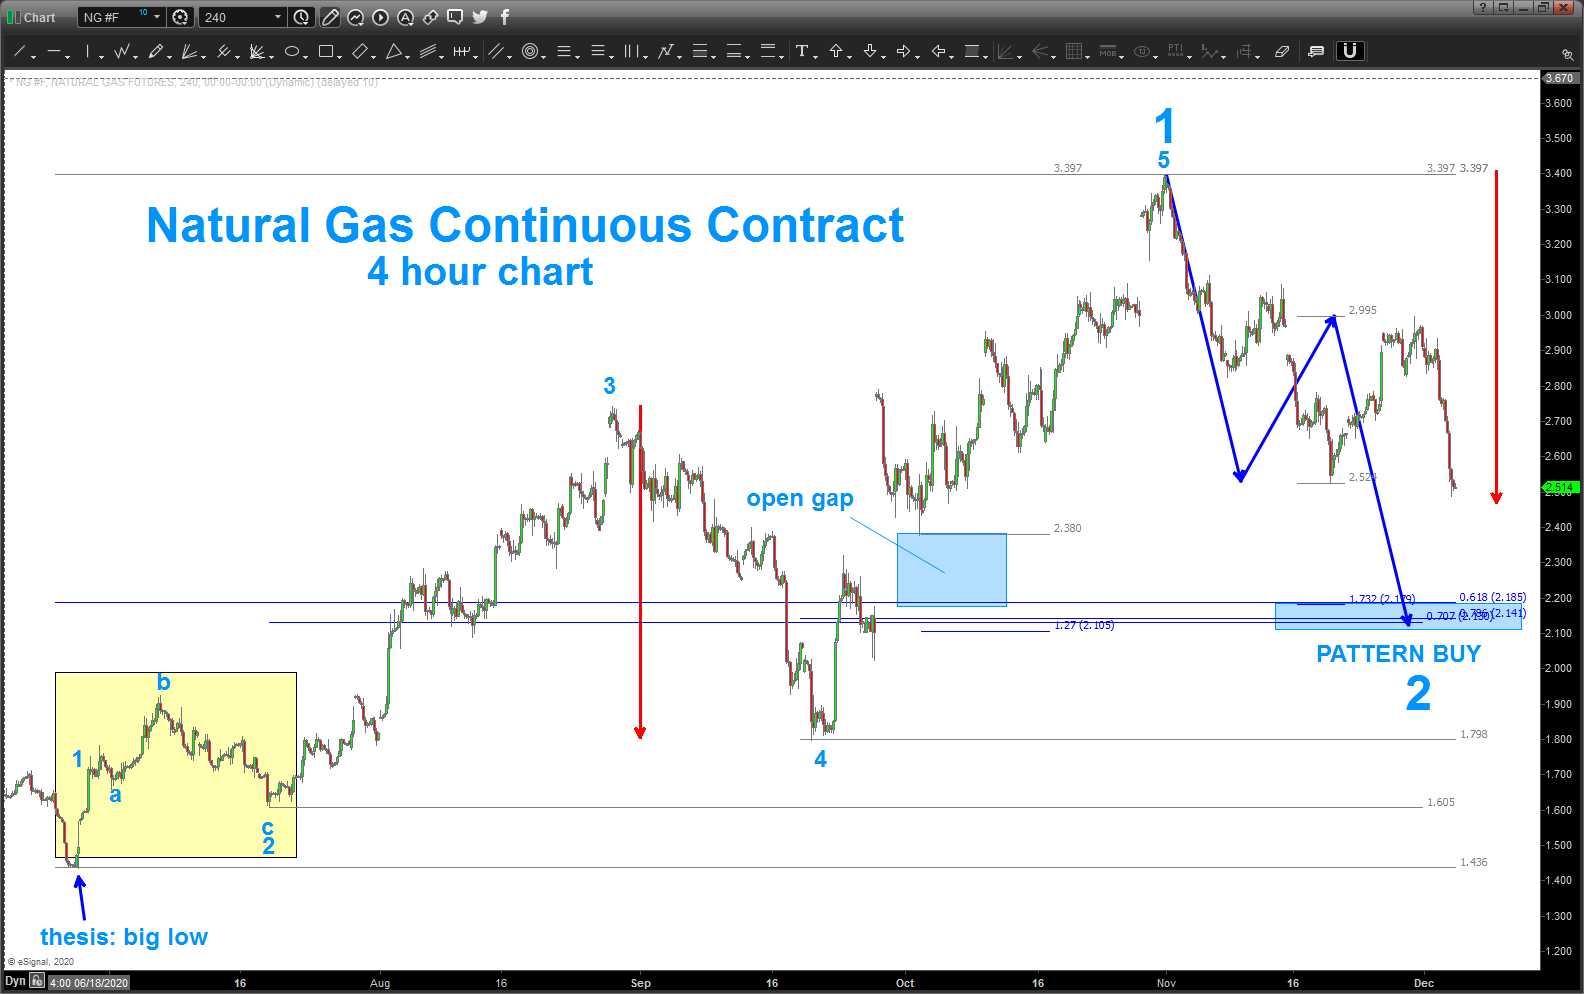
I believe it made a VERY big low in July, it just finished a 5 wave move up from an “ending diagonal” and we have 5 ratio’s (retracements, extensions, measured moves, projections) all coming in at 2.2.
I do want you take note of the yellow area at the left of the screen .. on a daily, this area looks like an expanded flat. however, when you drill down to a lower time frame (here a 4 hour) it sure looks like I’m curve fitting – which I might be, just being honest. I’m putting a bias into the fact that I’m right on the thesis: BIG LOW. that changes things somewhat because wave 4 CANNOT go below the end of wave 1 (or above if going down). sometimes you can dirty your purist mindset and maybe go w/ a CLOSE below 1 and if there is a daily wick or two right around the end of 1 you can curve fit and the count continues. folks, in this case 4 was below for almost 10 days … that’s a broken rule and an invalid count. see how fun Elliott Wave can be …?
one last, if you look at where the “PATTERN BUY” level is at that 2.1-2.2 zone one will see that the PATTERN completely closes the gap left on the 4 hour chart … nice.
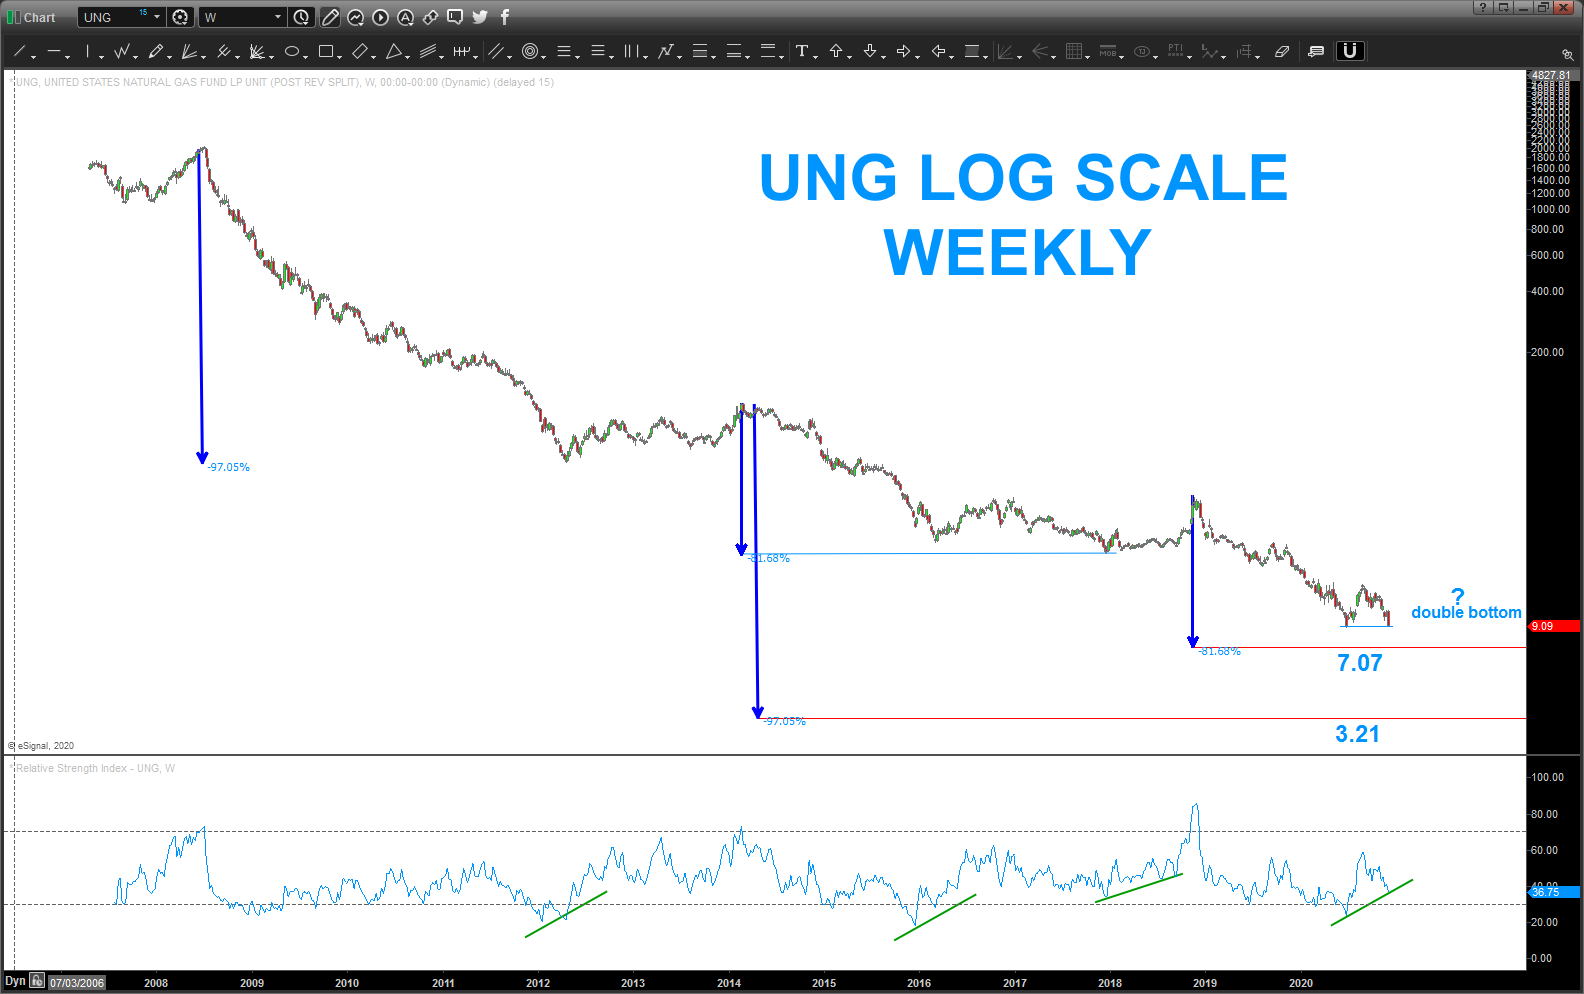
If you look at UNG, it hasn’t budged so if your going to play the ETF/Fund side of the house, I would recommend that you wait to BUY until Nat Gas hits 2.2 on the continuous futures contract.

Pingback: UNG / Nat Gas update – Bart's Charts