THE silver fractal … you want to study this chart
Fractals … see below for the definition.
In the market, it happens all the time. The same PATTERN in FORM is playing itself out – from a fractal perspective – on a 5 minute chart and on a Monthly. It’s actually pretty amazing to see … trust me, you won’t see them w/ the mess of technical indicators that clobber technicians screens. Clear your chart and sit back and say “show me” 🙂
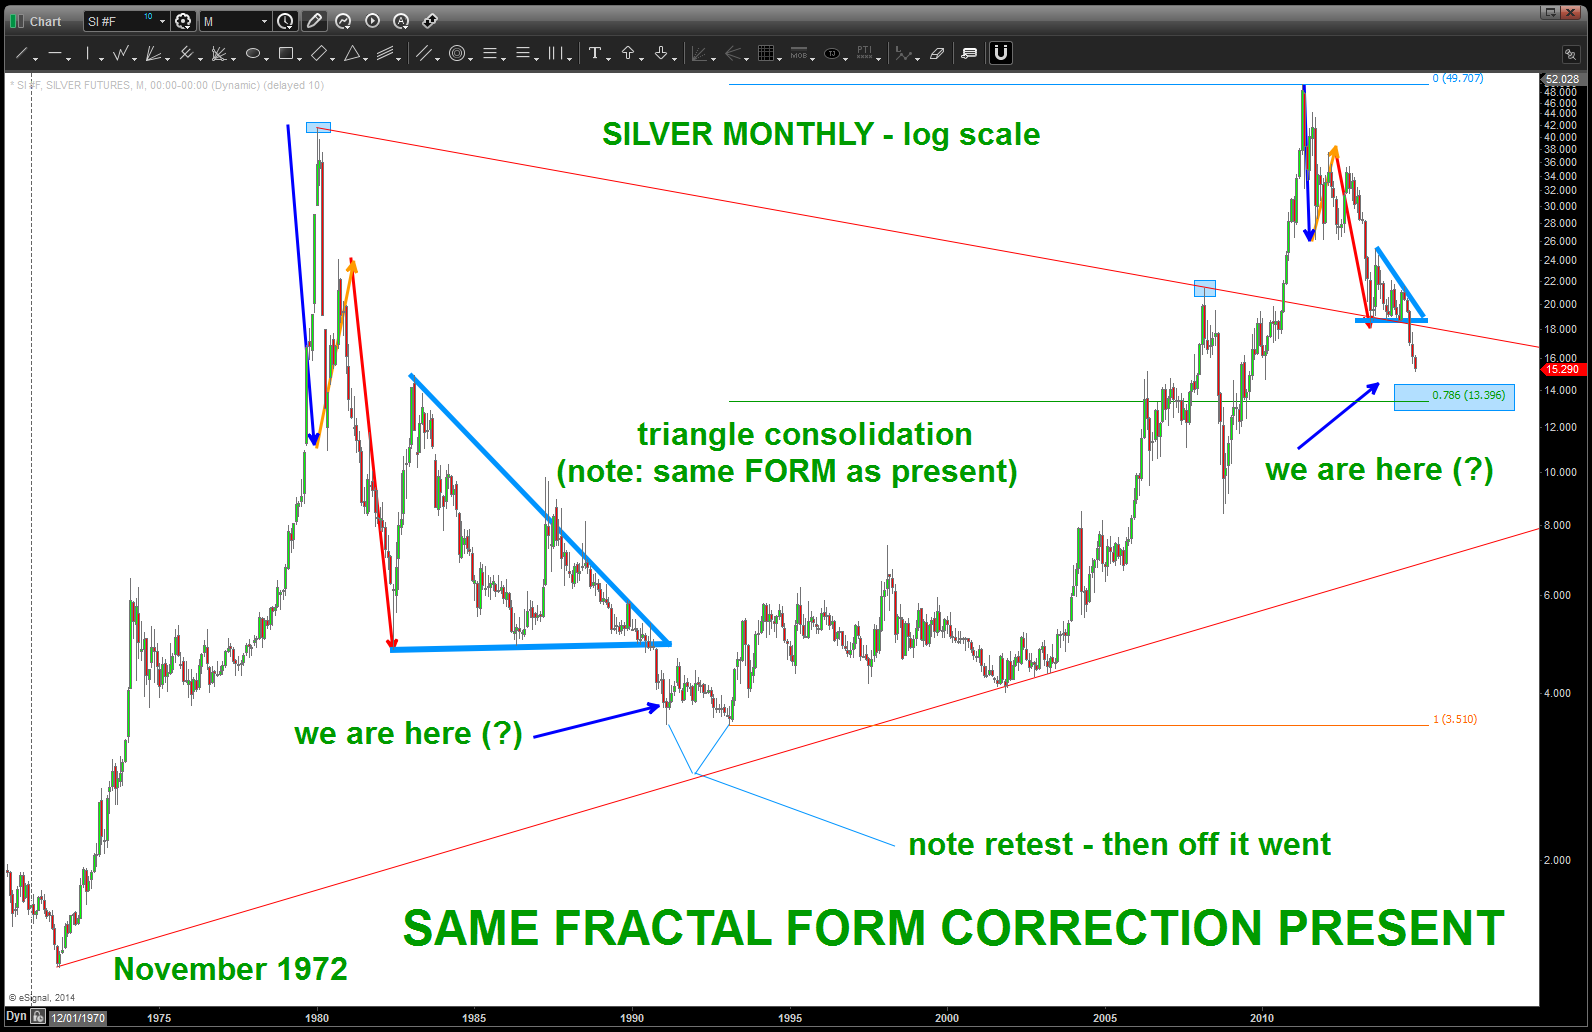
anyway, this AM, went to LOG scale (very powerful on long term charts to help see accelerating rates of change … and it’s also a very powerful way to see PATTERNS. I saw the corrective move and, well, see the chart below. the SAME FRACTAL corrective pattern is completing.
I am wrong below 12. I like 14 ish.
SILVER FRACTAL
I promise this isn’t going to be a mathematical treatise on the math/geometry behind fractals. We’re going to go down the rabbit hole, slightly, in order to 1) get an understanding of what a fractal is and then 2) relate the current market environment using the Down Jones Transports. We could use more, but that would 1) take too long and 2) I ask that you defy human nature and do the work to prove for yourself. I’m more than happy to answer any questions on a separate thread.
This is from http://mathworld.wolfram.com/Fractal.html : “A fractal is an object or quantity that displays self-similarity, in a somewhat technical sense, on all scales. (my bold) The object need not exhibit exactly the same structure at all scales, but the same “type” of structures must appear on all scales. ” For those not familiar w/ Elliott Wave Theory this is where the “form and proportion” comes into play ….

famous fractal picture ..note how from the LARGE to the SMALL the PATTERN repeats!
For the moment, direct your attention to the far right of the picture above. The large object is the beginning of the PATTERN and produces the form/geometry of all the fractals that will be “spun out” to the most infinitesimal scales. If you spend a modicum of time studying the picture you’ll see that the large “seed” pattern to the right is repeated over and over and over ….
Our thesis is, w/in the traded universe of securities, that PATTERNS do exist and they occur on different time frames and scales but, ultimately, these patterns do repeat. W/ an understanding of the mathematical and geometrical properties present, an edge can be produced to put probability in our favor. Remember, an edge is simply a higher probability of something occurring than not occurring. The patterns DO NOT work every time, but over time they do produce and edge. If we can wrap them into the context of the circle of life (fixed income, equities (global and CONUS), FX, commodities) then we can potentially make accurate forecasts of inflection points.
Let’s go back to the picture above … the pattern had to start somewhere. As discussed, the pattern started to the far right. W/in the world of traded securities we use the IPO date or, say, an all time high or low to begin forming the pattern that all smaller fractals/patterns will respect. That is usually from a monthly chart or an .xls spreadsheet w/ the historical data from inception. The patterns that exist in the entire history of this data will, ultimately, make their way to the tick time frame.
So, w/ regard to say the Dow Jones Transports we know that the all time low was 45.59 on 10/29/1896. Additionally, there have been multiple posts over the past couple months looking for the 7580-7620 area to be a PATTERN COMPLETING. This pattern, for all intensive purposes, has completed. And, while it did not hit the pattern level exactly, it did come w/in .003% after 42,281 days. Perhaps slippage, perhaps my lines were too thick … w/ the 5% down day after the level was hit, I’ll say it’s close enough for government work. Here’s the latest post:
The PATTERN that completed was a basic measured move and using the seed of the pattern from the all time low we were then able to REPRODUCE that measured move and PROJECT where this measured move would complete a similar move and produce a PROBABLE area of major resistance. Thus far, the market respected this area.
What does this mean …? Well, again, in the context of the fractal pattern present it means we are correcting a pattern that took 42,281 days to complete. So, the probability of a “large” correction is favorable. HOWEVER, in the context of the history of the Dow Jones Transports this could be an amazing BUYING opportunity but not after a 40-60% percent correction. If we are a day trader or a daily swing trader then this seems catastrophic. However, if we keep in mind that a PATTERN has completed that is 114 years in the making THEN we realize in the history of the Dow Jones Transports a MONTHLY swing low has never been broken. Last thing … this PATTERN could fail to the upside and then, well, it’s off to the races. The power of the PATTERNS is we know, almost exactly, where the pattern completes.
So … PATTERNS exist, some BIG PATTERNS have completed across the circle of life and, not a bullish pattern is present. The probability is that the market will respect these LARGE PATTERNS and cause a correction that in the minds of the twitter/facebook/”have to have it now” world will seem crazy and chaotic. But, if you step back and take a moment to respect the historical context of this moment, you can 1) adjust your portfolio accordingly and 2) be calm and understand that after this correction an even bigger pattern is now being formed which might be and AMAZING BUYING opportunity …
That will be hard to do … when, this time, blood is truly in the streets. It’s all probability ….
Bart

Pingback: Silver redux | Bart's Charts