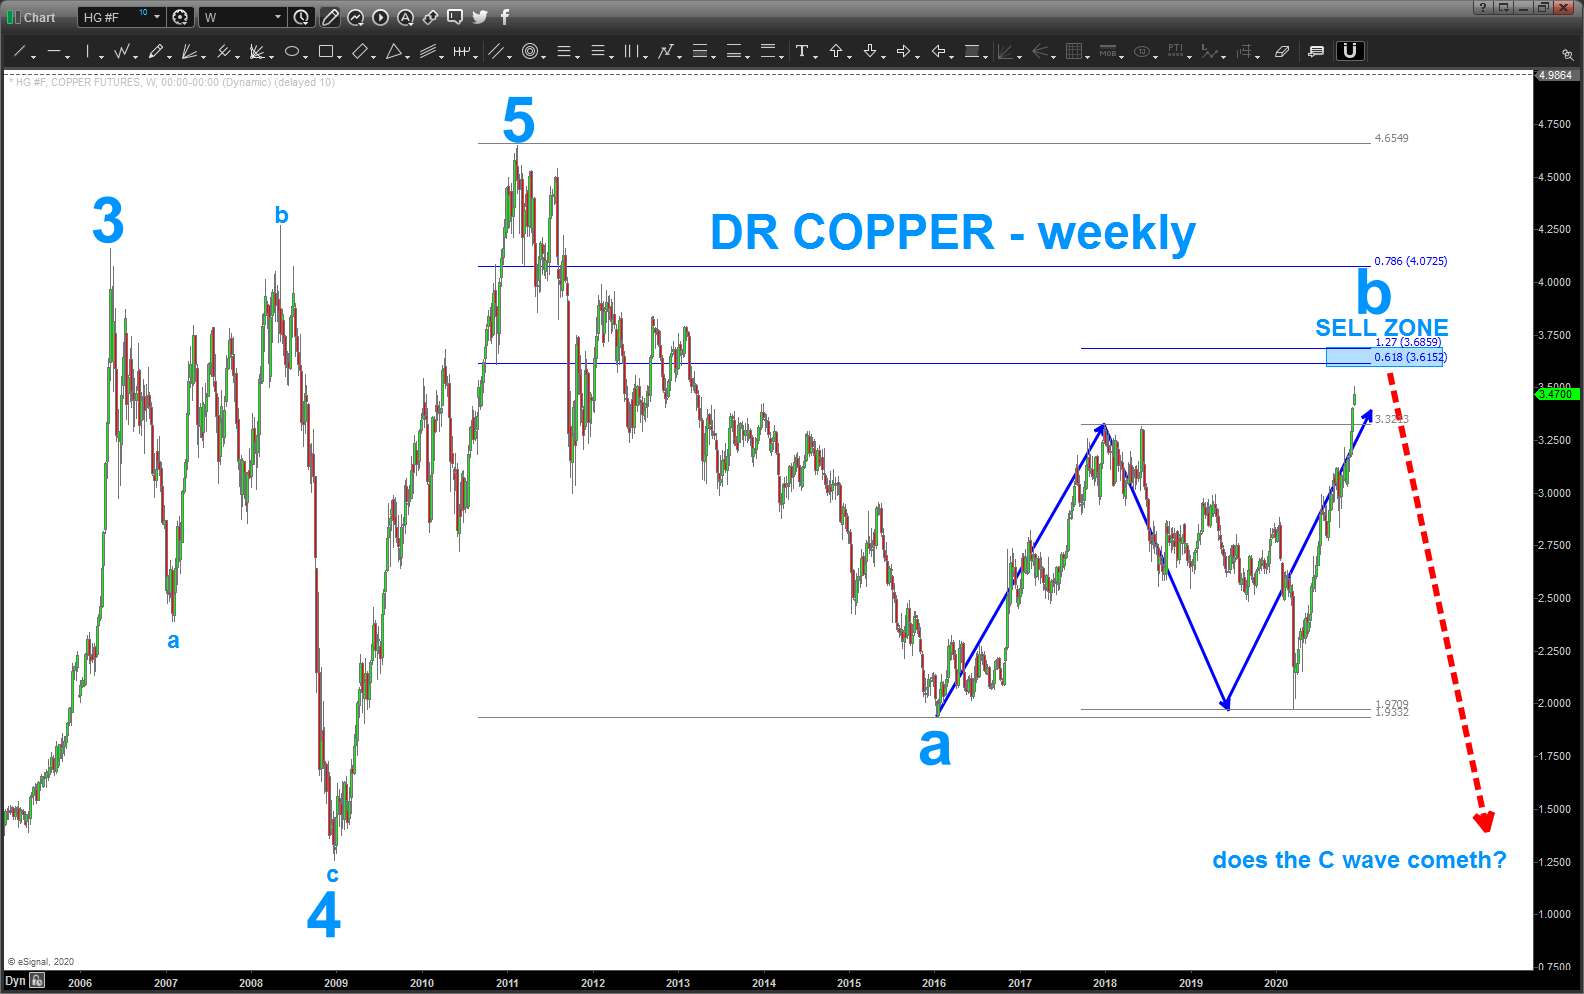
Dr. Copper – UPDATE
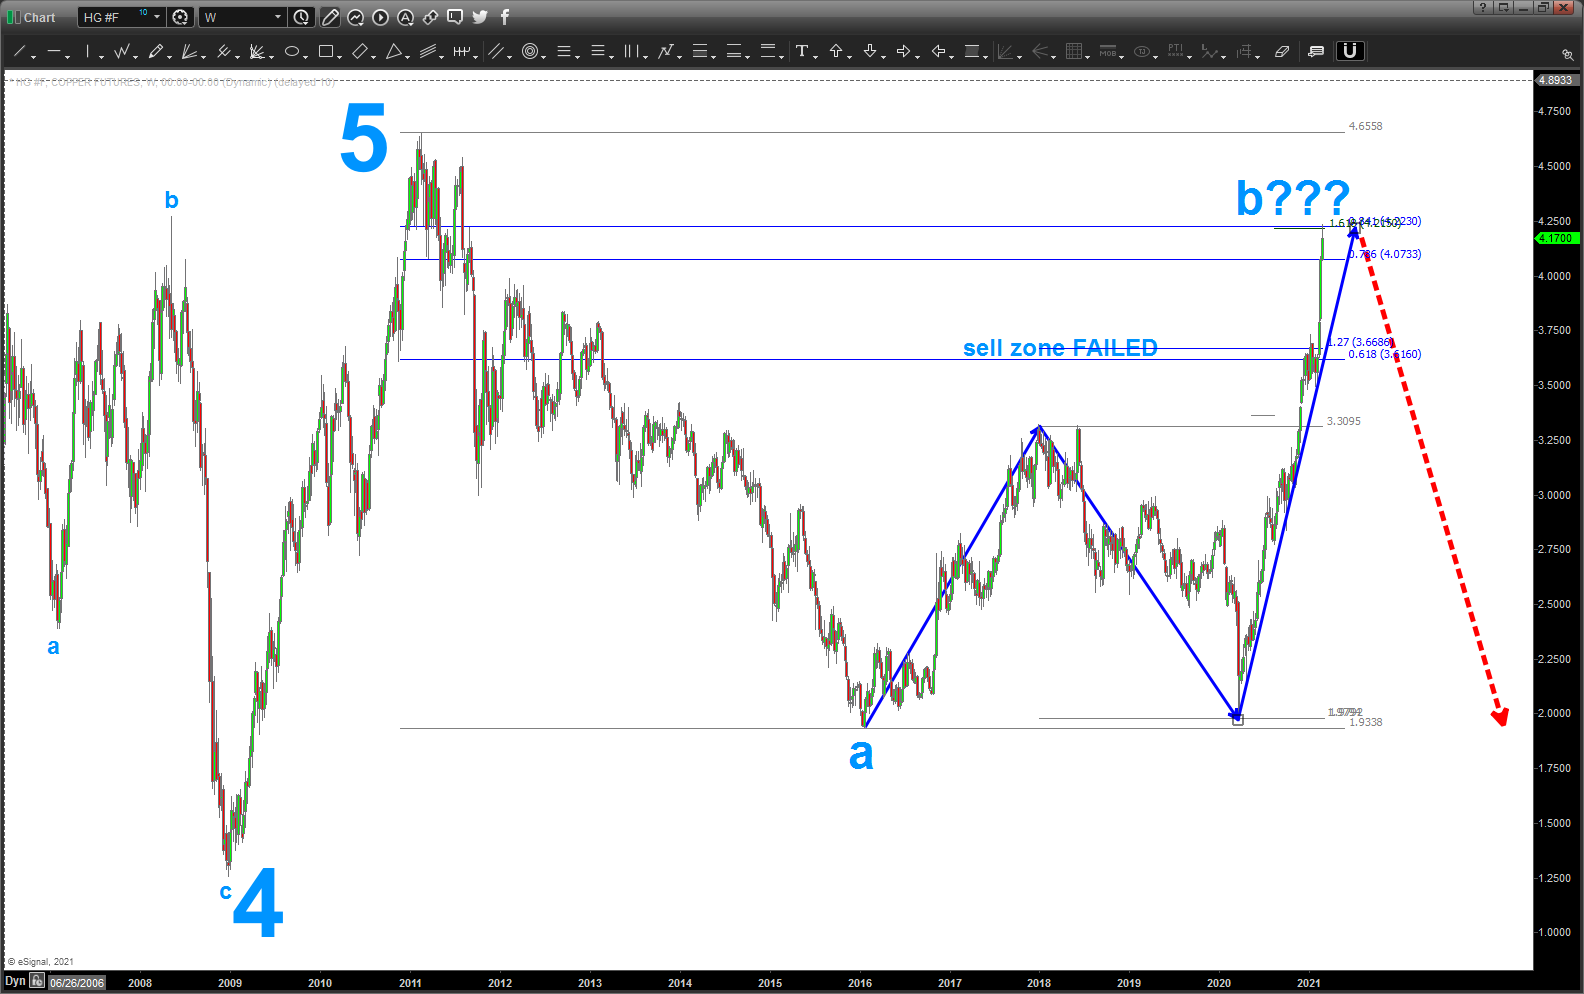
Update 02/23/2021 – the “sell zone” failed but, if you do look at the chart it basically held copper at bay for approximately 7-8 weeks, then exploded higher, just like the stock market. the past couple days I’ve been posting a LOT of 5 counts and took a peak at copper and smacked right into another higher target … yes, we have some strong thrust into this zone it’s something to take notice of ….. why? If the 5 counts are actually ending then this current level is what should hold copper, it’s that simple. If copper explodes higher, which it most certainly can, then I am hard pressed to find a reason for the equities to go down.
note – WATCH THIS COPPER LEVEL!
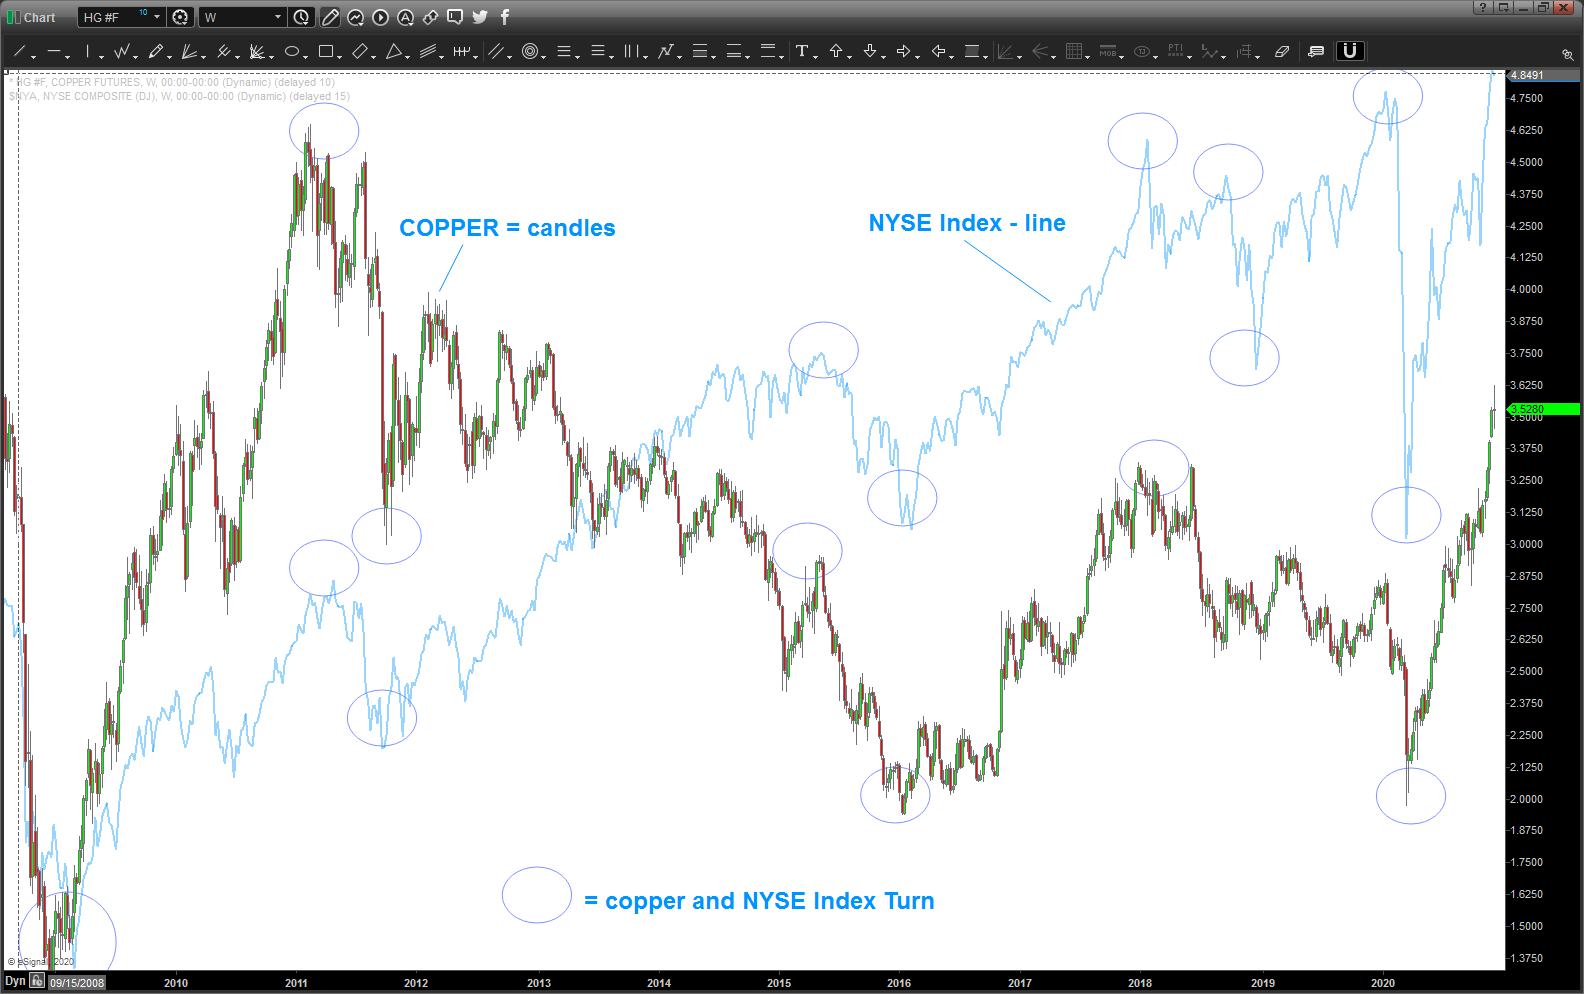
Copper,/ below, smacked right into the “SELL ZONE” … why is Copper being blogged about? Isn’t that a “who cares” type of metal? Ummmm, no. the inflection that occurs in copper has occurred in the stock market, as shown, on every major pivot since 2009, at a minimum. /
so, this “zone” is very important …. watch copper in the coming days/weeks to get a “feel” for the overall health of the market.
————————————————————–
if you’ve been following my blog you know I’ll say “I love Elliott Wave, when it works…!” for Copper it certainly has. one of my first blog posts was about absolutely nailing the low at 4 by using, you guessed it, Elliott Wave.
is it going to work again … I really have no idea. that being said, if we follow the standard Elliott corrective construction, certainly looks reasonable that Dr. Copper is finishing a trend defining “b wave” and, just perhaps, a monstrous “c wave” cometh ….