Lithium Update – July 16, 2026
Here are the charts from LIT back two years ago ….

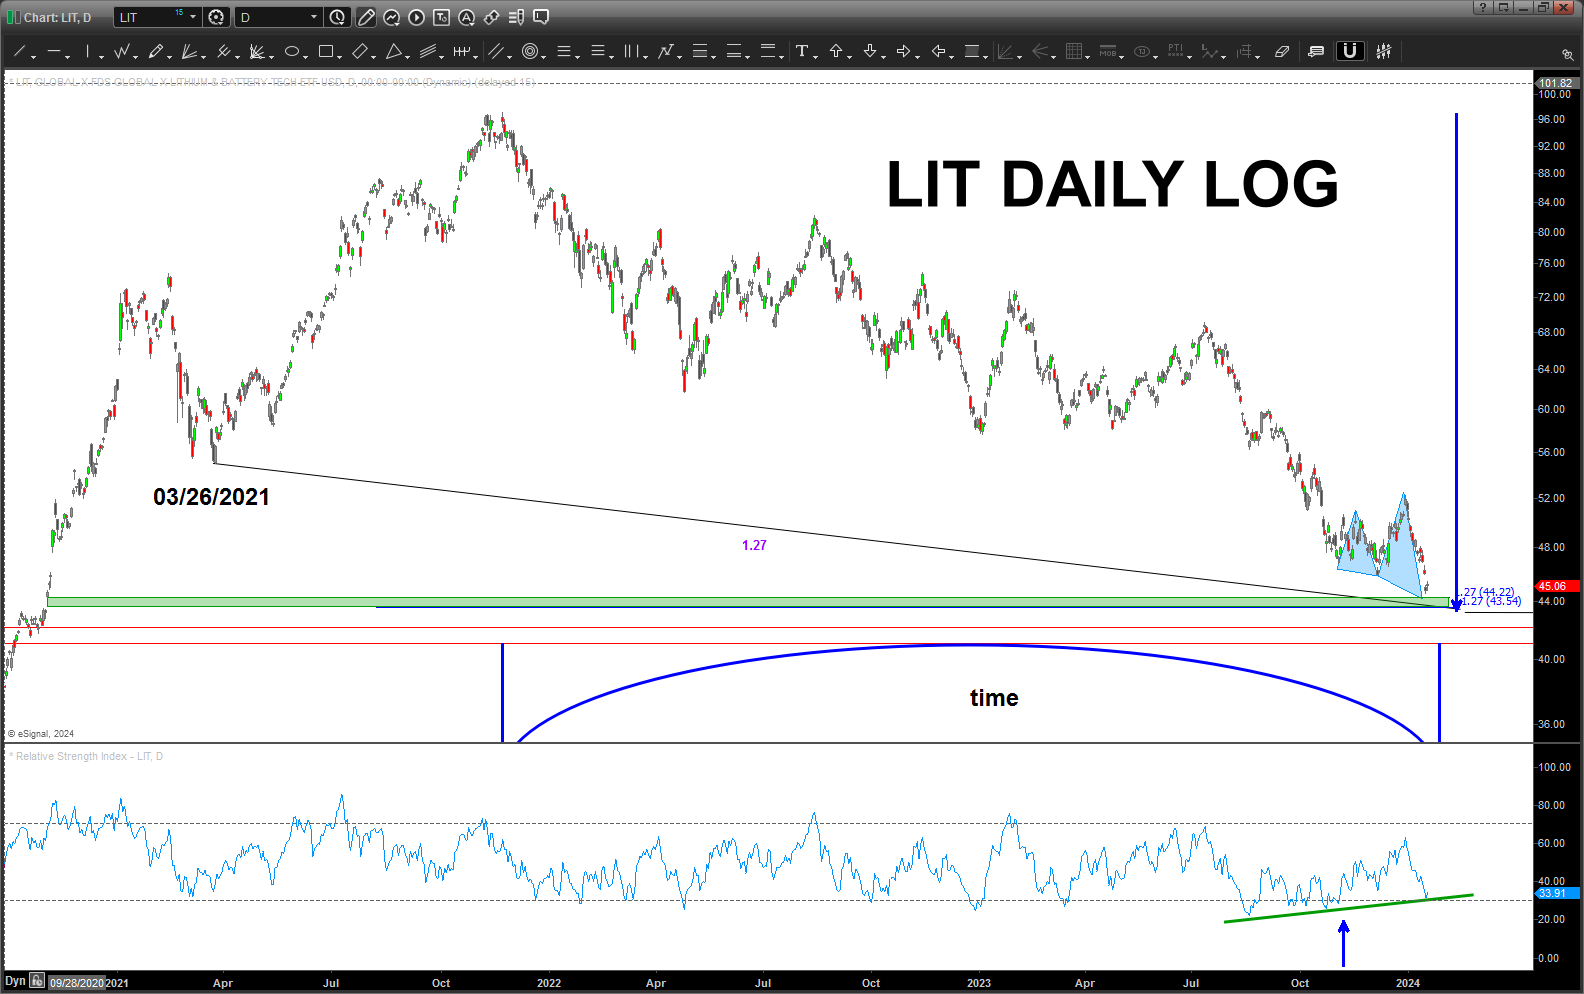
Again, must have been in a rush or just missed it but only used one area for the measured move … it got us in the zone but the exact measured move? Nailed the low …

It went a little below the suggested buy level and was, ultimately the ‘other’ measured move at 67% – exactly. Again, I must have just missed it but there it is. Pretty wild how that works, hugh?
Anyhoo, what you can see above is we have been going down pretty big for the past 3 months. We have a nice pattern of support at the .382 but that big monthly candles begs of caution. So, per below, let it prove to to us. Ultimately, on a monthly, if this is support, it will more than likely be a bounce followed by another wave down. That’s what we want …
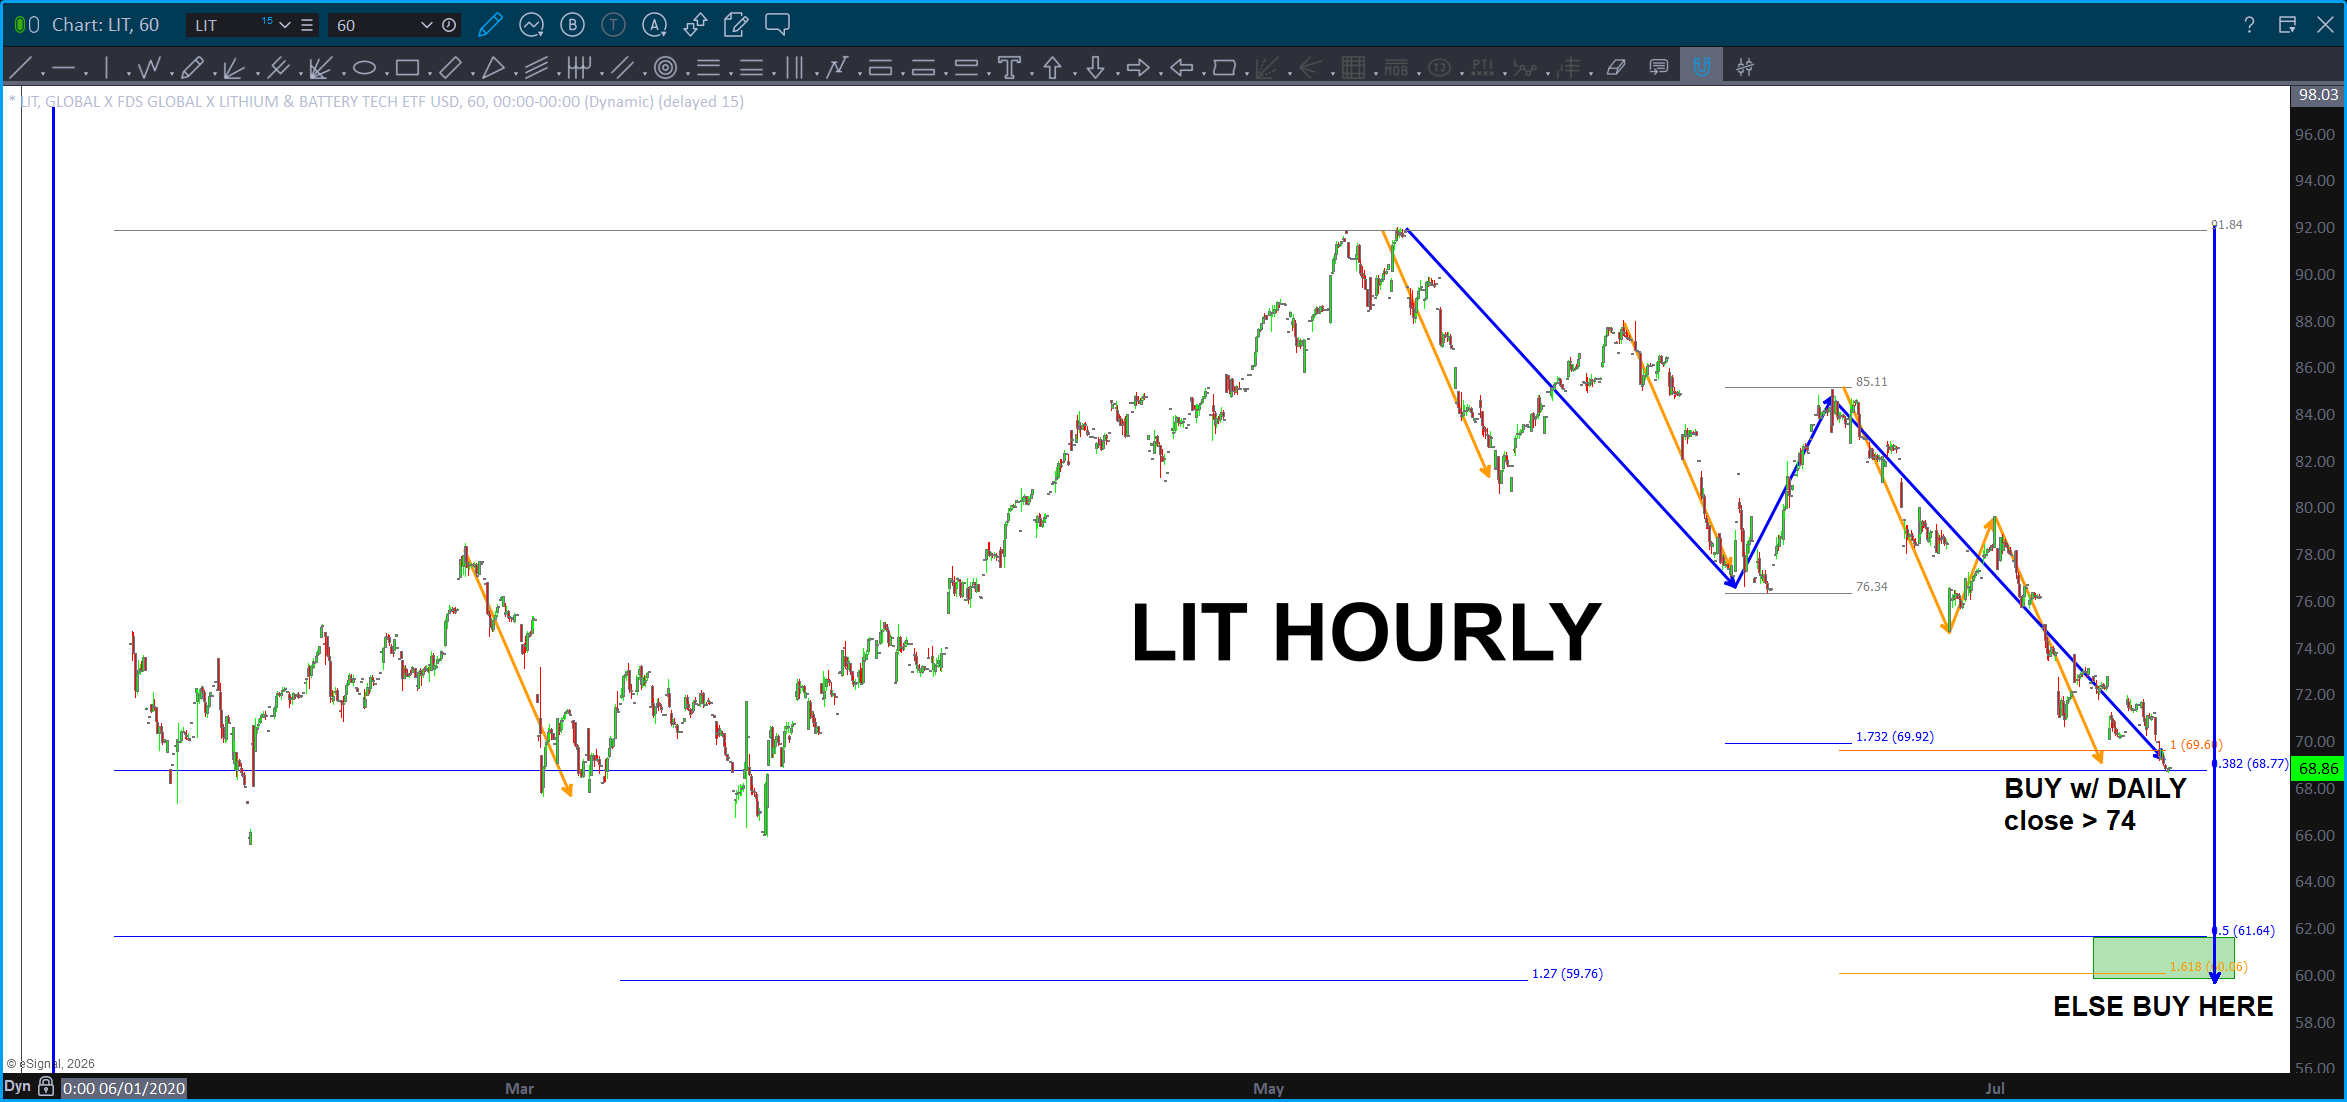

So, on the hourly, it looks like support at the .382 but let’s let it prove it to us …
On the daily you can see a 1.618 price projection that lands right at THE measured move correction w/ the 1.27 extension from the last move right at the 50 percent retracement. We like that so, I’m going to step aside and wait a couple more weeks or months for this correction to fully develop. Which means – I really am not sure what level to buy but I like the lower one because I’m conservative. Ha!
Bart

