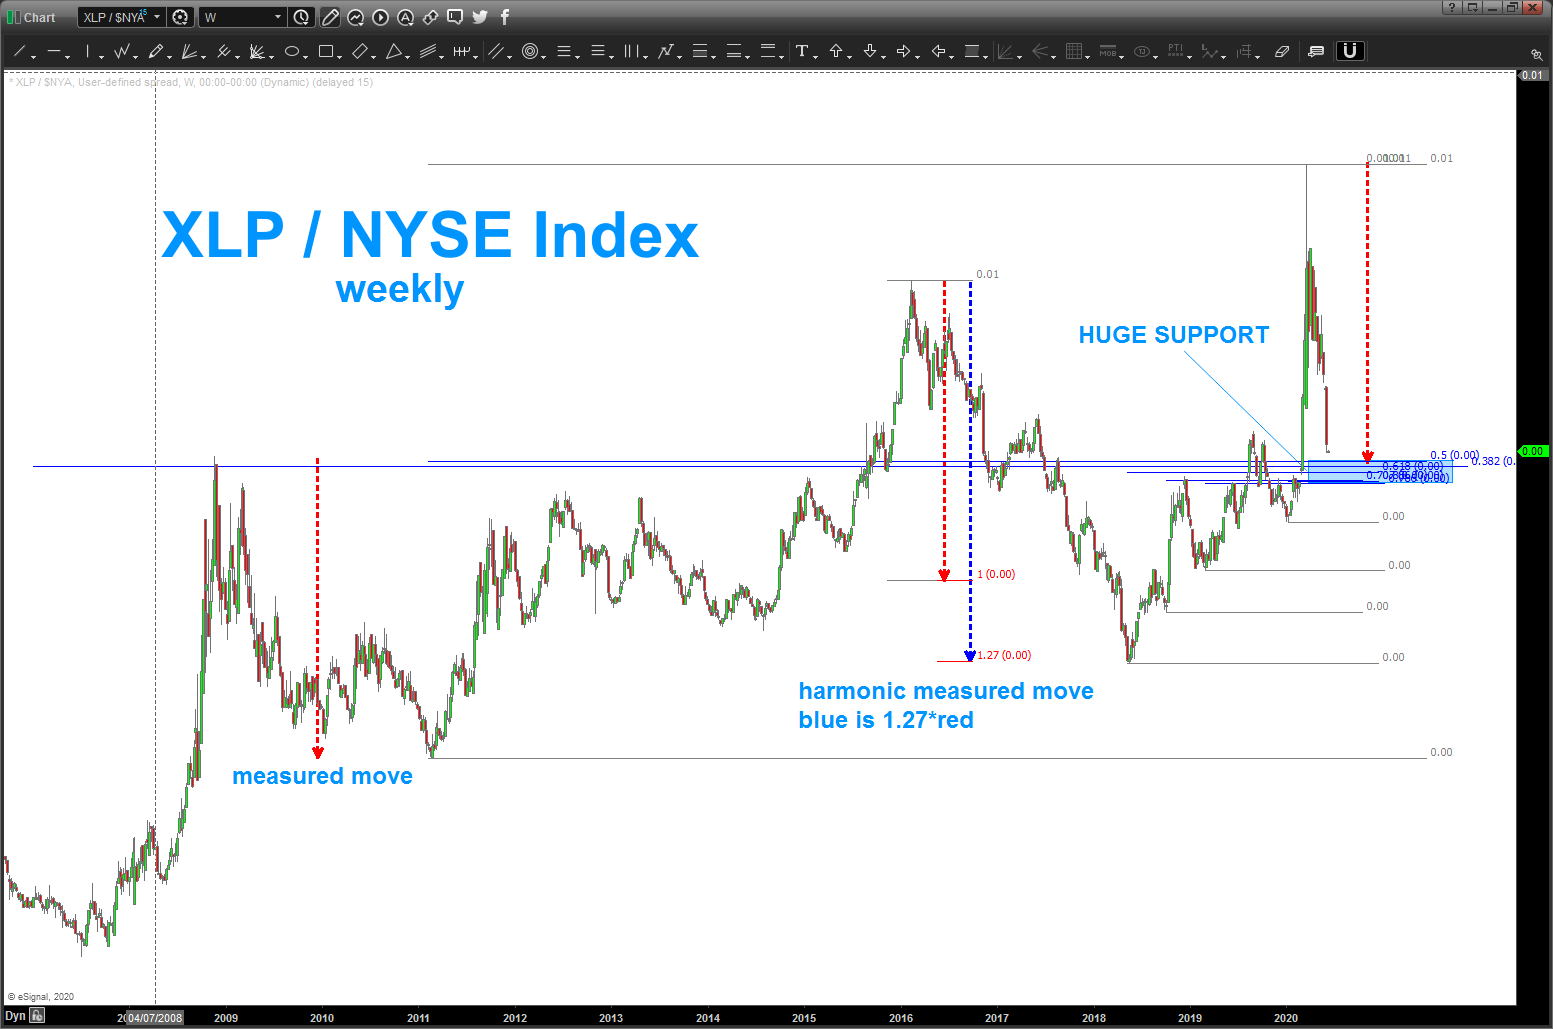
the ratio has HUGE support

can’t believe it’s been since mid-april since I posted about the market. at the time, I spied a triangle forming which proved to be wrong and it broke down and the market has continued it’s advance. humbling for sure .. when I was working up the triangle thesis I came up w/ the level that’s shown below but, honestly, I shrugged it off. “it’s not going to go all the way down there, I thought .. ” but I do remember saying, “if it could get down there, then what a perfect spot to short the market.”
folks, we are there … don’t hold me to it BUT I have around 12 reasons that this is HUGE support for the XLP/NYA ratio. don’t need to go back over the importance of this ratio … for a summary when ratio goes up risk is off and when ratio goes down risk is on. UP = bad equities. DOWN = good equities. so support should mean bad equities.
put/call ratio at an extreme, sentiment at an extreme and MONSTER support on the XLP/NYA ratio. probability says support holds and equities top and start back down … all for now. let me know if you have any questions.
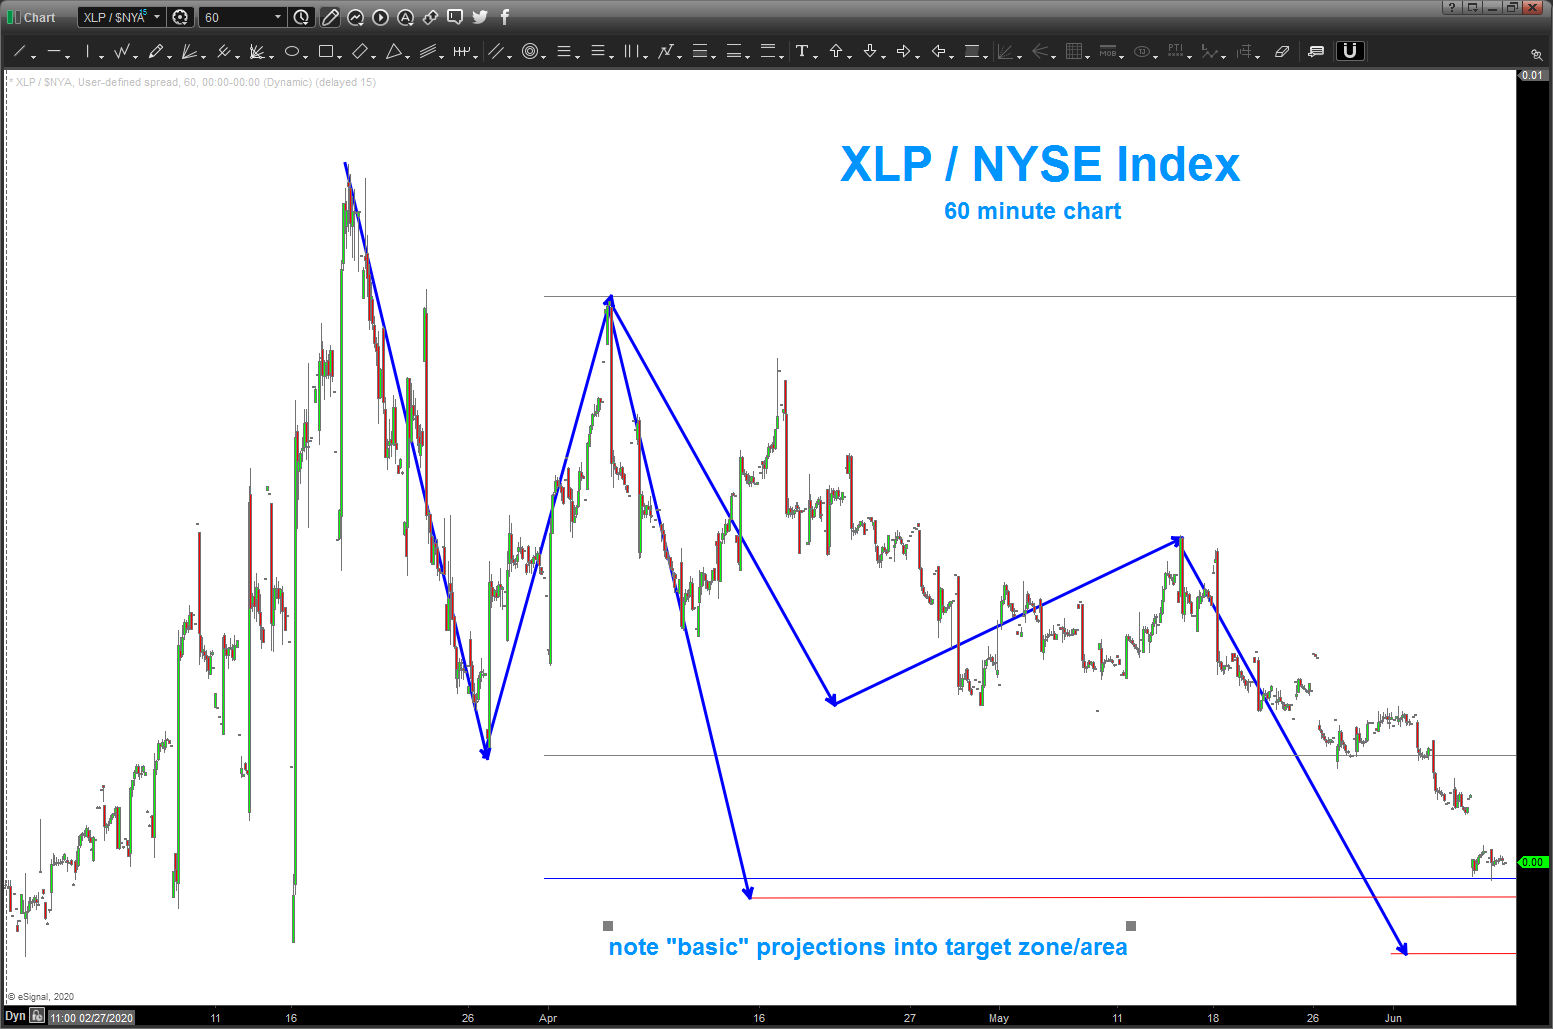
disclaimer: this is ALL probability but we now have a very well defined street sign. the market COULD blow right thru the level below and it’s a rocket ship takeoff higher … that is also a probability.
so, play it safe … if it bounces strongly in / around this area then short BUT if it closes on, say a weekly basis, below the defined target area w/ conviction then be long. but for NOW, would wait and see which way she goes. hope this helps.
be safe out there …. Bart