BABA update …
last post on BABA: https://atomic-temporary-44460632.wpcomstaging.com/2020/08/23/baba-3/
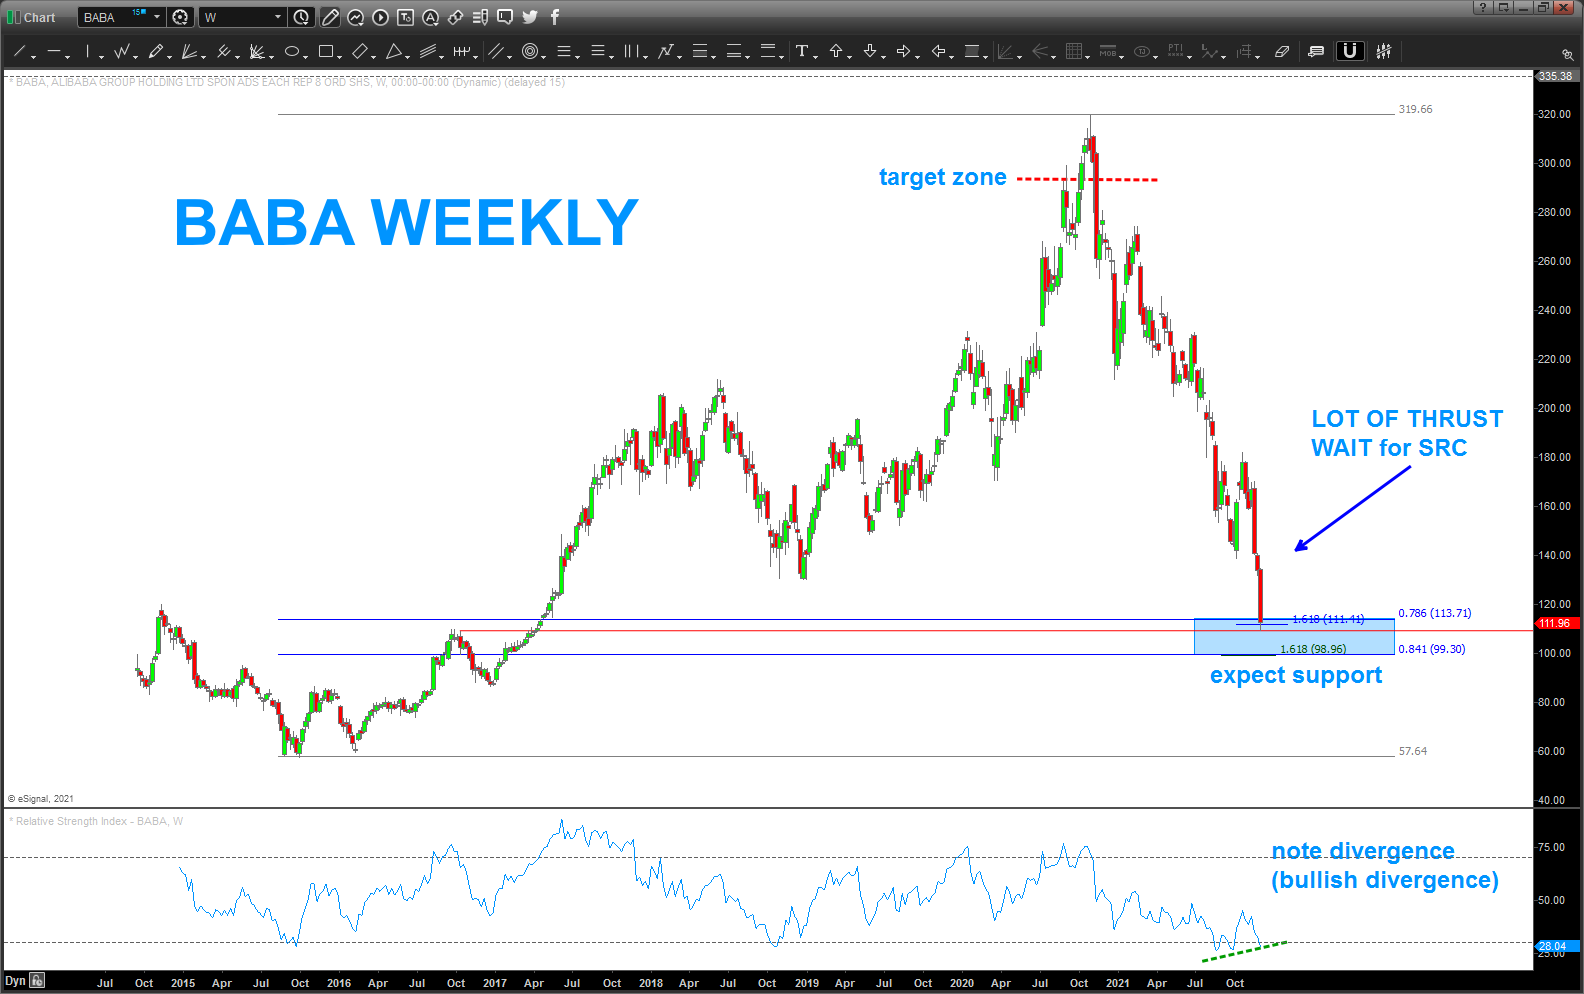
note the thrust coming into this very important .786 retracement node. additionally, we have a 1.618 projection a little lower sitting right on top of .841 retracement. (1/1.1892 = .841 equal octave scale of music ratio) and we can throw in some polarity and bullish divergence so would expect some support or a pause.
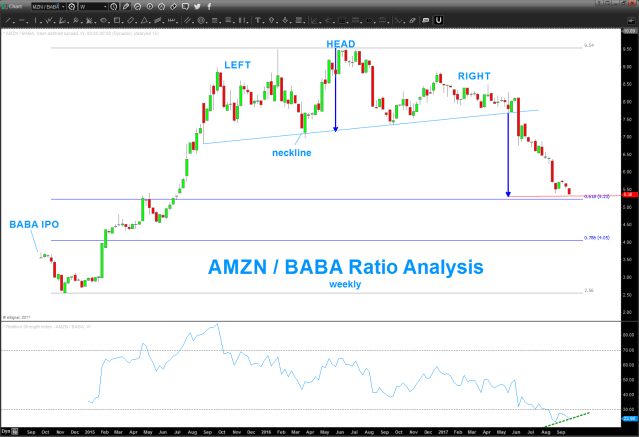
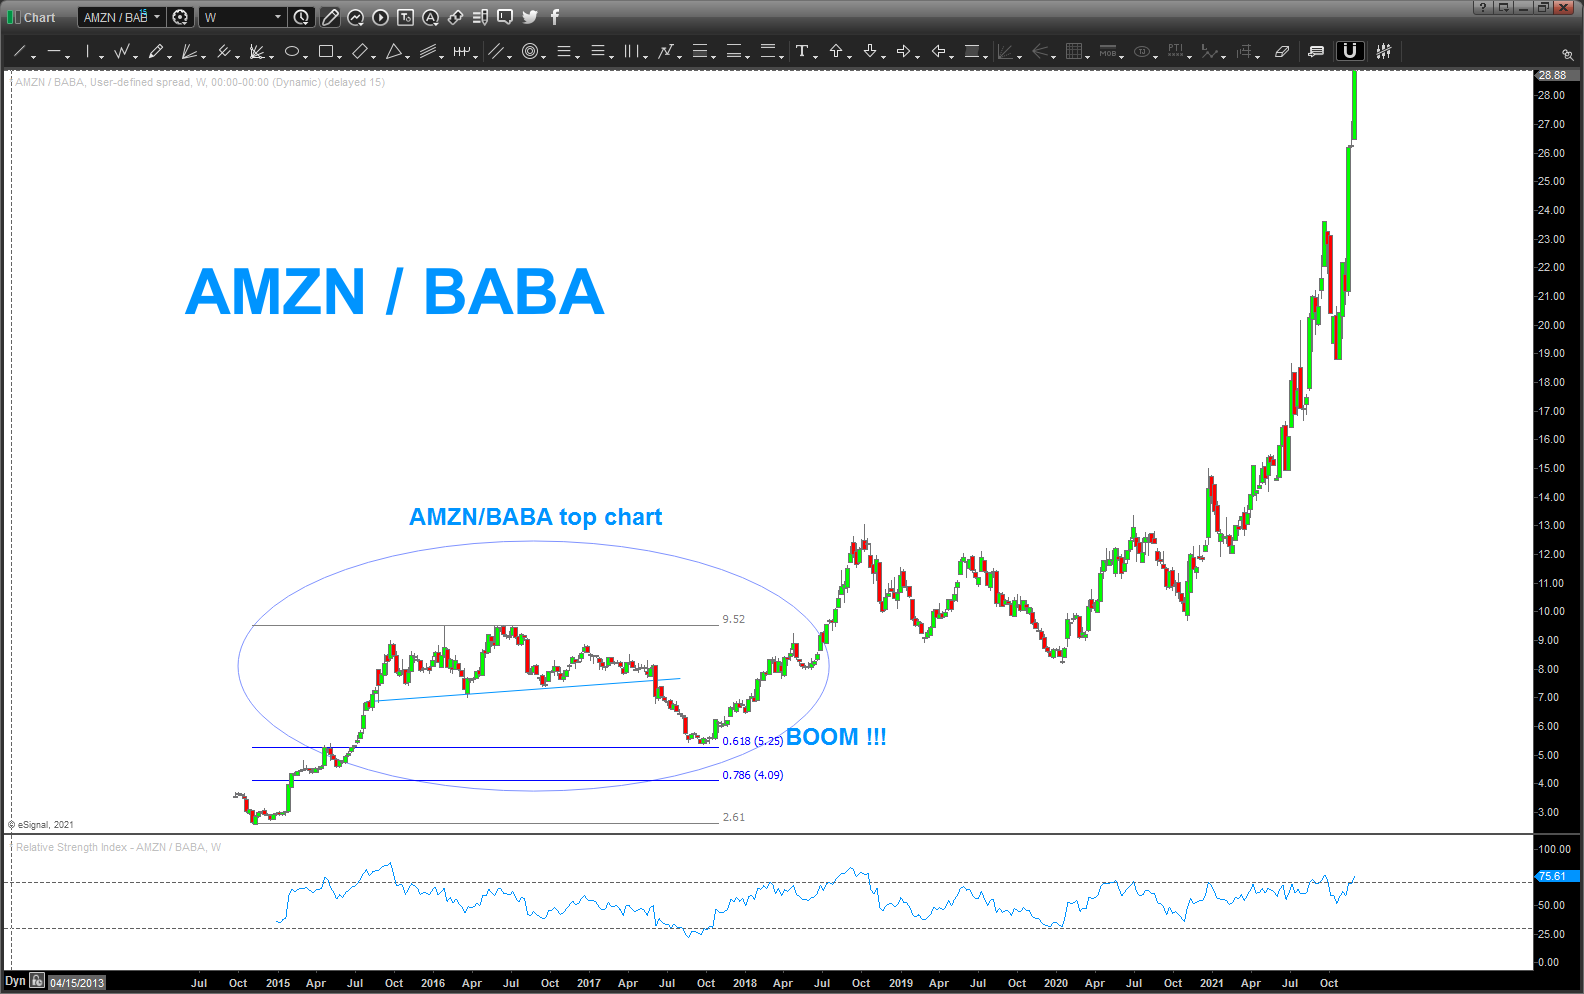
that being said, I enjoy doing ratio analysis so here’s AMZN / BABA. the first graph below is back almost 4 years ago when I did the same relative strength look because, at the time (believe it or not) BABA was stronger that AMZN. don’t believe me? look at the ratio … it had been going down for a couple years as BABA climbed but then guess what, measured moves and retracements and a bunch of pattern stuff gave AMZN the support in the ratio and off it went and the rest is history. (note, did I mention – once – anything to do w/ sales, or revenue, or anything like that? nope …just numbers and patterns for me)
if seriously trying get long BABA I would watch for a daily or weekly SRC before entering. when I look at those relative strength ratio charts it looks like BABA is about to get smacked even harder so caution warranted … wait for an SRC.