Long Bond Futures – May 15, 2023
If your a technician, you can’t help but notice the very long (month ish) consolidation occurring in the bond market.
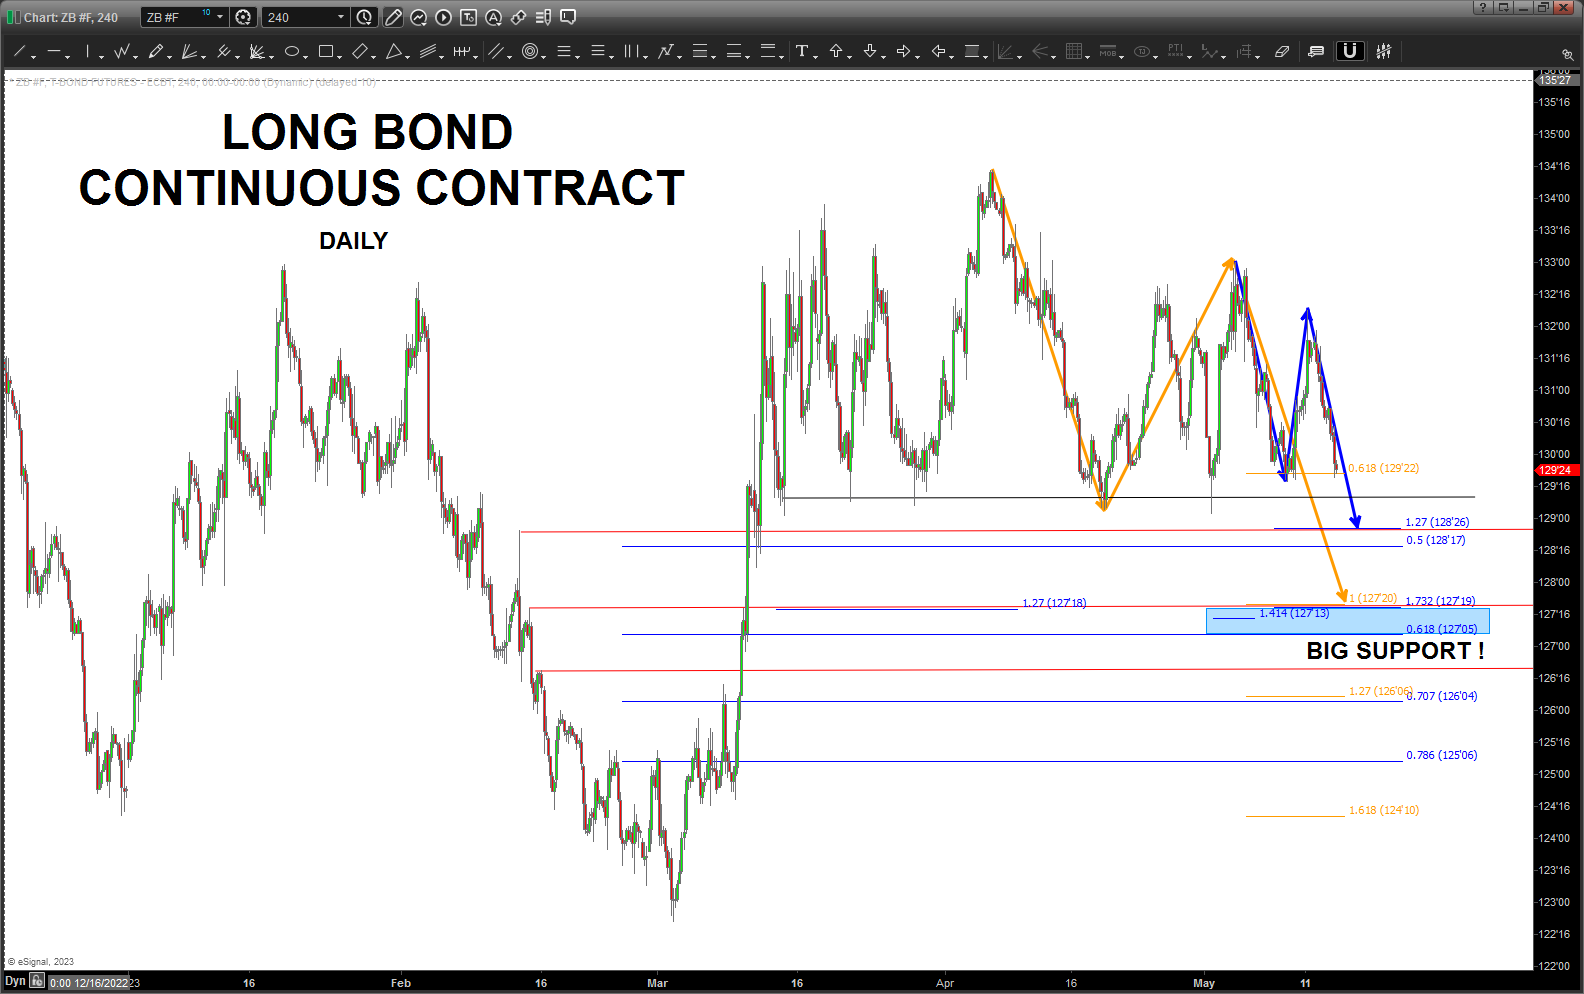
Today’s price action appears to want and break the support that has been around since March 15th. As you can see above, we do some ‘basic’ projections and right when the neckline breaks there is minor support (blue projection arrows) and then the BIG support w/ the blue rectangle present. A lot of math coming into that level. I believe that is the crucial level.
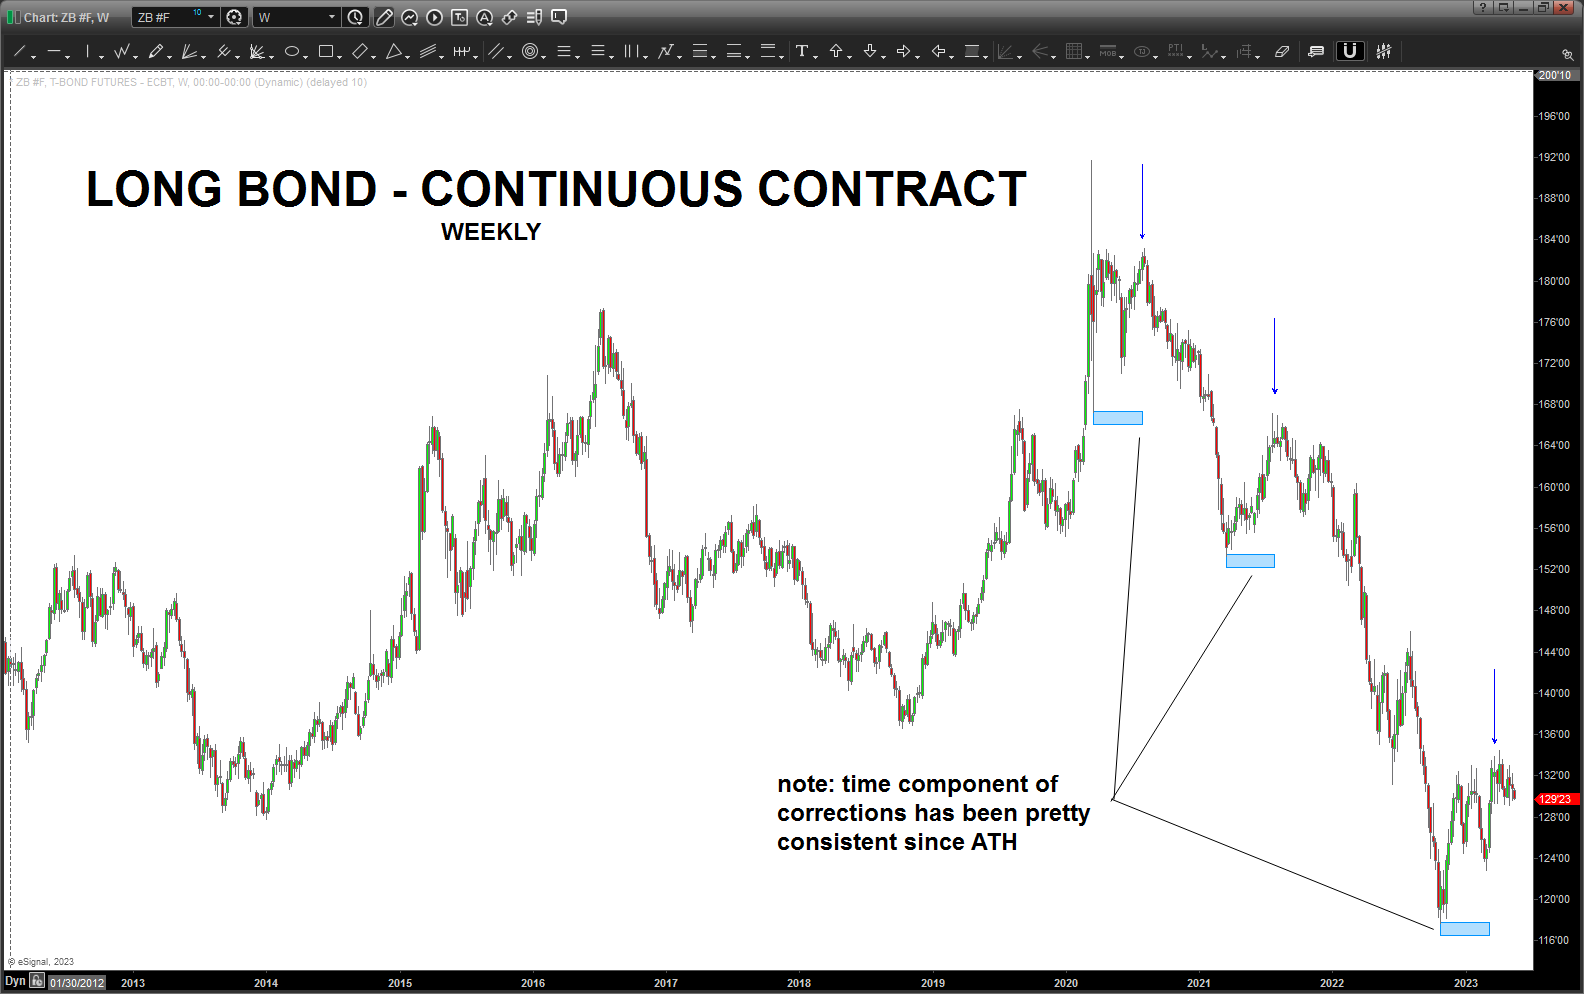
As you can see from the weekly chart above, the “time” of the corrections have been pretty symmetrical so from a timing perspective certainly looks like this “bounce” has run it’s course for one more leg down.
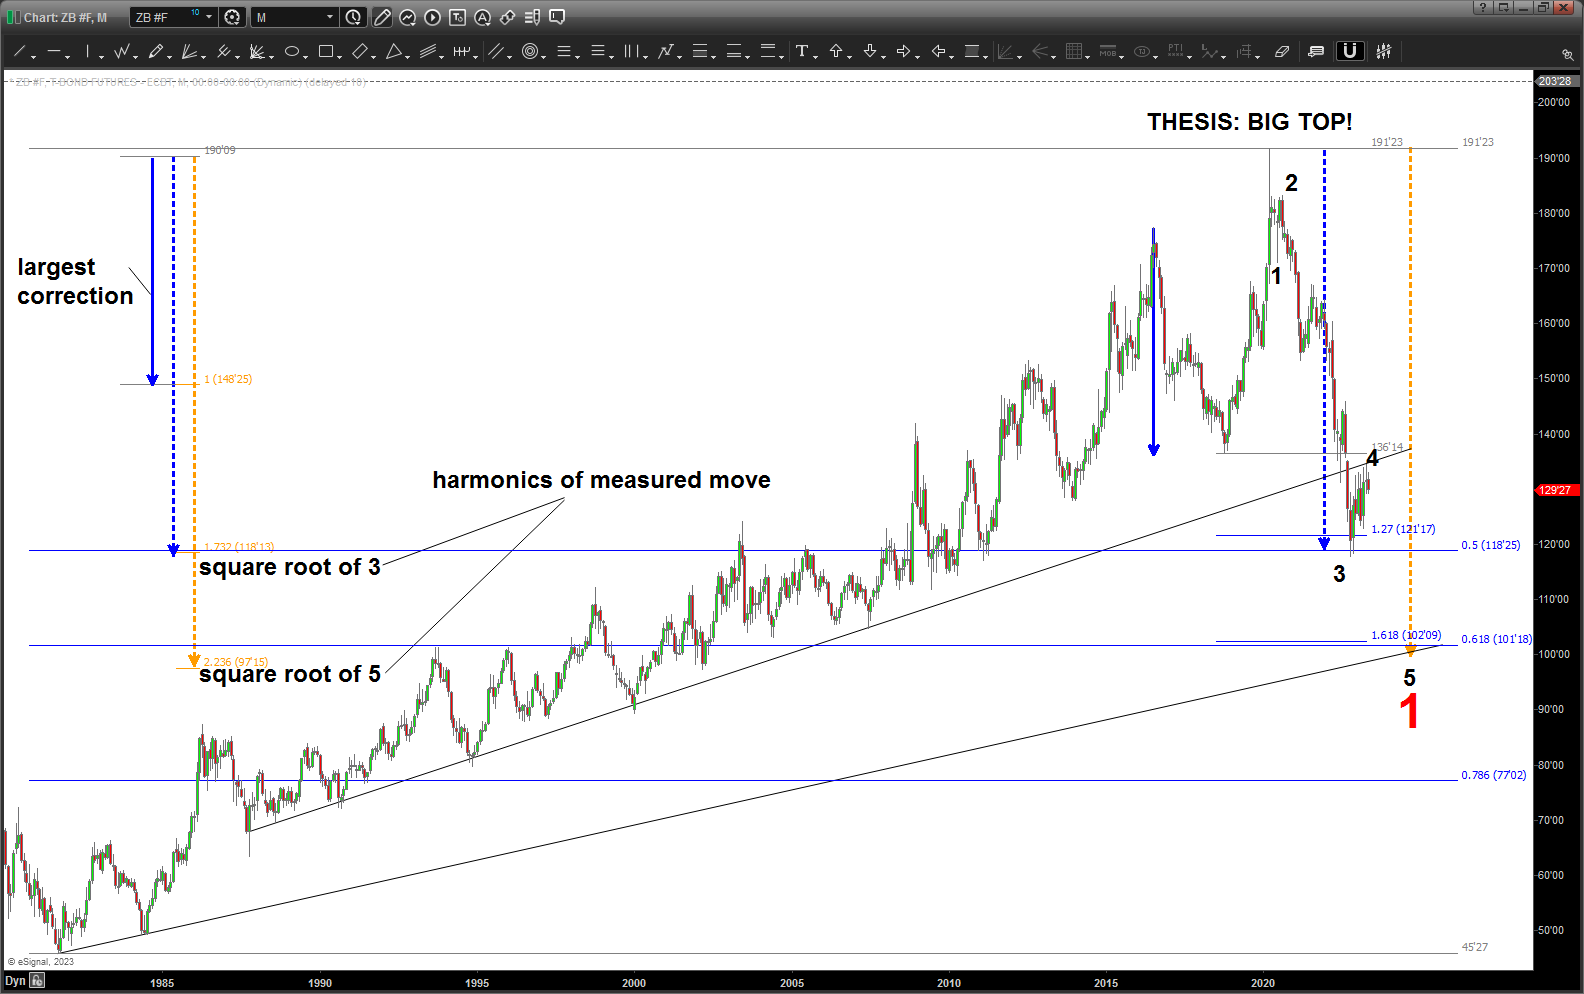
From the ATH, it’s a pretty clear count and I’m labeling this as a 4 completing/completed and another leg down (rates go UP in this case) into the .618 from the 1981 low (40+ years ago) in bond prices. Note the blue measured move above .. that was the largest correction in 40+ years. We take harmonics from that and you can see the square root of 3 harmonic nailed the low precisely. We have a .618 retrace, 1.618 extension, trend line coming from the low in 1981 and a harmonic of the largest prior correction.
That level is a good level to BUY – if we get down there.

Hi bart, any thoughts on crude oil in terms of a major bottom