KRE Regional Banks ETF – May 12, 2023
Last post on KRE: https://atomic-temporary-44460632.wpcomstaging.com/2023/04/30/kre-regional-banks-etf-april-30-2023/
Supposedly … who knows what is true these days .. 1000’s of banks are underwater. OK … whatever.
Here’s when we look at the CHART and we ask should we BUY or SELL or DO NOTHING.
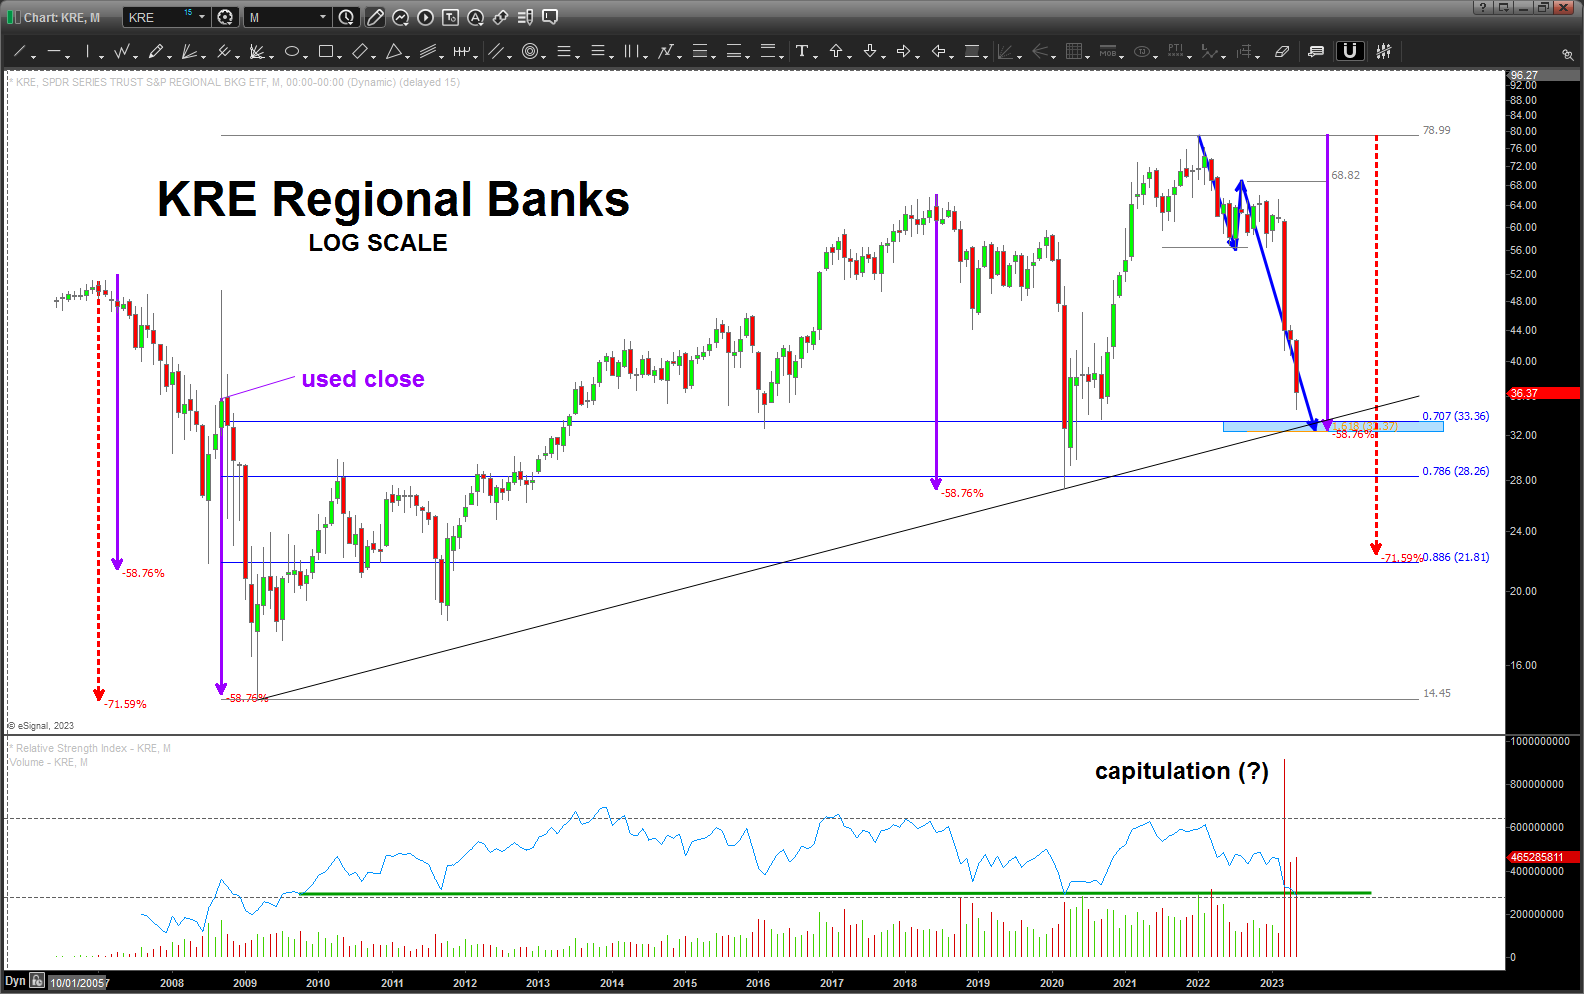
KRE sliced thru the first “potential support” and now we approach, what I think, is the KEY to the KRE. Here’s why:
- 58.76 – if you look at the purple measured moves you will see that EVERY major swing down has been 58.76%. I’ve used the “close” in 2008 as I’m not sure if that is a good print or not .. either way, that measured move nails EVERY LOW
- 1.618 projection lands … right at the 58.76 correction.
- .707 (square root of 2 = 1.4142 and 1/1.4142 = .707) just a little above this level
- Long term LOG trend line right at .. all the above
- Note the VOLUME – is that a capitulation spike in selling volume?
- RSI sitting at the crucial support level for the ENTIRE bullish move since 2009
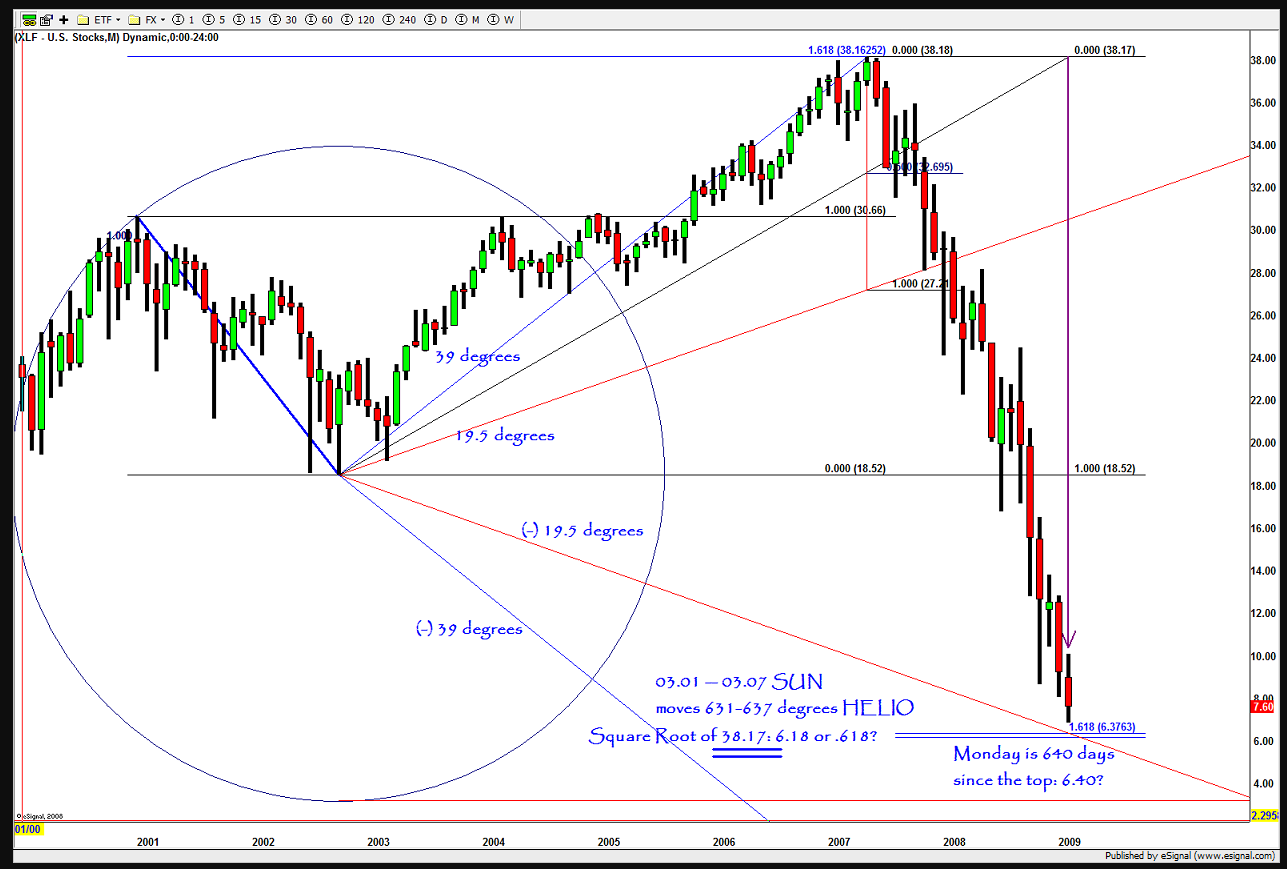
Nobody in their right mind is looking to BUY the banks but, then again, I can guarantee you NOBODY was looking to buy in March 2009. Maybe there was someone? Perhaps … me?
DATE STAMPED 3 MR 2009. (March 3, 2009)
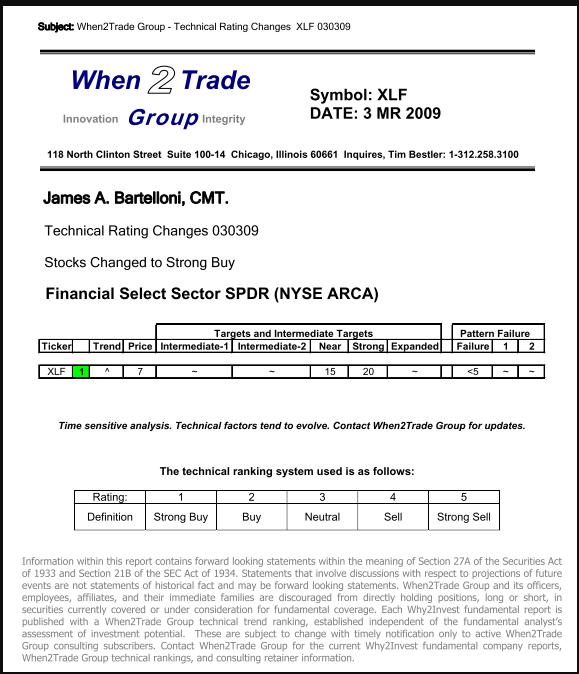
Here’s why:
So … watch the THRUST coming into this level, maybe wait for a signal reversal candle (bullish).
What I can say is IF we blast thru this level (certainly “feels” like we should) then, yeah, a lot of banks are looking at some tough times and 28 and then 21 are the next targets.
Good weekend to all – B
