NYSE Index – 2 percent’ish higher and we have a BIG PATTERN
Folks,
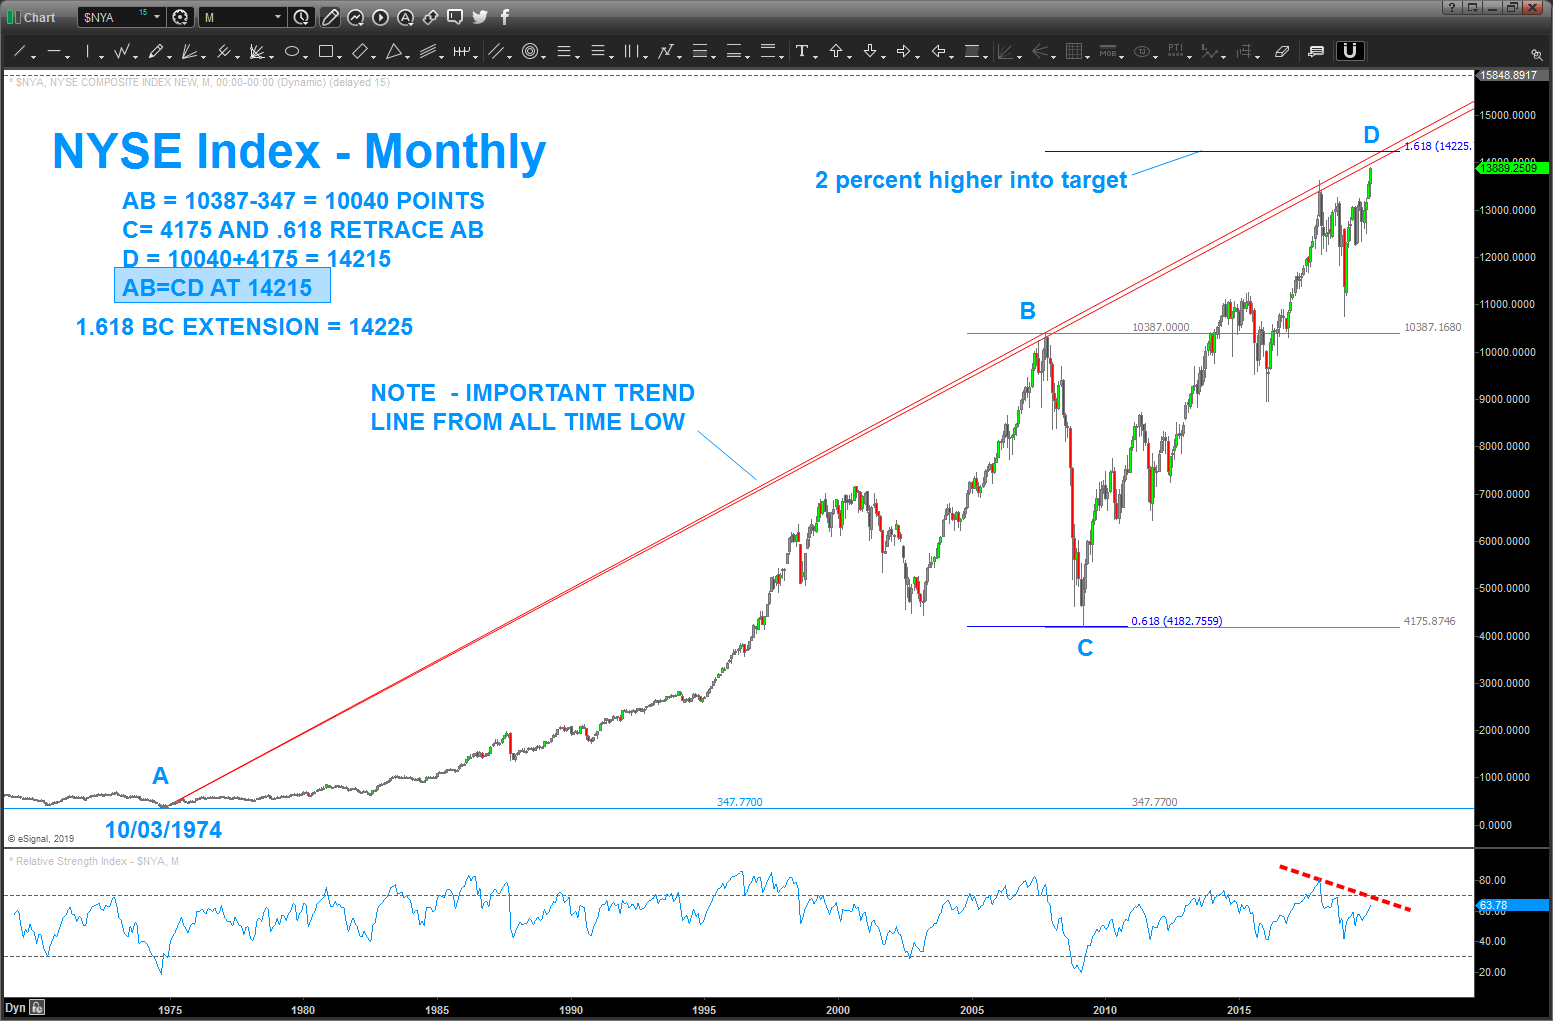
it’s nothing but a pattern .. in this case, from the all time low in 1974 we have AB=CD. You can see the math below …additionally, we have the 1.618 extension w/ in 10 points of this level. The levels are less than 1% away from each other. to add some more fuel to the fire we can easily see the monthly bearish divergence present on the 14 period RSI and then the key trend line that tagged the October of 2007 high and, most recently, the January 2018 high …
now, I want to explain something about PATTERNS. I’m not calling a top or making a call or any of that. folks, it’s simply a pattern. I saw a expanding triangle pattern on the DOW – that failed. when we look at patterns you can play it any number of ways. you can 1/ take profit if long or 2/ tighten your stop and watch for a monthly signal reversal candle or 3/ short at the level w/ a stop according to your risk patterns or wait for a weekly/monthly signal reversal to get short. then again you could 4/ do nothing … or if you want to get long – wait for the level to be breached to the upside and then WAIT and o a pullback it will come back to that old level and then trade against that from the long side …
so you see, it’s just a pattern and, because of the long time frame that has made these patterns (AB=CD and 1.168 extension) it is something we need to pay attention to …
it’s only 2% higher …
have a great Christmas w/ family and friends. if you celebrate something else, celebrate as GREAT as you can.
happy Festivus to the rest of us and be good …
Bart