Traders Tip – “Hidden” Levels … or Pattern Polarity
the gifts have been unwrapped and food a plenty has been consumed … the rest of the family is watching TV and were about to go walk the beach. rained last night so no surfing .. bacteria blows.
anyway, I’ve received more than a couple emails asking about the different strategies I laid out in my last post around a PATTERN level and how you could work them into your strategies.
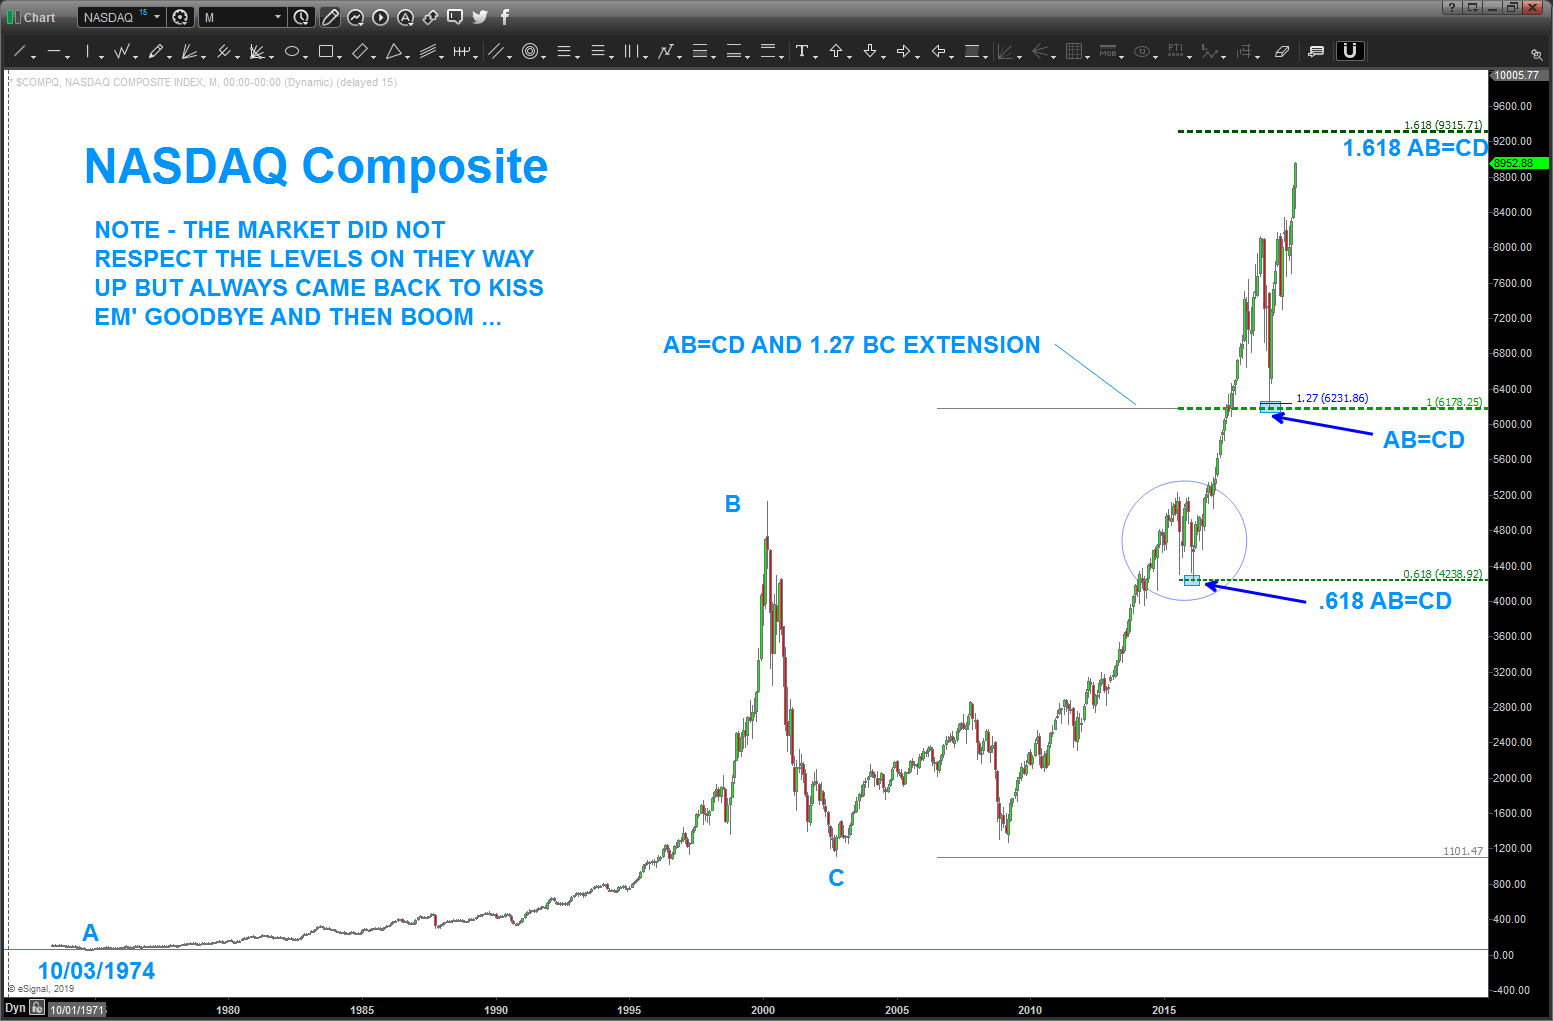
in this case, let’s take a look at the chart below – the NASDAQ composite. I remember, quite vividly, blogging about the 6200 level on the NASDAQ. Why? Well, much like our NYSE Index pattern, you can see that the Nazzie had a very nice pattern from the all time low (AB=CD and 1.27 extension) the market didn’t even pause and blew right thru it …but, notice how it came back and touched it and then exploded higher!
that’s our Traders Tip – this level was ‘hidden’ in that it was a pattern that came from the low in 1974 and also the BC extension from 2000-2002. the market WILL come back to these levels and, the highest probability trade is to trade AT THAT LEVEL and go in the direction of the original break of the pattern. in this case, go long at the level.
notice what happens when we use a .618 projection of the AB leg .. in his case .618 AB at 4238. Just like the AB=CD, the market blew thru it and then came back to kiss it and then off it went … there are examples of this everywhere. the longer the time frame to create the pattern-the more important the level.
one last – notice the 1.618 AB = CD at 9315 … per my last post, around 3% higher, you’ll have a KEY level to trade short, tighten stop if long and wait for a monthly signal reversal candle, or do nothing and wait for a signal reversal candle or wait to see if the market blows thru this level and then patiently wait for the market to return to this level to go long …
I respect and honor all religions … so, Happy Festivus and enjoy family friends over the Holidays.
Bart
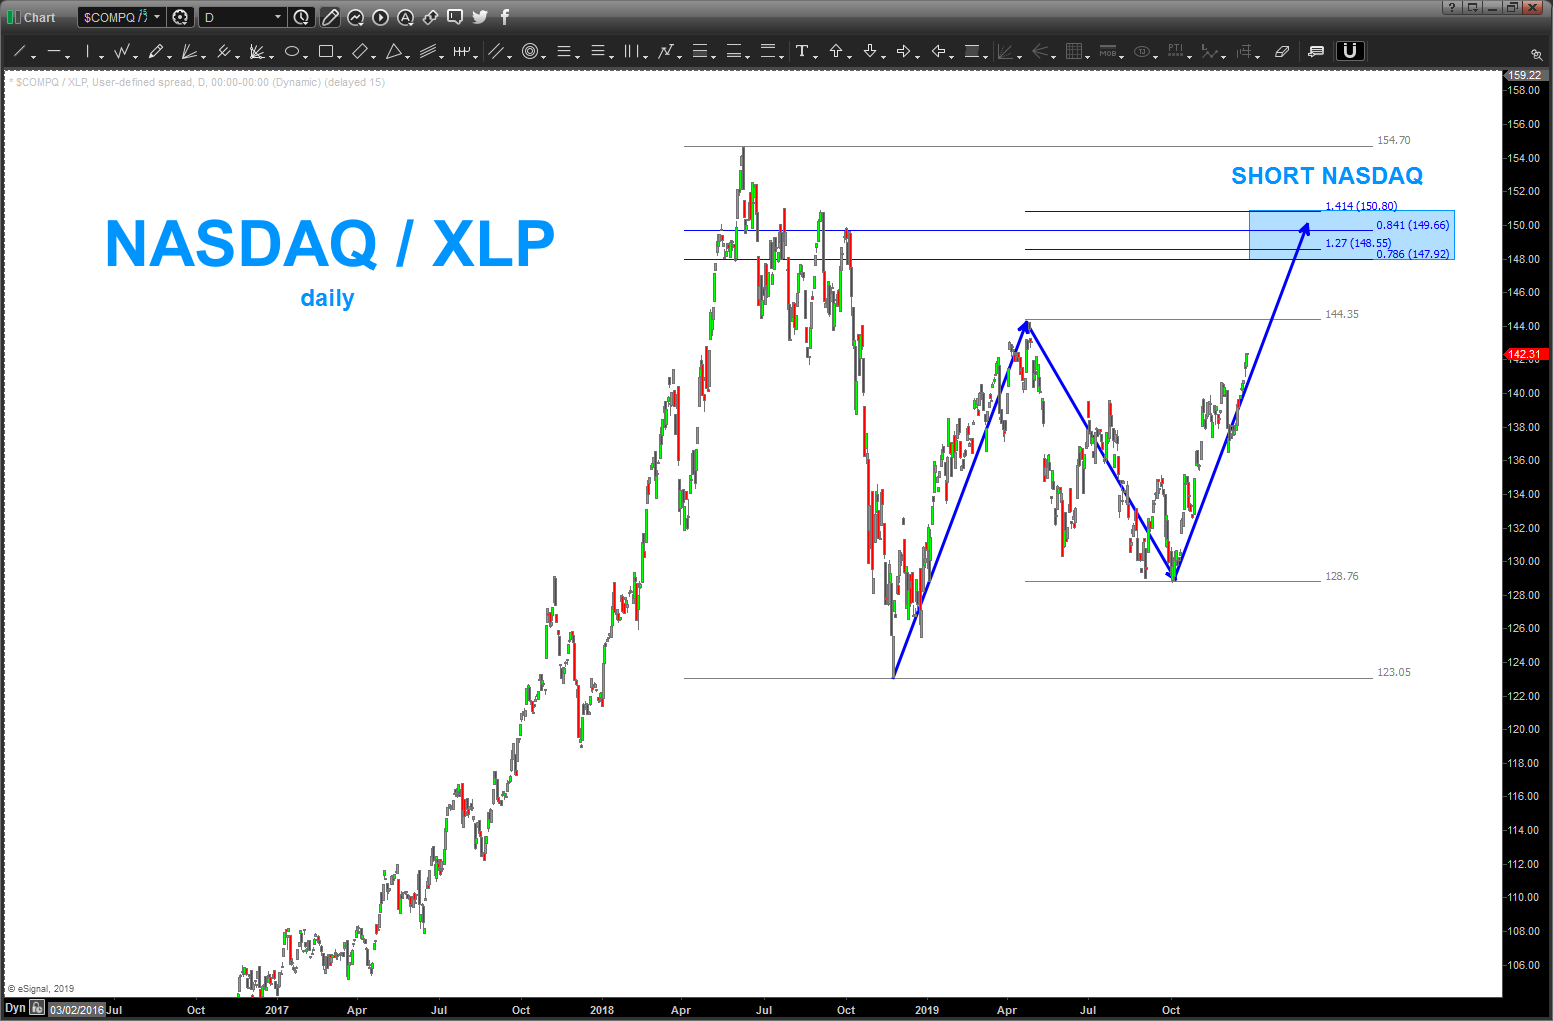
also, look at this clear as day SELL PATTERN on the Nasdaq / XLP ratio. when the blue boxed level gets hit, then SELL the NASDAQ. If, the 1.618 Nasdaq projection AND the Nasdaq/XLP level are being hit at the same time, your probability of an important level to short increases.