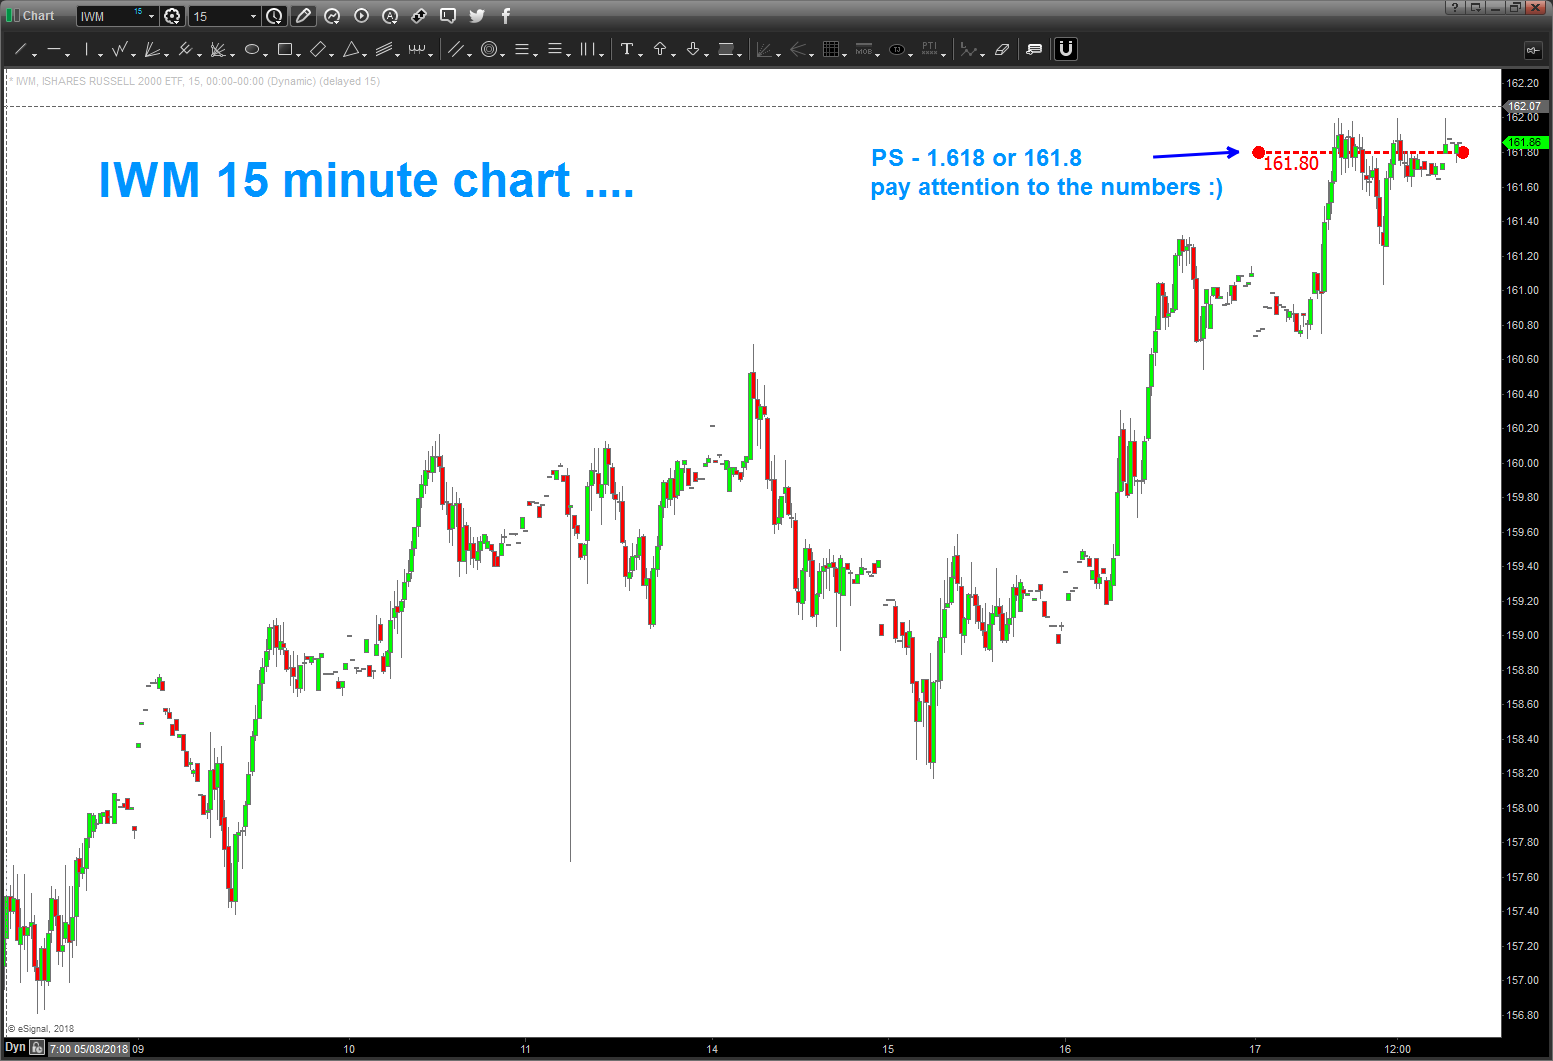
IWM … caveat emptor and check out where price hovered today in my P.S below … cool.
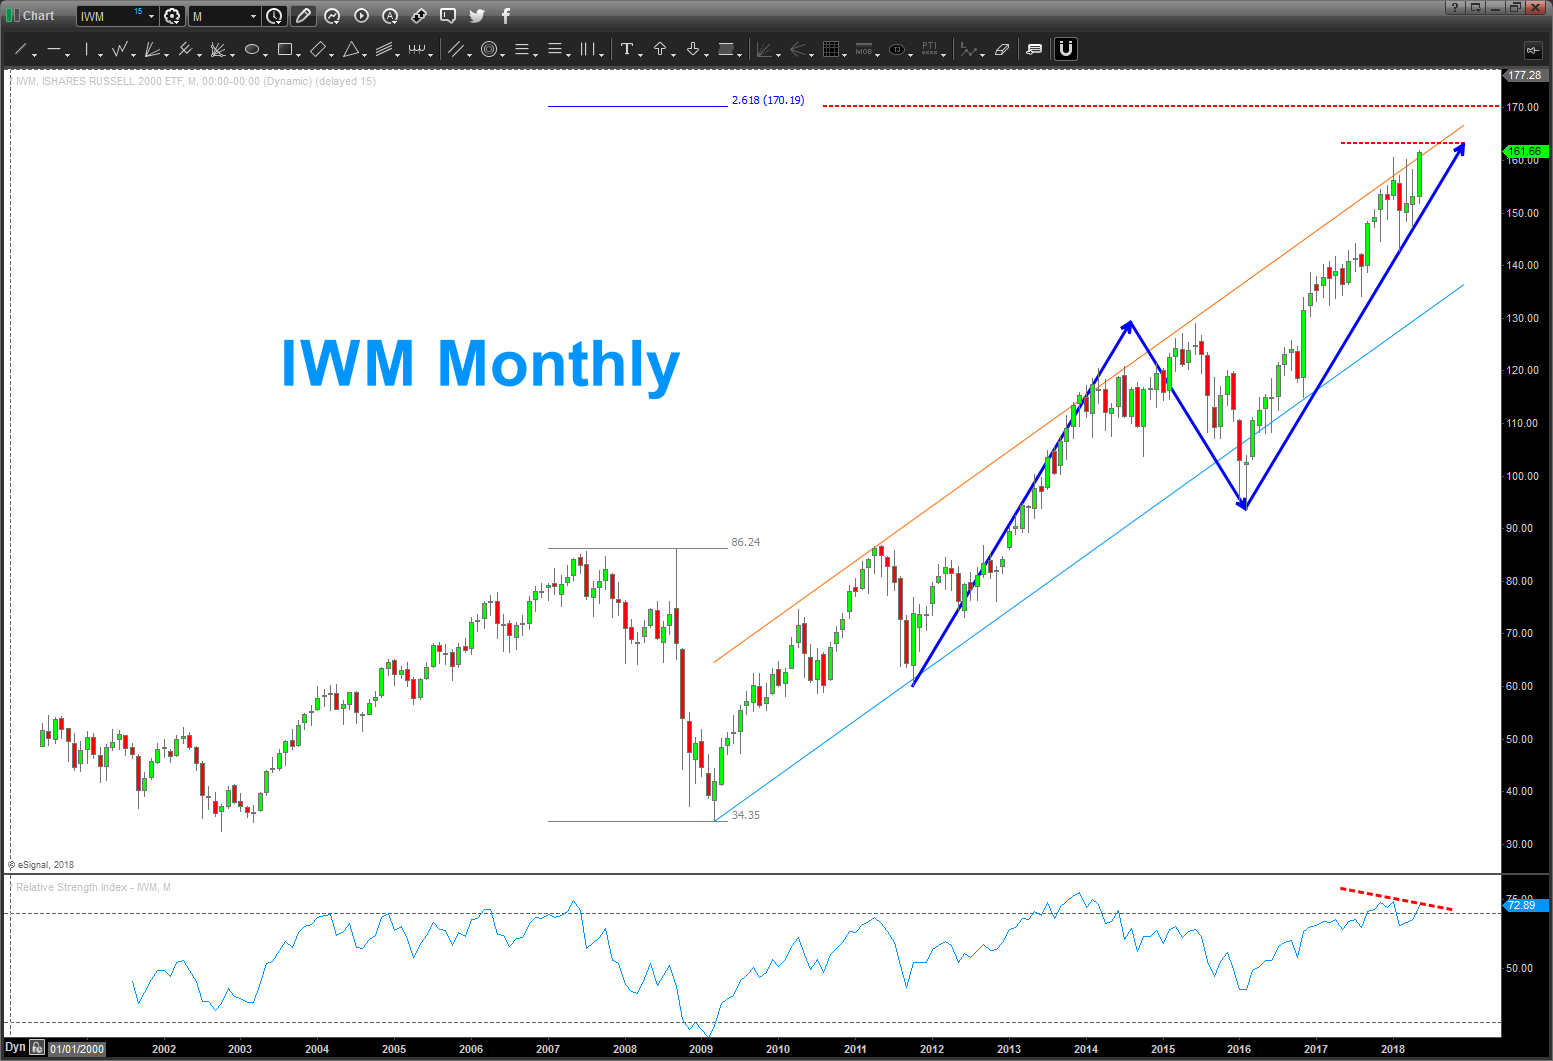
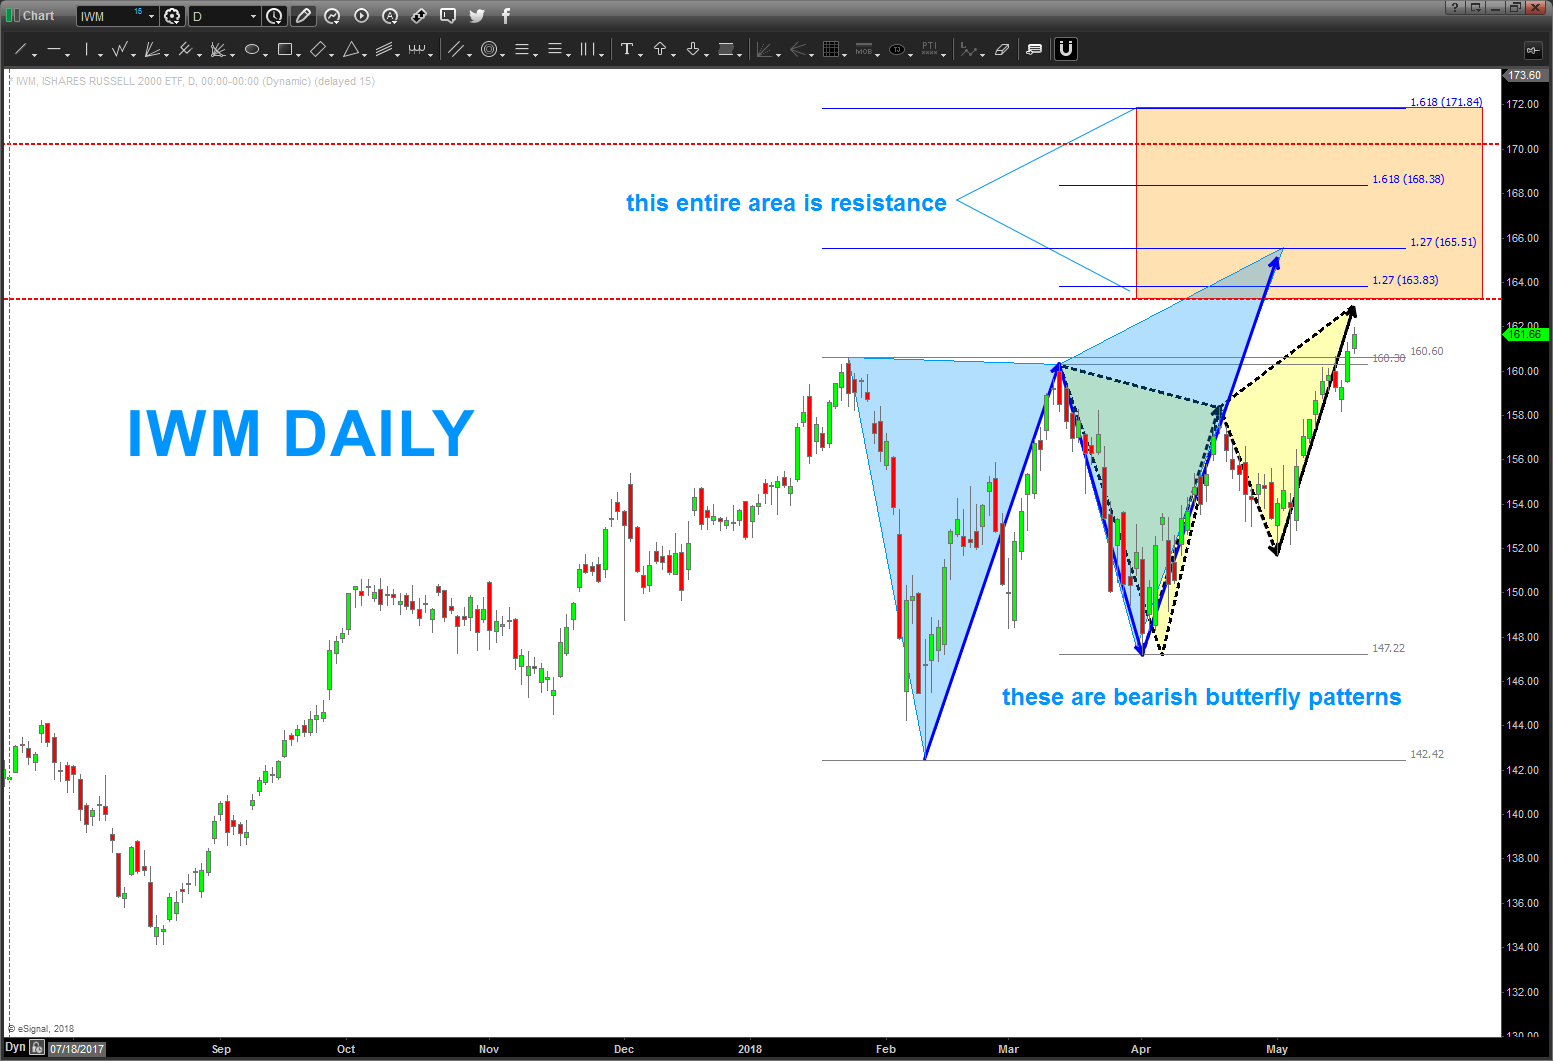
I’ve seen the very strong strength shown by IWM (ETF for Russell 2000) but I also see 5 waves and monthly bearish divergence. I’m not ‘sold’ on the bullish aspect of this ETF, yet. Let’s see how it deals w/ the 2 daily butterfly patterns (bearish) that are present right in the zone of the measured move shown on the monthly …
What I can say is that IF these patterns fail this puppy will, indeed, explode. But that monthly tells me … not so fast and be careful of the ‘no brainer’ trade being long IWM.
Bart
PS – for those of you who are geeks, like me, notice the close hovered around 161.80’s or the golden mean – 1.618. Note – our subconscious mind doesn’t worry about decimals points.
PS – 1.618 or 161.80 🙂

Pingback: IWM – update – Bart's Charts