Utilities
been working out Utilities: https://bartscharts.wordpress.com/2019/06/08/utilities-again-ugh/
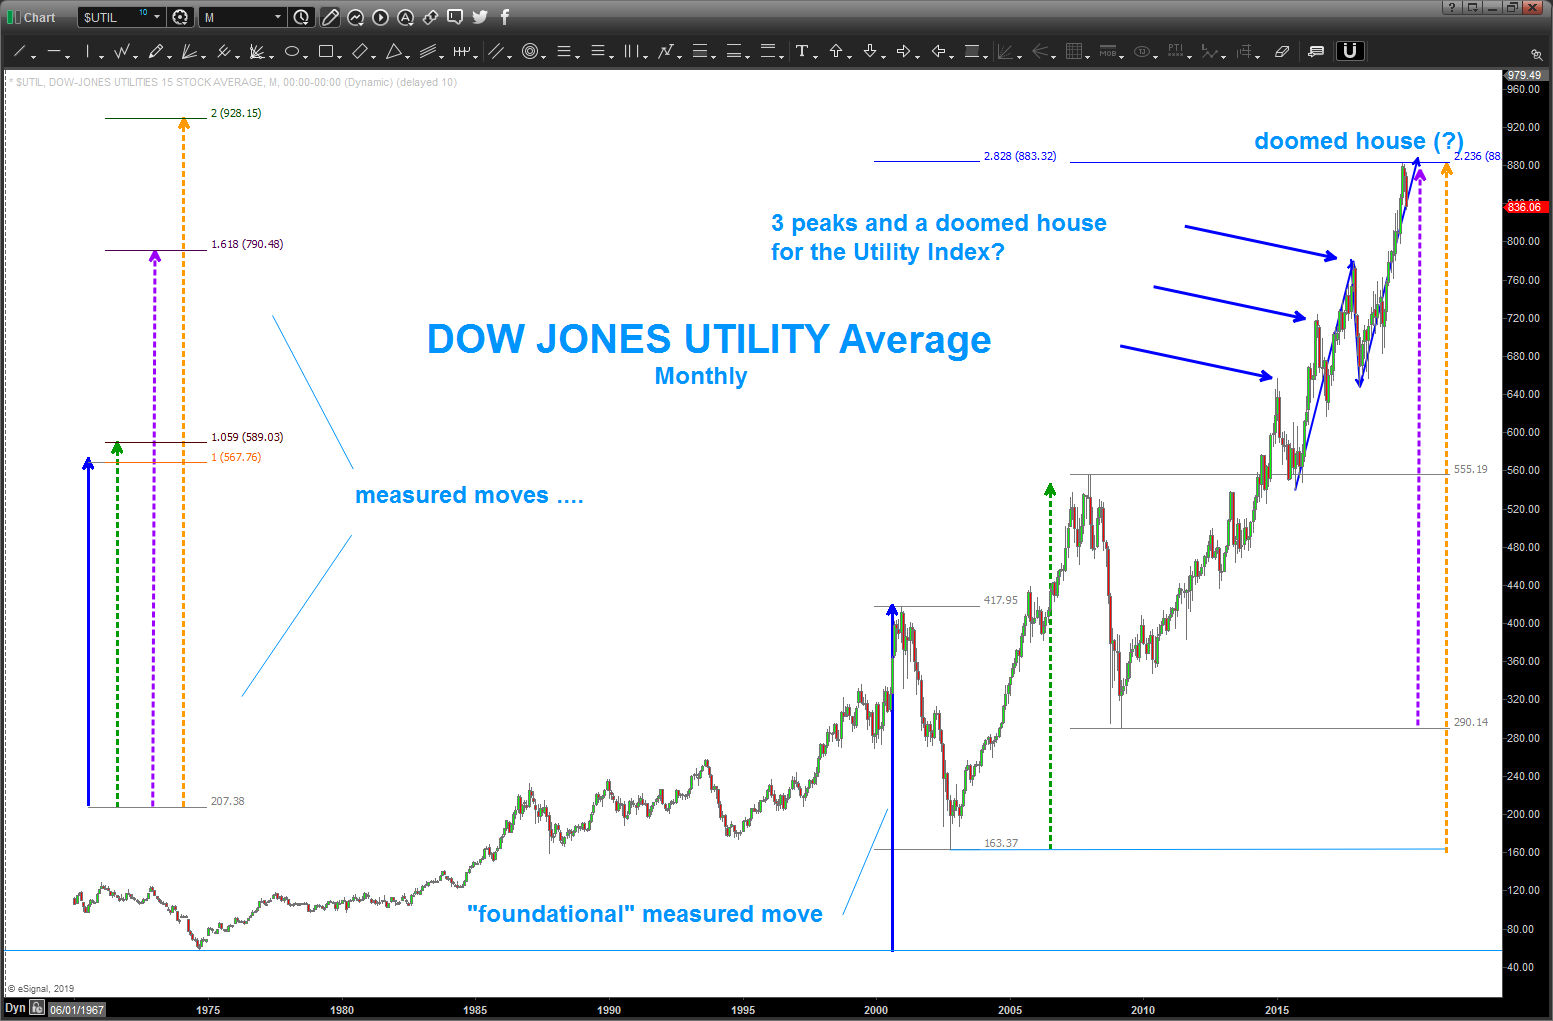
honestly, the strength is palpable and, knowing how much I trust measured moves, was somewhat ‘surprised’ at the lack of respect the Utility sector gave to the ‘math’ and PATTERNS.
so, were at a juncture, again. see the chart below … I did the “how to use what you learned in kindergarten to draw circles and one could make the case that they are not ‘parabolic’ yet.
as you can see, the blue arrows show a symmetrical 3 drives to a top w/ both price and time confluence. reacted a little and then blew right thru it .. failed pattern. now we see a 3 drives and a doomed house pattern … also, did some measured move math and we have the square root of 5 and the square root of 8 present at the high. that’s the math for the resistance ….
a weekly close below the 3rd high in/around 778 is key that we have reached an important high for now.
that being said, this is an important sector to watch for now.
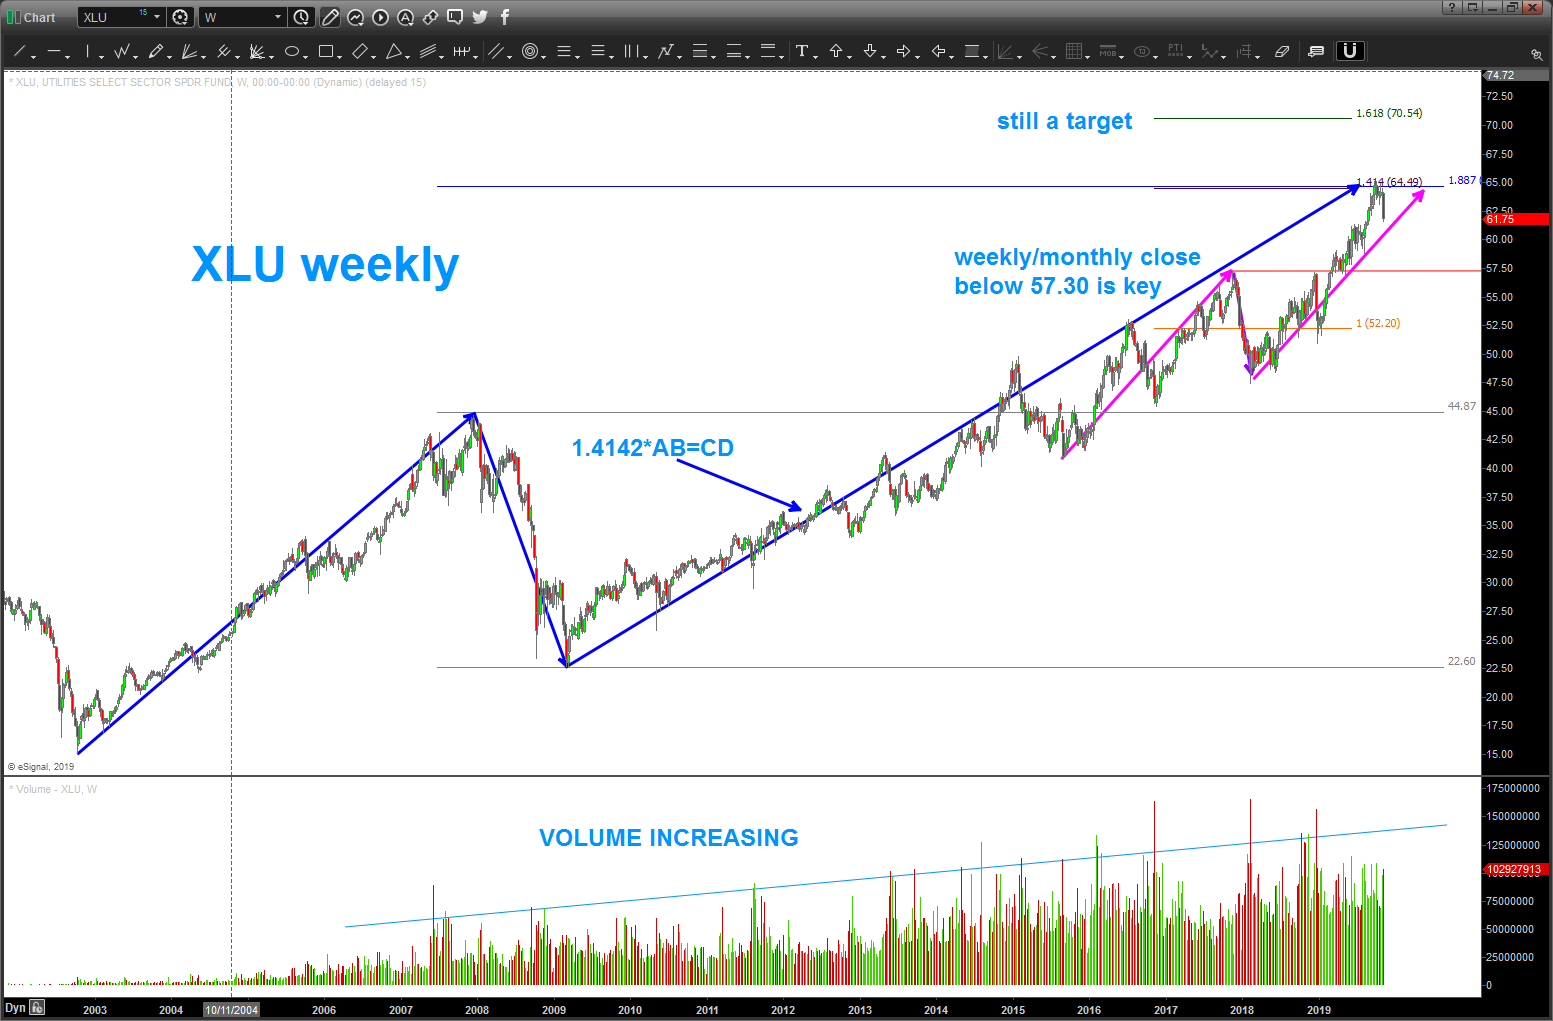
here’s a peak at XLU – ETF for utilities.

Pingback: Utilities – July 14, 2024 – Bart's Charts