the XLP / NASDAQ ratio complete a BUY pattern …updated 05/19/2019
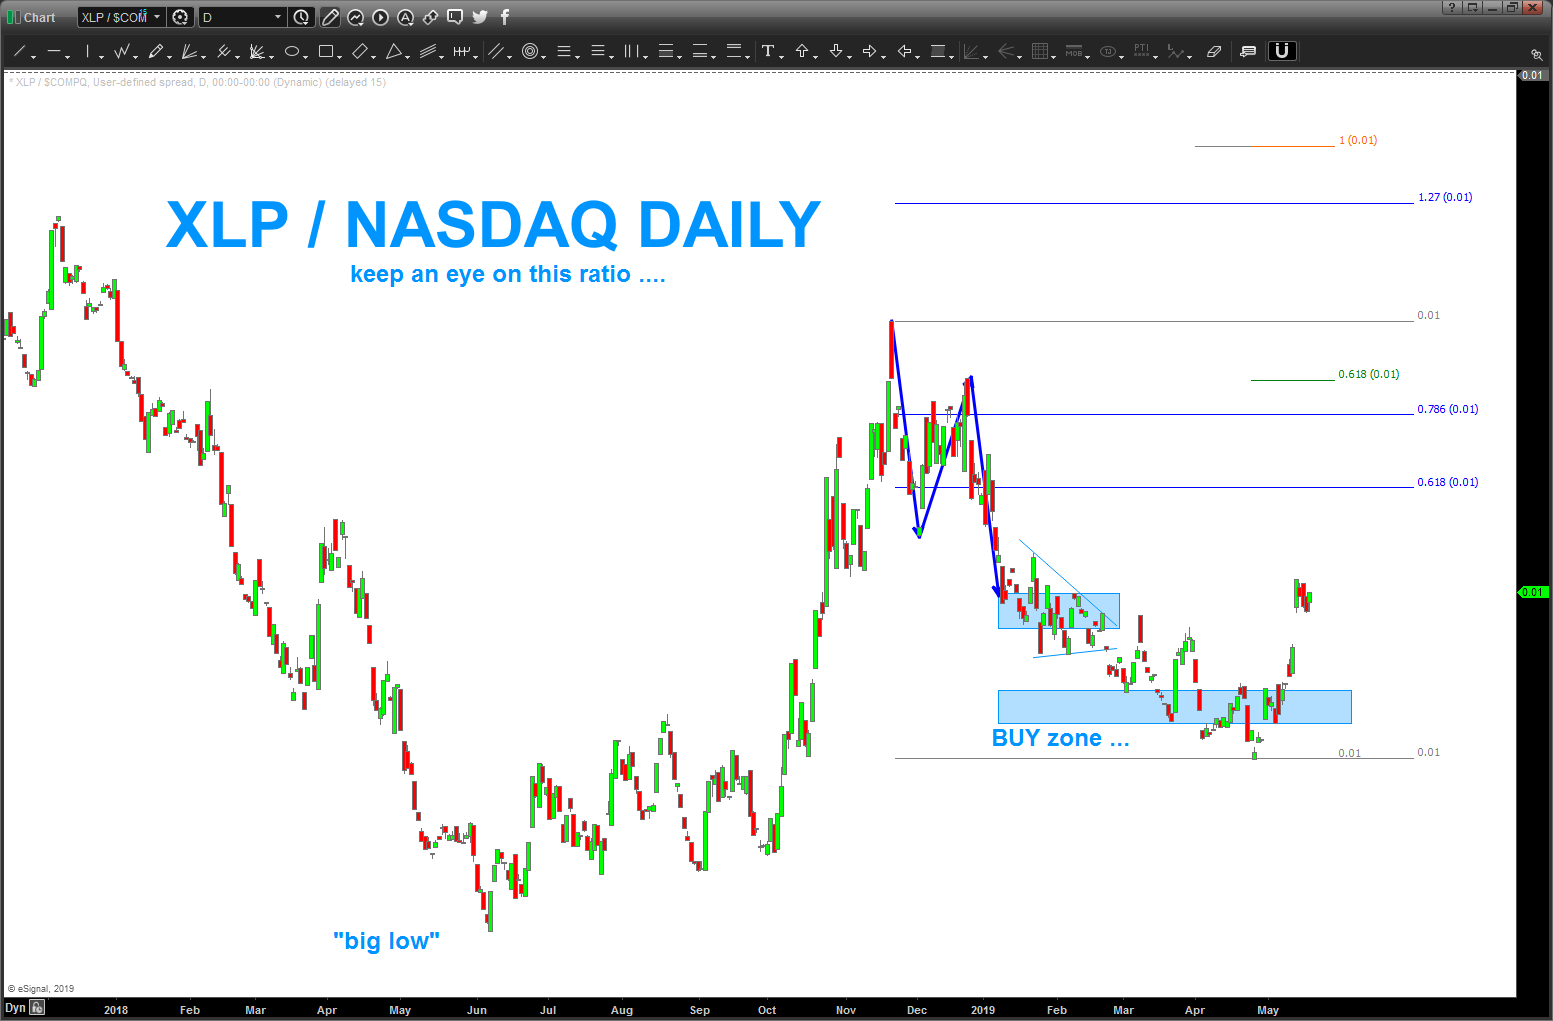
05/19/2019 as you can see below, the buy zone was defeated by just a bit but, ultimately, it proved to be good support and the ratio is going UP which shows a risk off mindset w/ regards to the institutions. keep an eye on this ratio as it’s very important and can give us a heads up w/ regard to the overall health of the market.
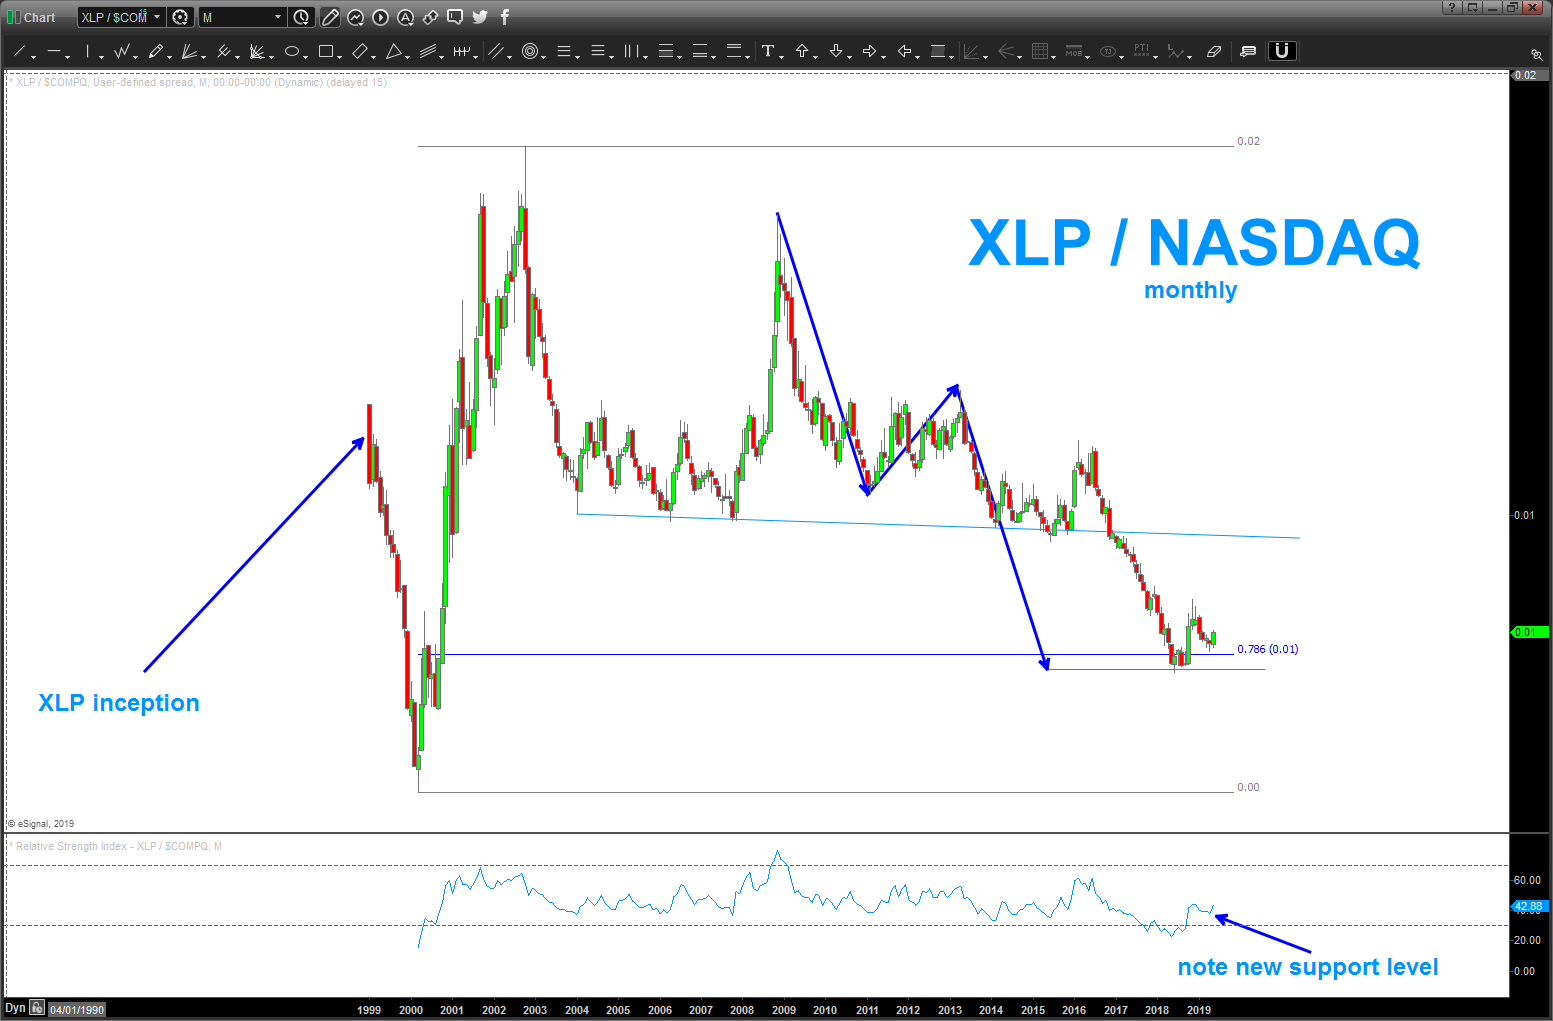
I put the MONTHLY chart in there to show the much bigger pattern that completed at the lows.
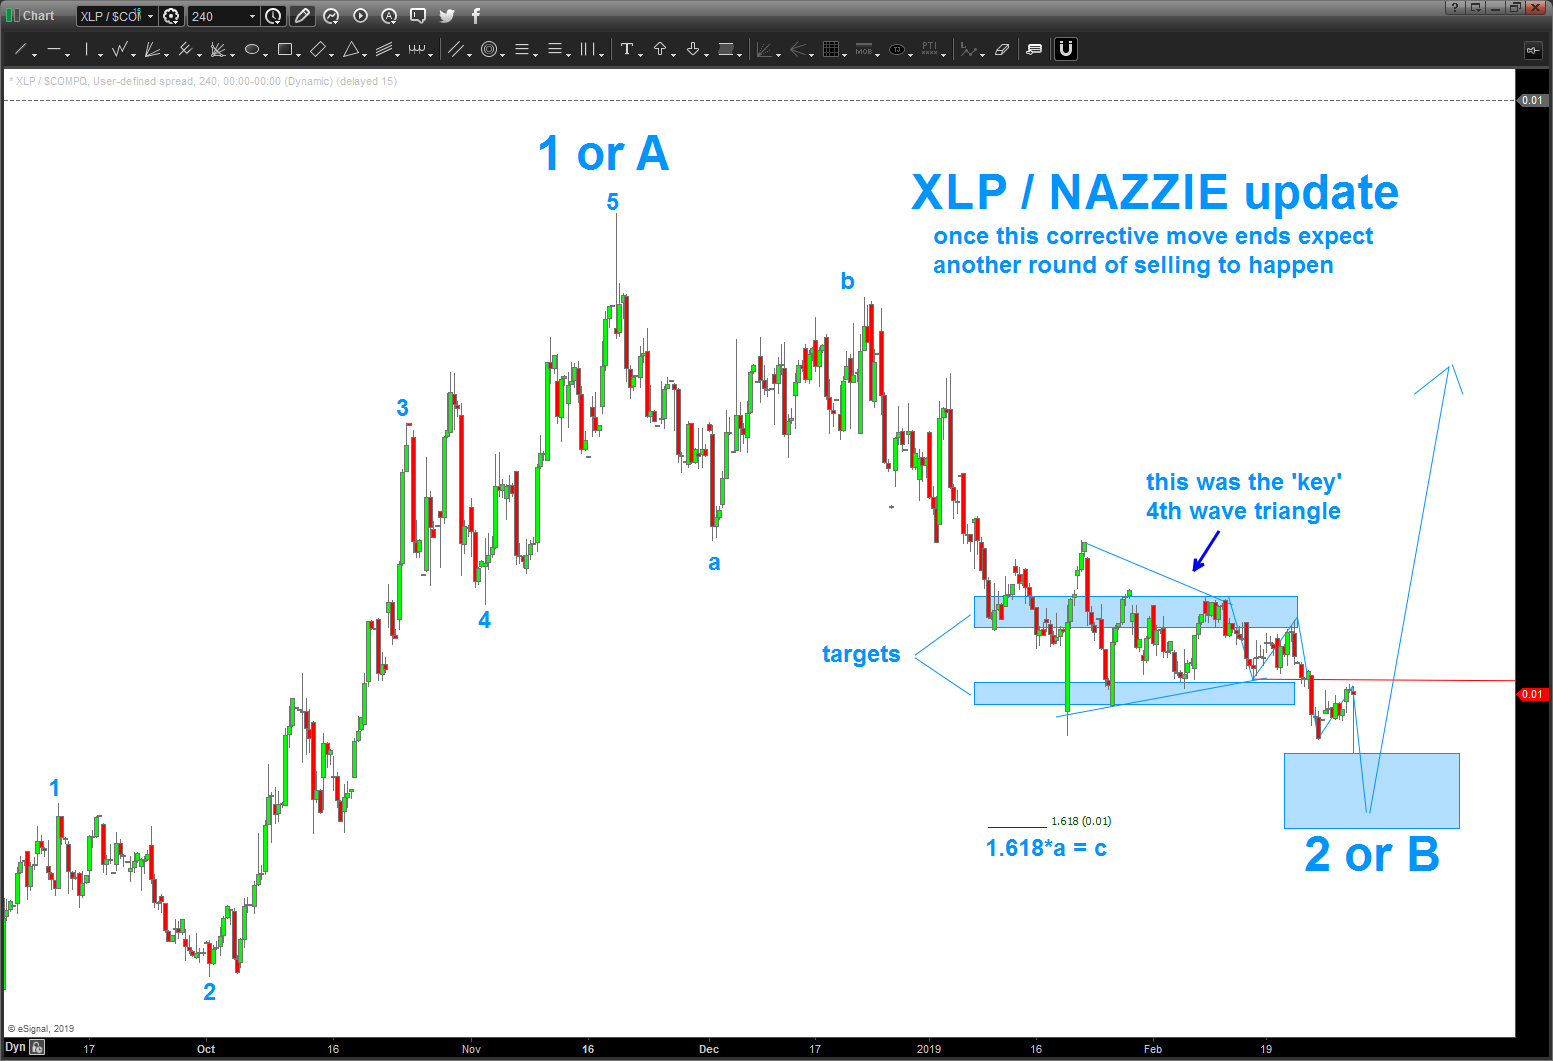
02/28/2019 update: well, the target area shown in the original post was shown and held, somewhat. as the bouncing around started to happen from January 22, 2019 till Feb 21, 2019 it certainly created a nice triangle from the classic EWT. a-b-c-d-e and a resumption of the downtrend. We have rallied a little bit after the breakdown from the triangle (they usually occur in 4th waves – a guideline NOT a rule) so we have either finished or have one more sequence lower to finish – what I believe to be a zig-zag like correction.
if this analysis is correct, then we will bottom NOW or a little lower and the ratio will start to rise.
what does that mean? it USUALLY means stocks will start to sell off.
we are at a key/crucial juncture ..charts below
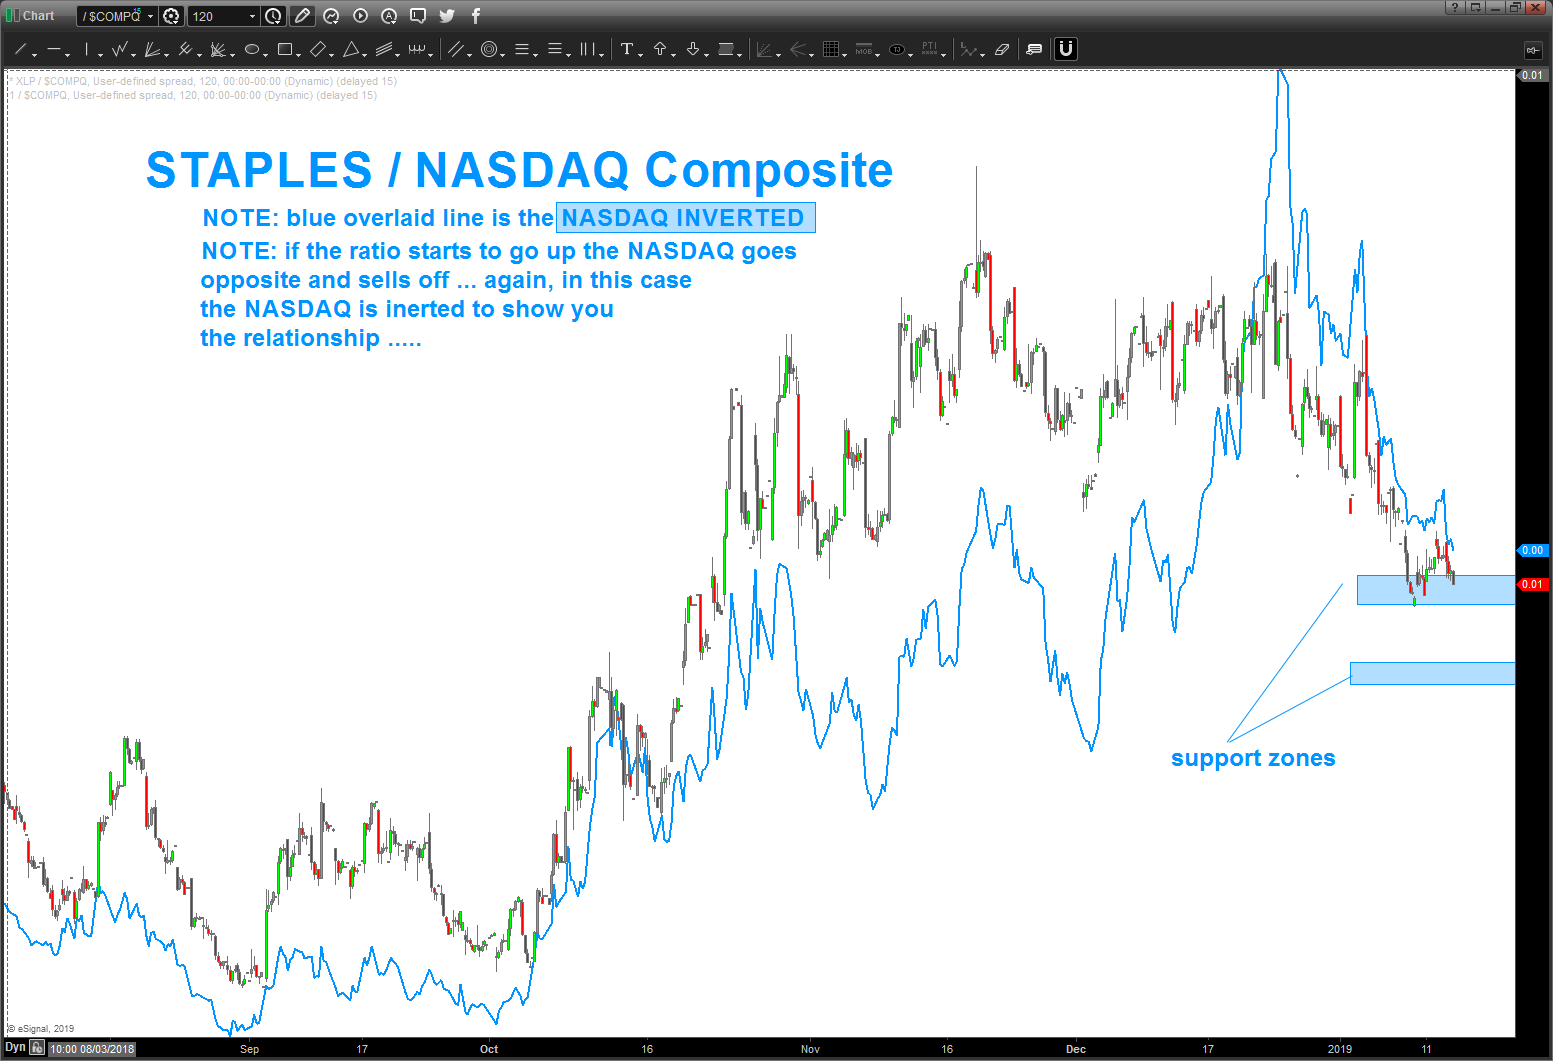
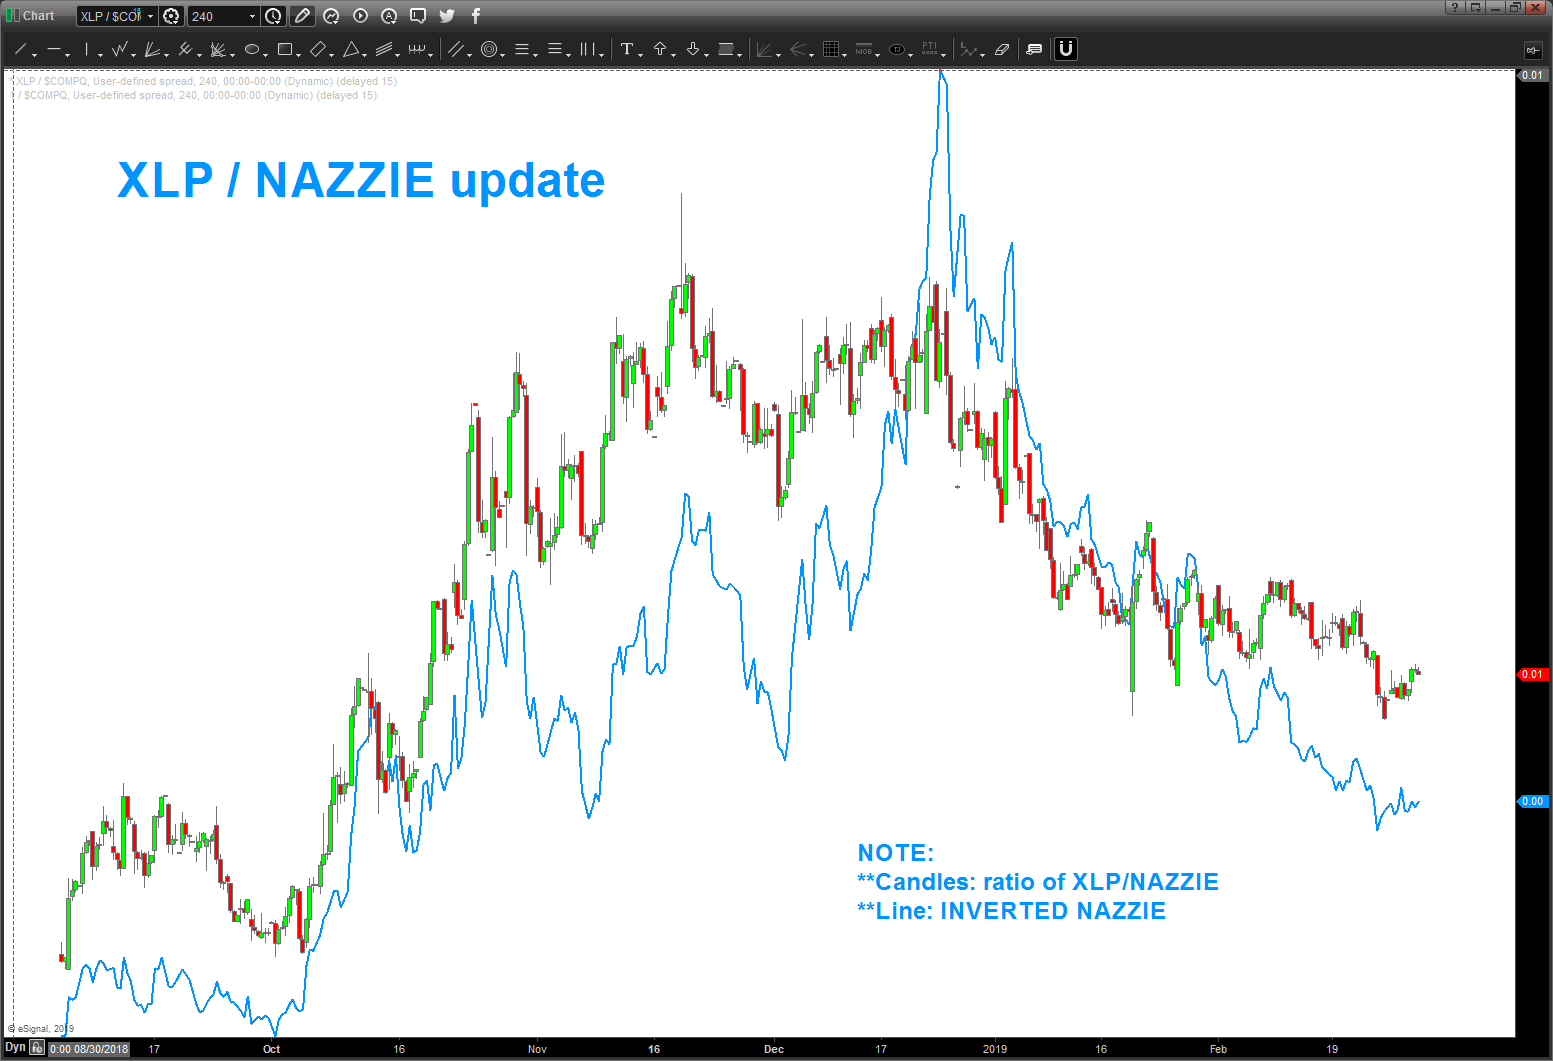
to show you the ‘power’ of this ratio, I’ve updated a 4 hour intraday chart of the xlp/nazzie ratio (candles) and the nazzie INVERTED (blue line) to show the synchronicity and how well they shake and jive together. note: every inflection point is timed almost exactly. THAT IS WHY THIS RATIO IS SO KEY and HELPS WITH RISK CONTROL
____________________________________________________________________________________________________________________________________________________________
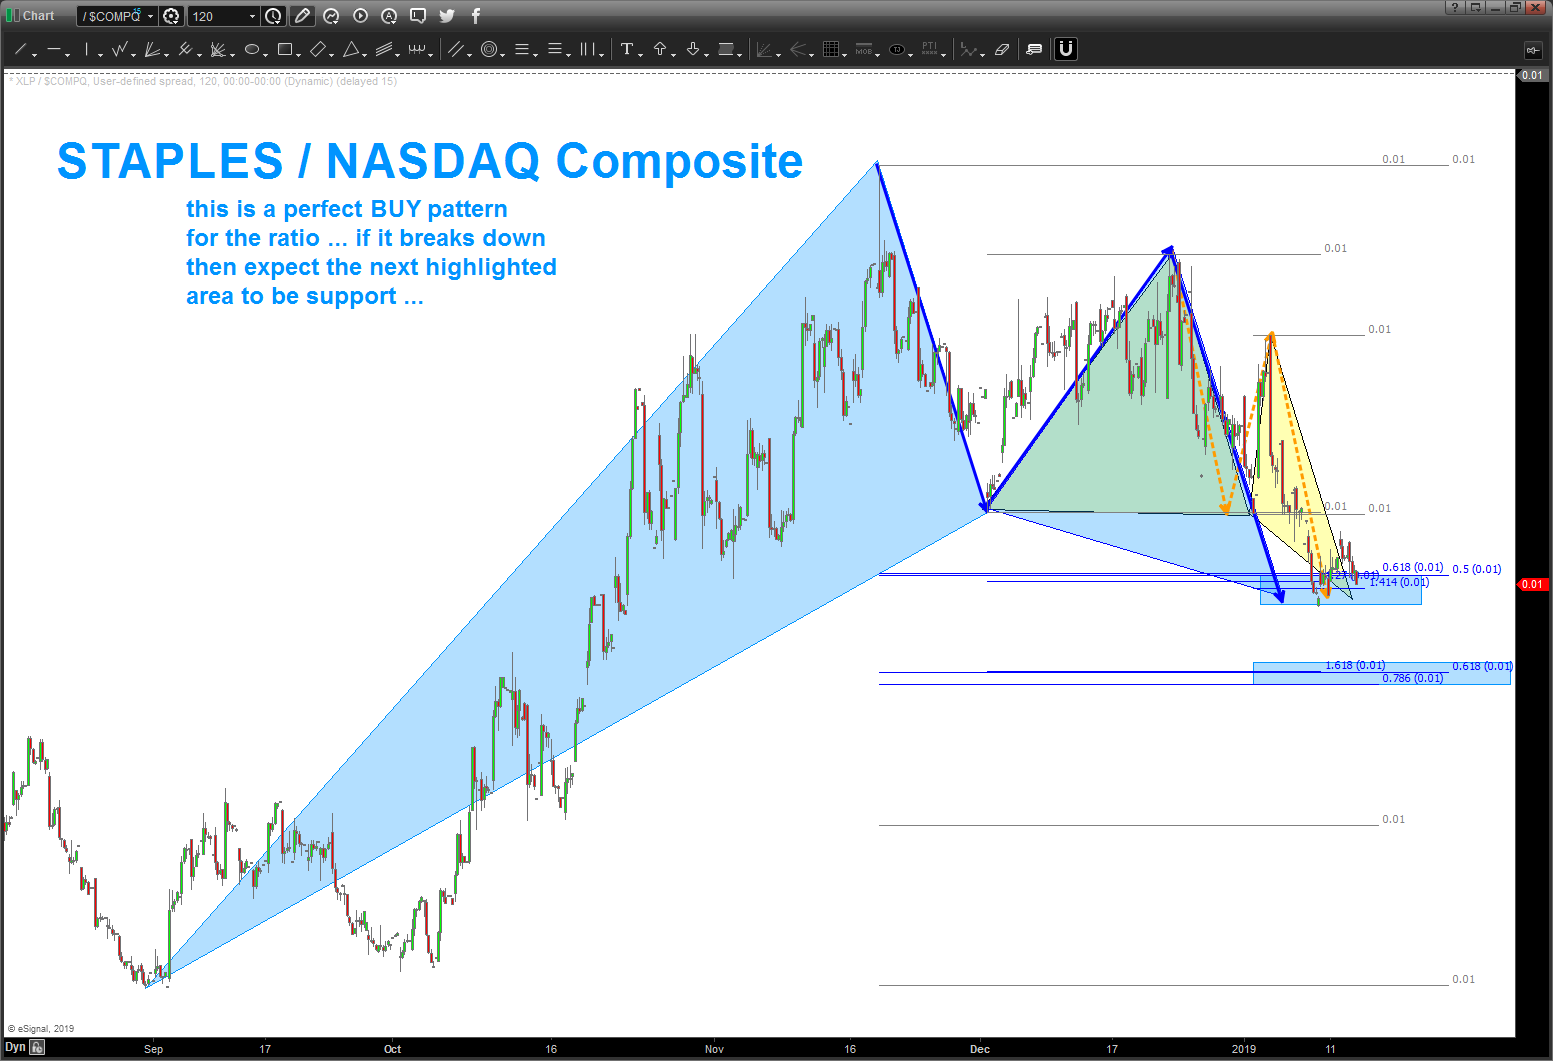
if you have been following me for a while you will know that I really trust PATTERNS and also ratio’s w/ the patterns.
in this case, we have a near PERFECT BUY pattern on our XLP/NASDAQ ratio. Which means, the Staples (a source of risk off for the institutions) ‘should’ start outperforming the NASDAQ from a relative strength basis which ‘should’ cause the NASDAQ to sell off .. IF and ONLY IF the PATTERN works. As you can see below, we have two levels to watch (the one we are at right now) and then one a little bit lower …
my guess (as I NEVER know which pattern will or won’t work) is that the next sell off will occur ‘here’ or the other target a little lower. if we blow thru them w/ power and they fail then it might be game on again .. but let’s not get too hopeful yet. let’s see what our patterns do on the ratio first …
Bart