Natural Gas Part II-February 24, 2023
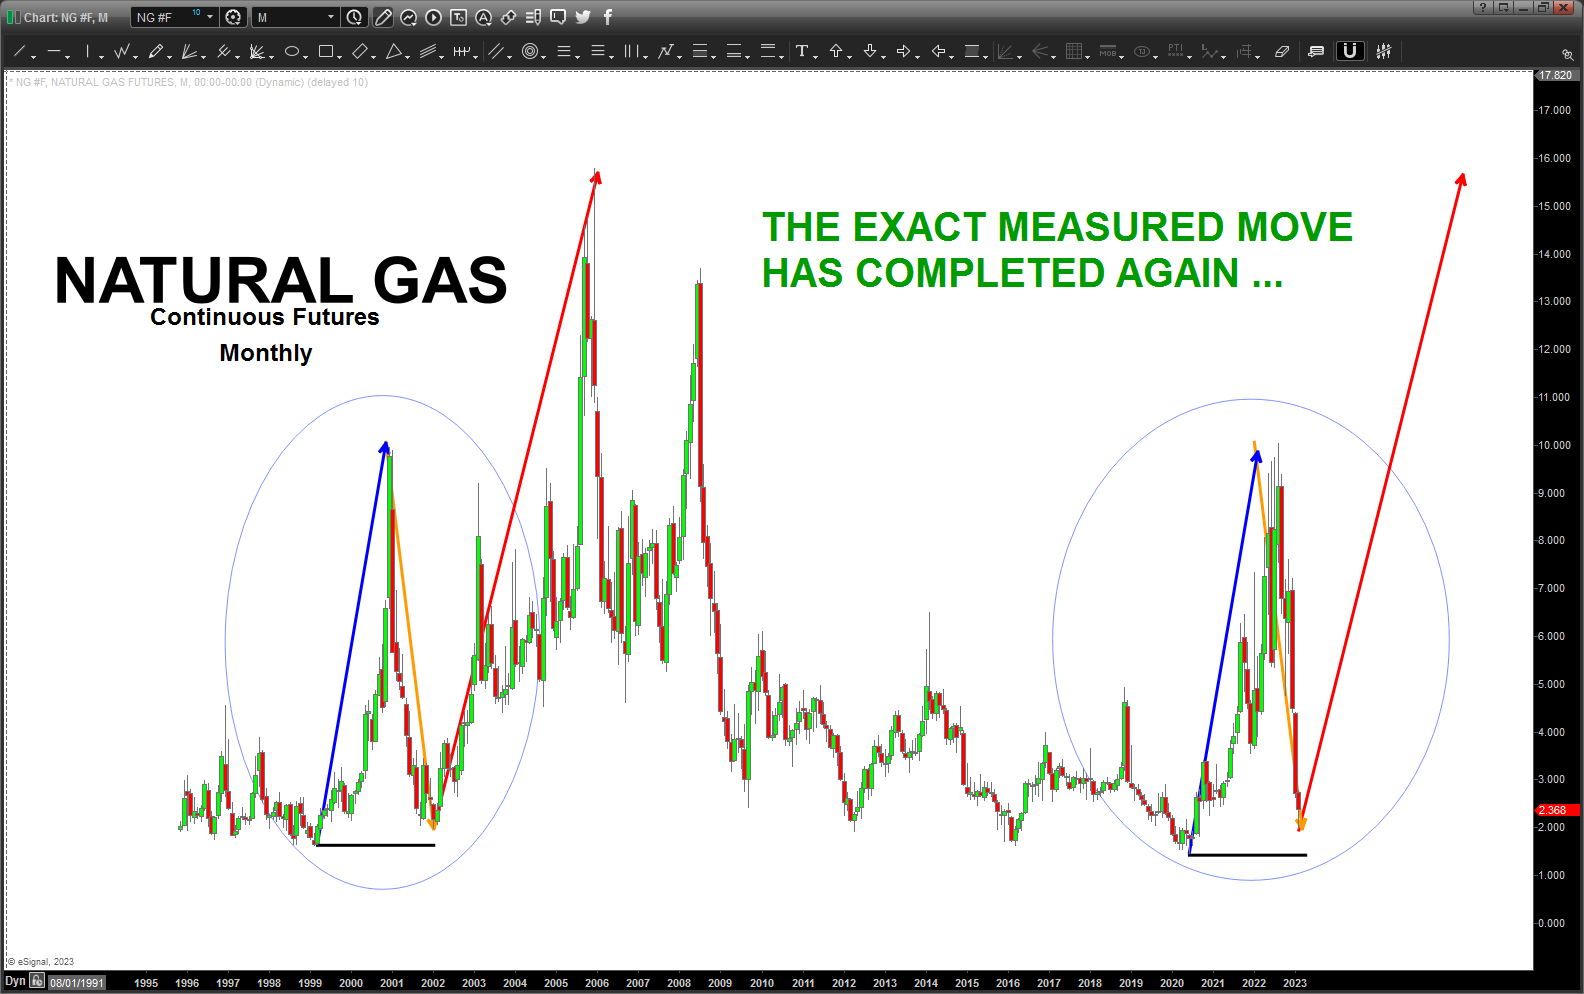
This morning I posted the “measured move” on the Continuous Contract Nat Gas Futures from a monthly scale.
Here is the link: https://atomic-temporary-44460632.wpcomstaging.com/2023/02/24/natural-gas-february-24-2023/
Measured Moves are the most underutilized YET most POWERFUL tool in our toolbox. I think people don’t use them because they clutter their charts w/ lagging, coincident indicators … moving averages, bollinger bands, oscillators, and 1000’s of other tools. Do they work? SURE .. but, just think about it, ALL of the techniques and tools we use as chartists (even the esoteric stuff) is all contained in what? THE MEASURED MOVE.
This measured move is so nice BECAUSE it’s EXACT in both PRICE and TIME.
Add that to the count shown and the PATTERN present we have a very high probability trade. Right now, we are only risking a dollar. Trust me, we have time get into this move but the longer you wait, the more your risk will increase.
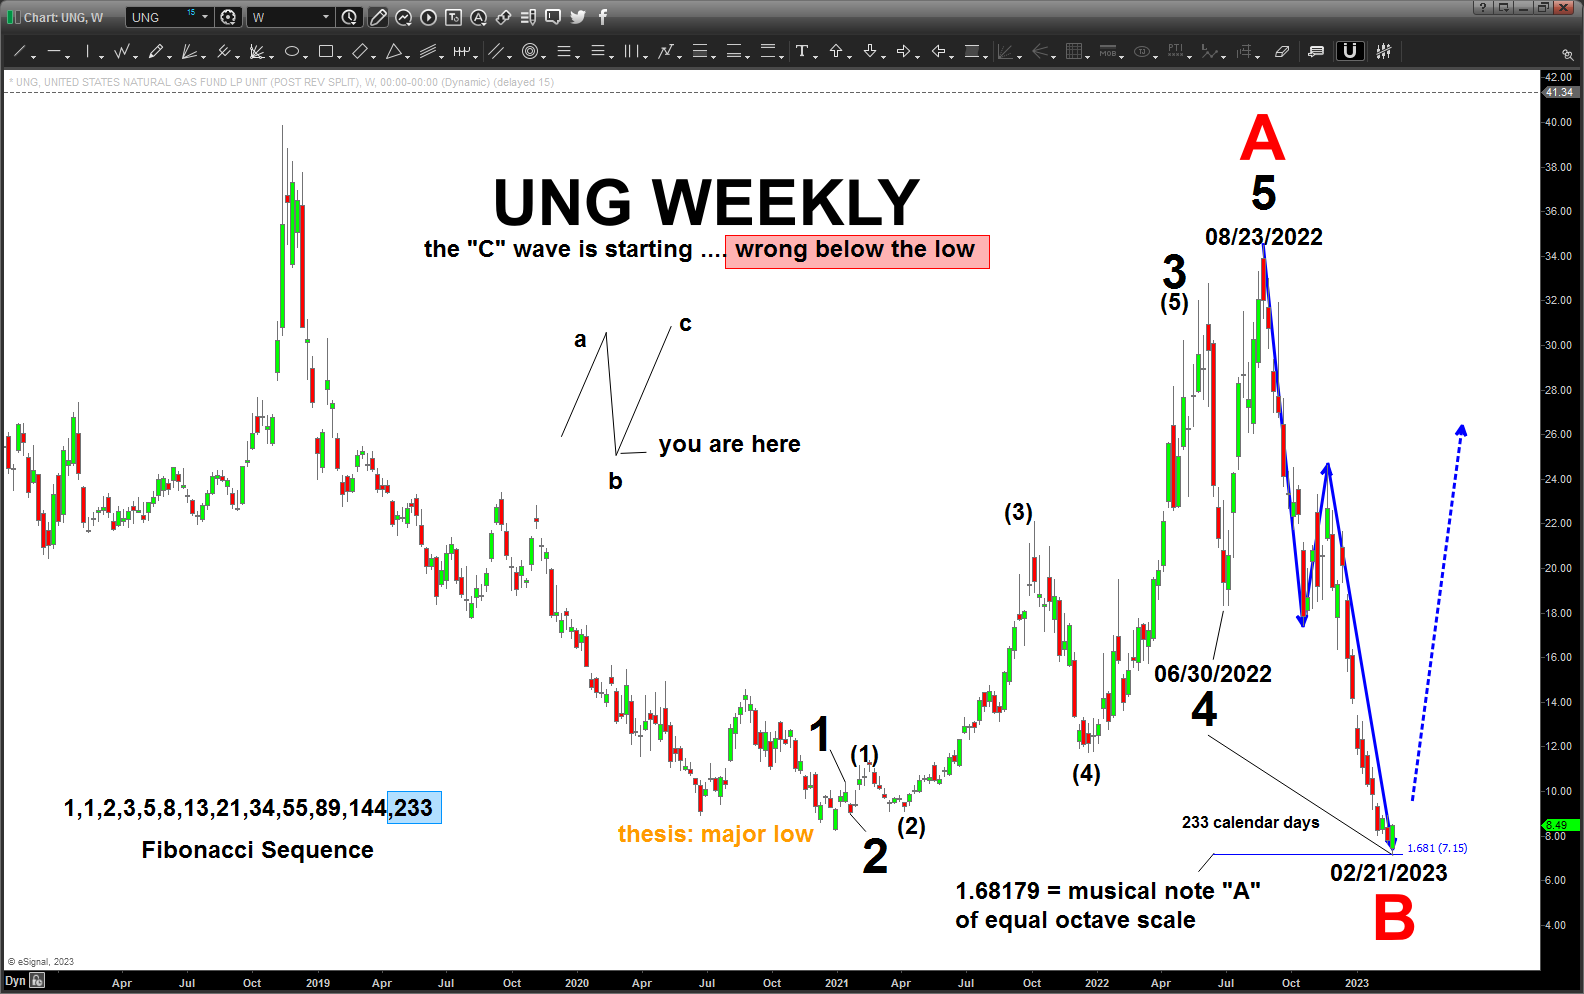
This analysis is wrong and would stop out with a WEEKLY close below 7.00.
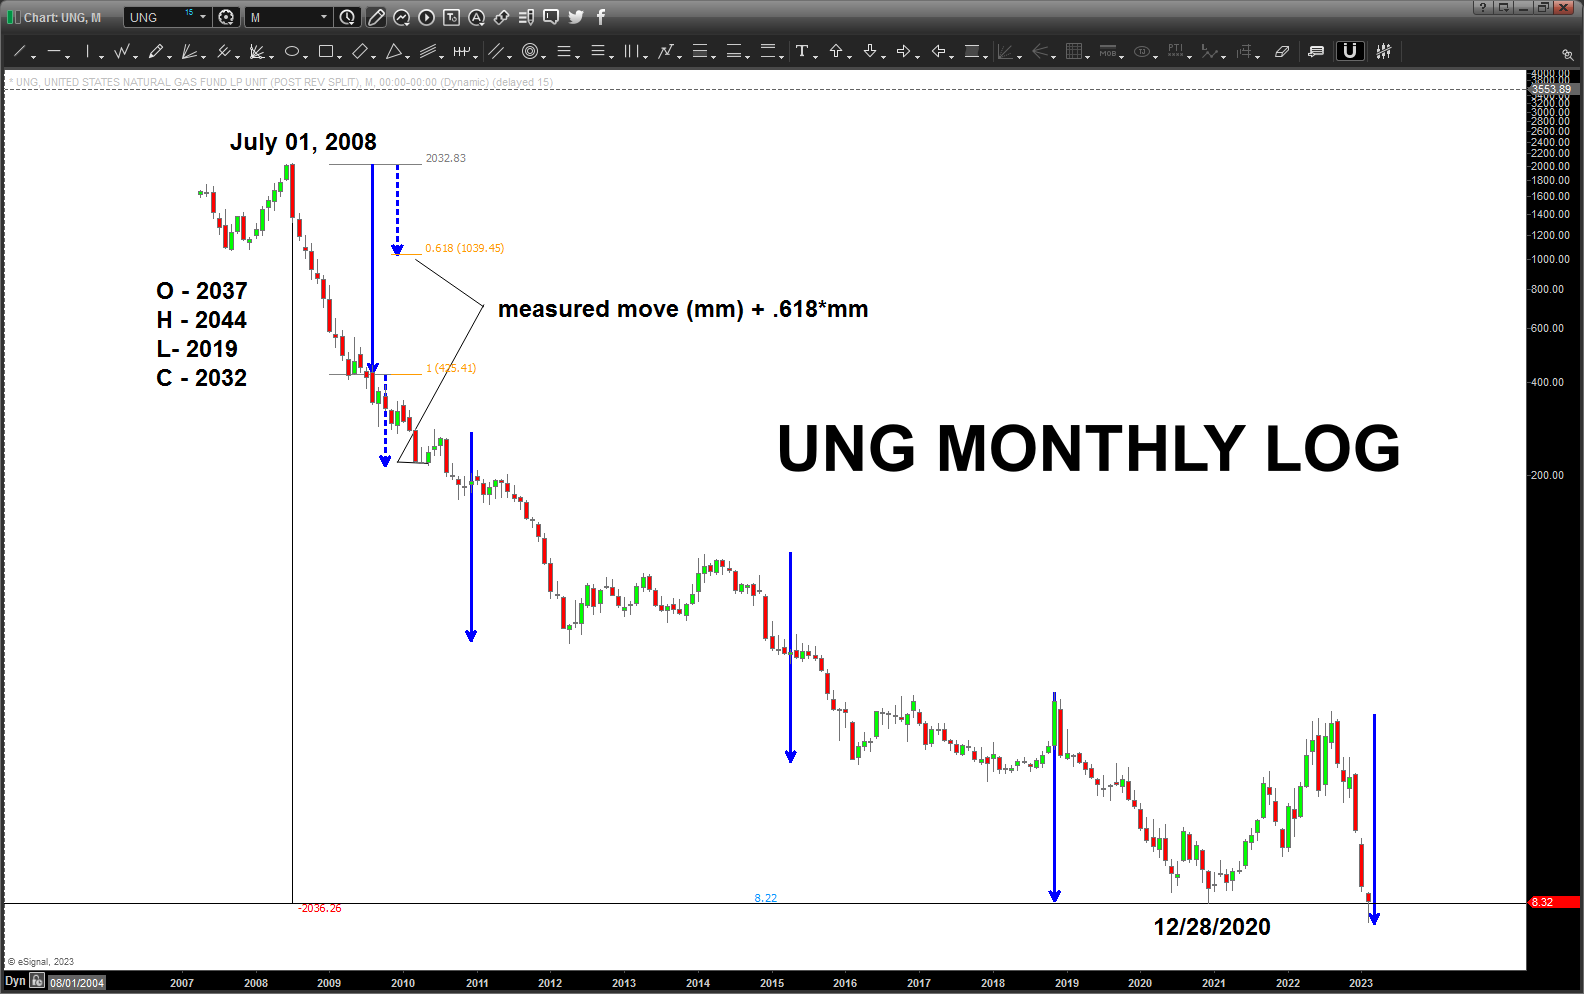
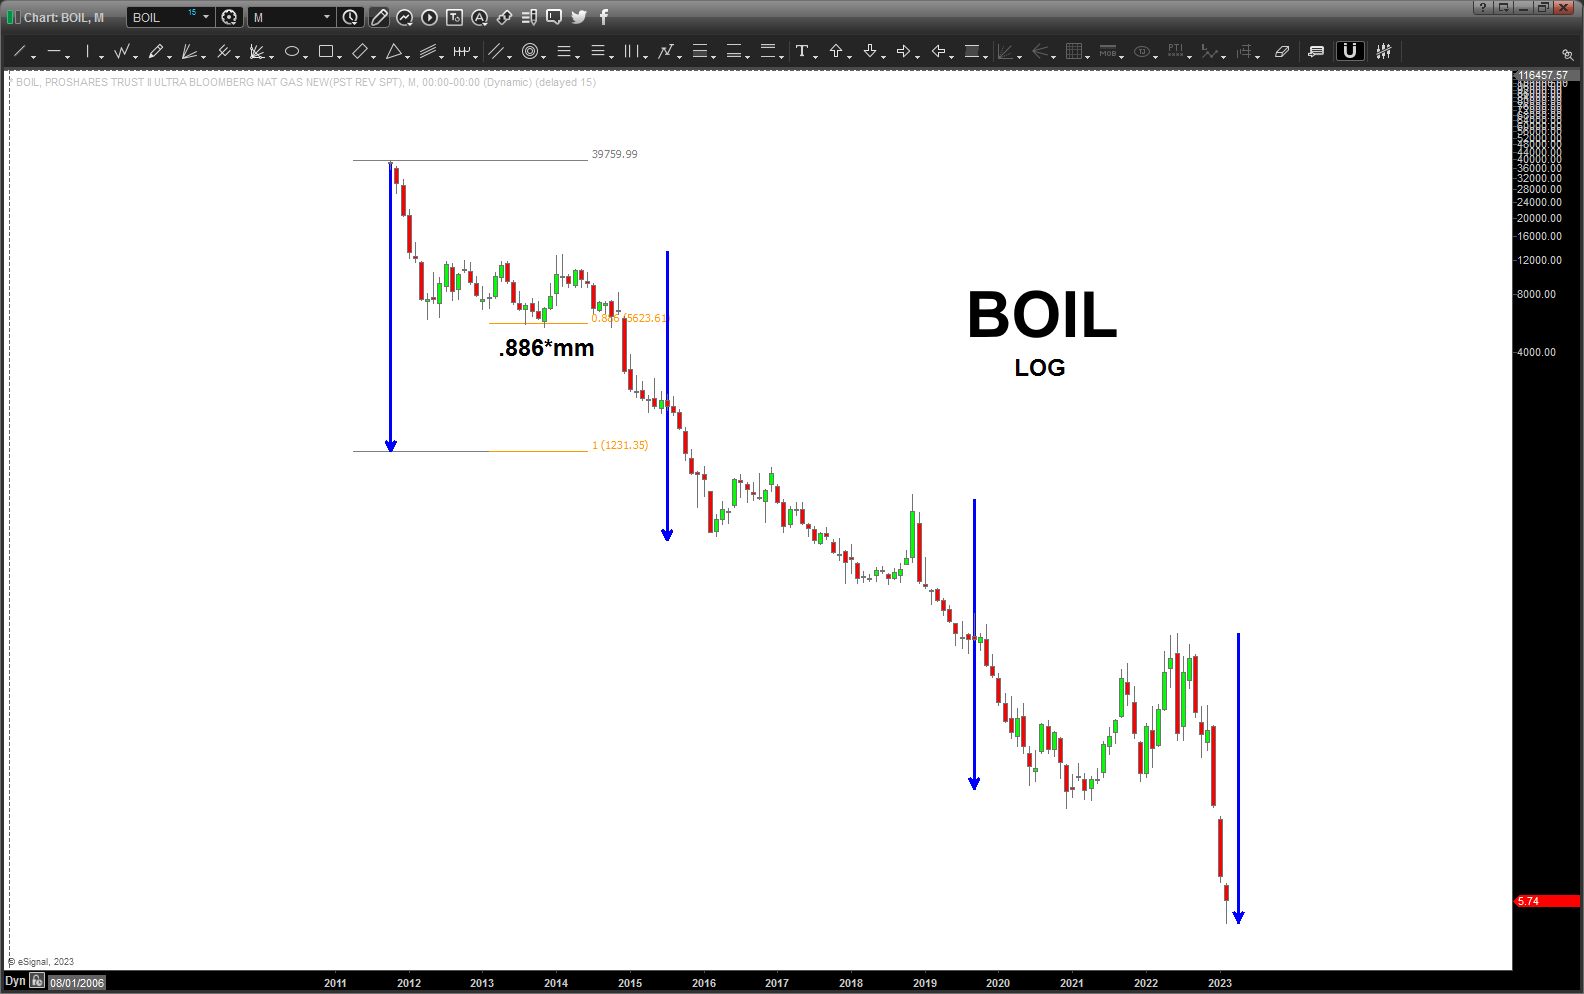
Other “proxies” are showing amazing measured move synergy … in this case, from a percentage perspective using log scale.
Here is the “final” count I’m going w/ in regard to UNG.
Let’s add this up …
- Futures contract measured move – exact from a MONTHLY SCALE
- UNG and BOIL percentage measured moves – exact
- The 1.68179 extension hit after 233 calendar days … a Fibonacci harmonic
- ABCD hit as the same TIME the extension pattern hit
- The “count” on the way up violates no rules …
- Note, because the all time low clearly went thru the prior low we CANNOT label this as wave 2. The form/structure sure looks like a “B” wave …
Net-Net … this has all the markings of a VERY powerful beginning of a 2+ year move and right now the risk reward is 35:1.
Why not give it a shot?

Last week UNG was: 13 weeks from Nov high, 34 weeks from Jul low, time from Nov high was 162% of Aug high to Oct low & 262% of Oct low to Nov high,
Pingback: UNG – March 13, 2023 (update) – Bart's Charts
Pingback: Natural Gas/UNG – March 20, 2023 – Bart's Charts