Bonds – July 30, 2026

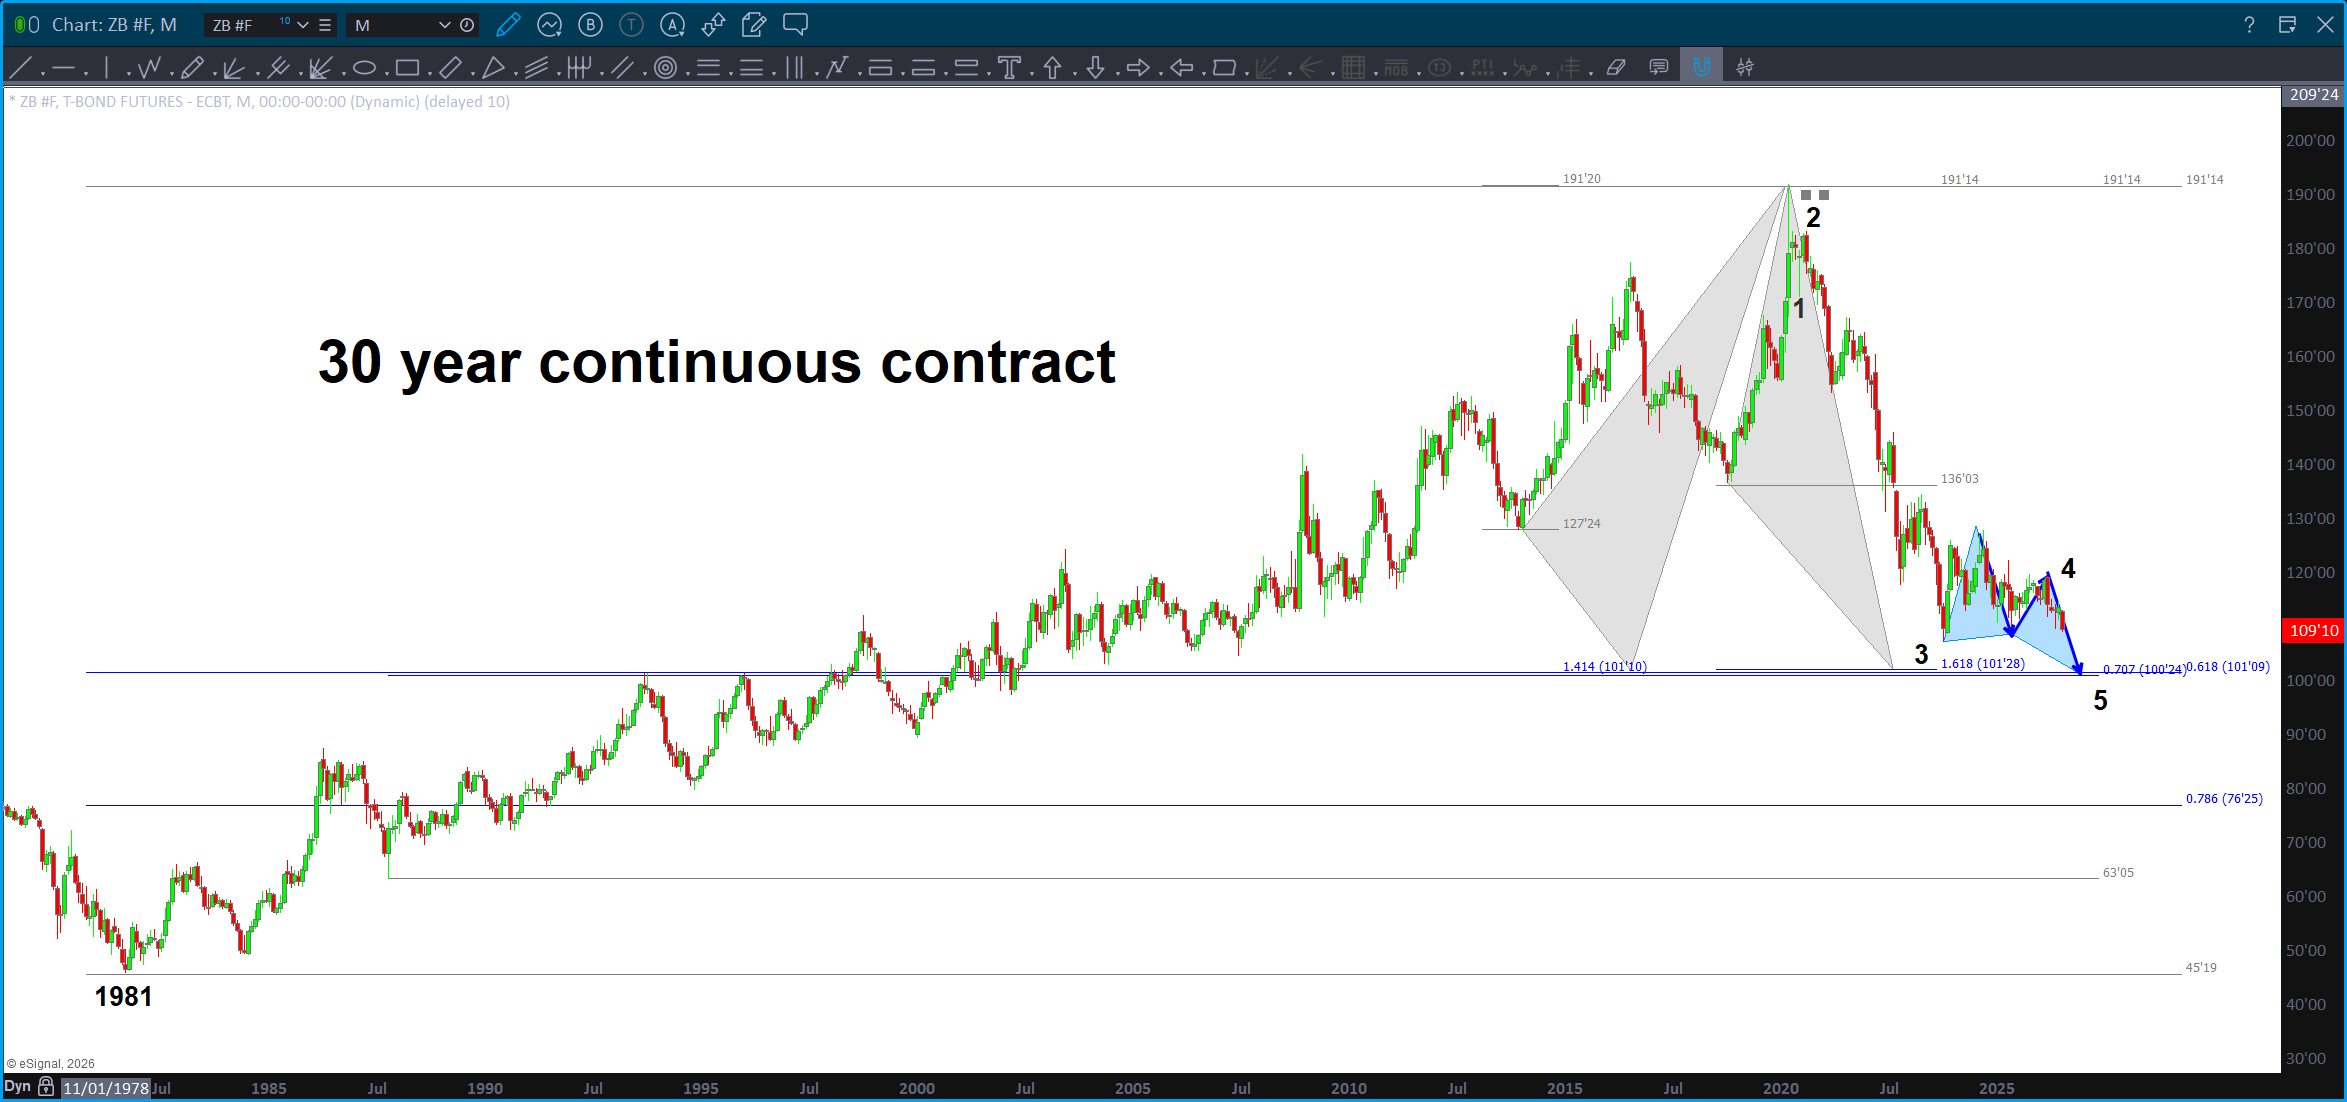
Expect interest rates to continue to rise … they are barreling towards huge resistance on the 10 year around 6 percent and monster support on the long bond around 100-101. I am expecting a good multi month if not multi year – bounce. Yes, only a bounce in bonds but should be a good one after being down for 6 years.

the Ratio – July 29, 2026
I’ve decided to check in on the XLP/NYA and let it guide our way … hopefully this will answer any question on what is ahead and provide strategies to manage risk and profit.
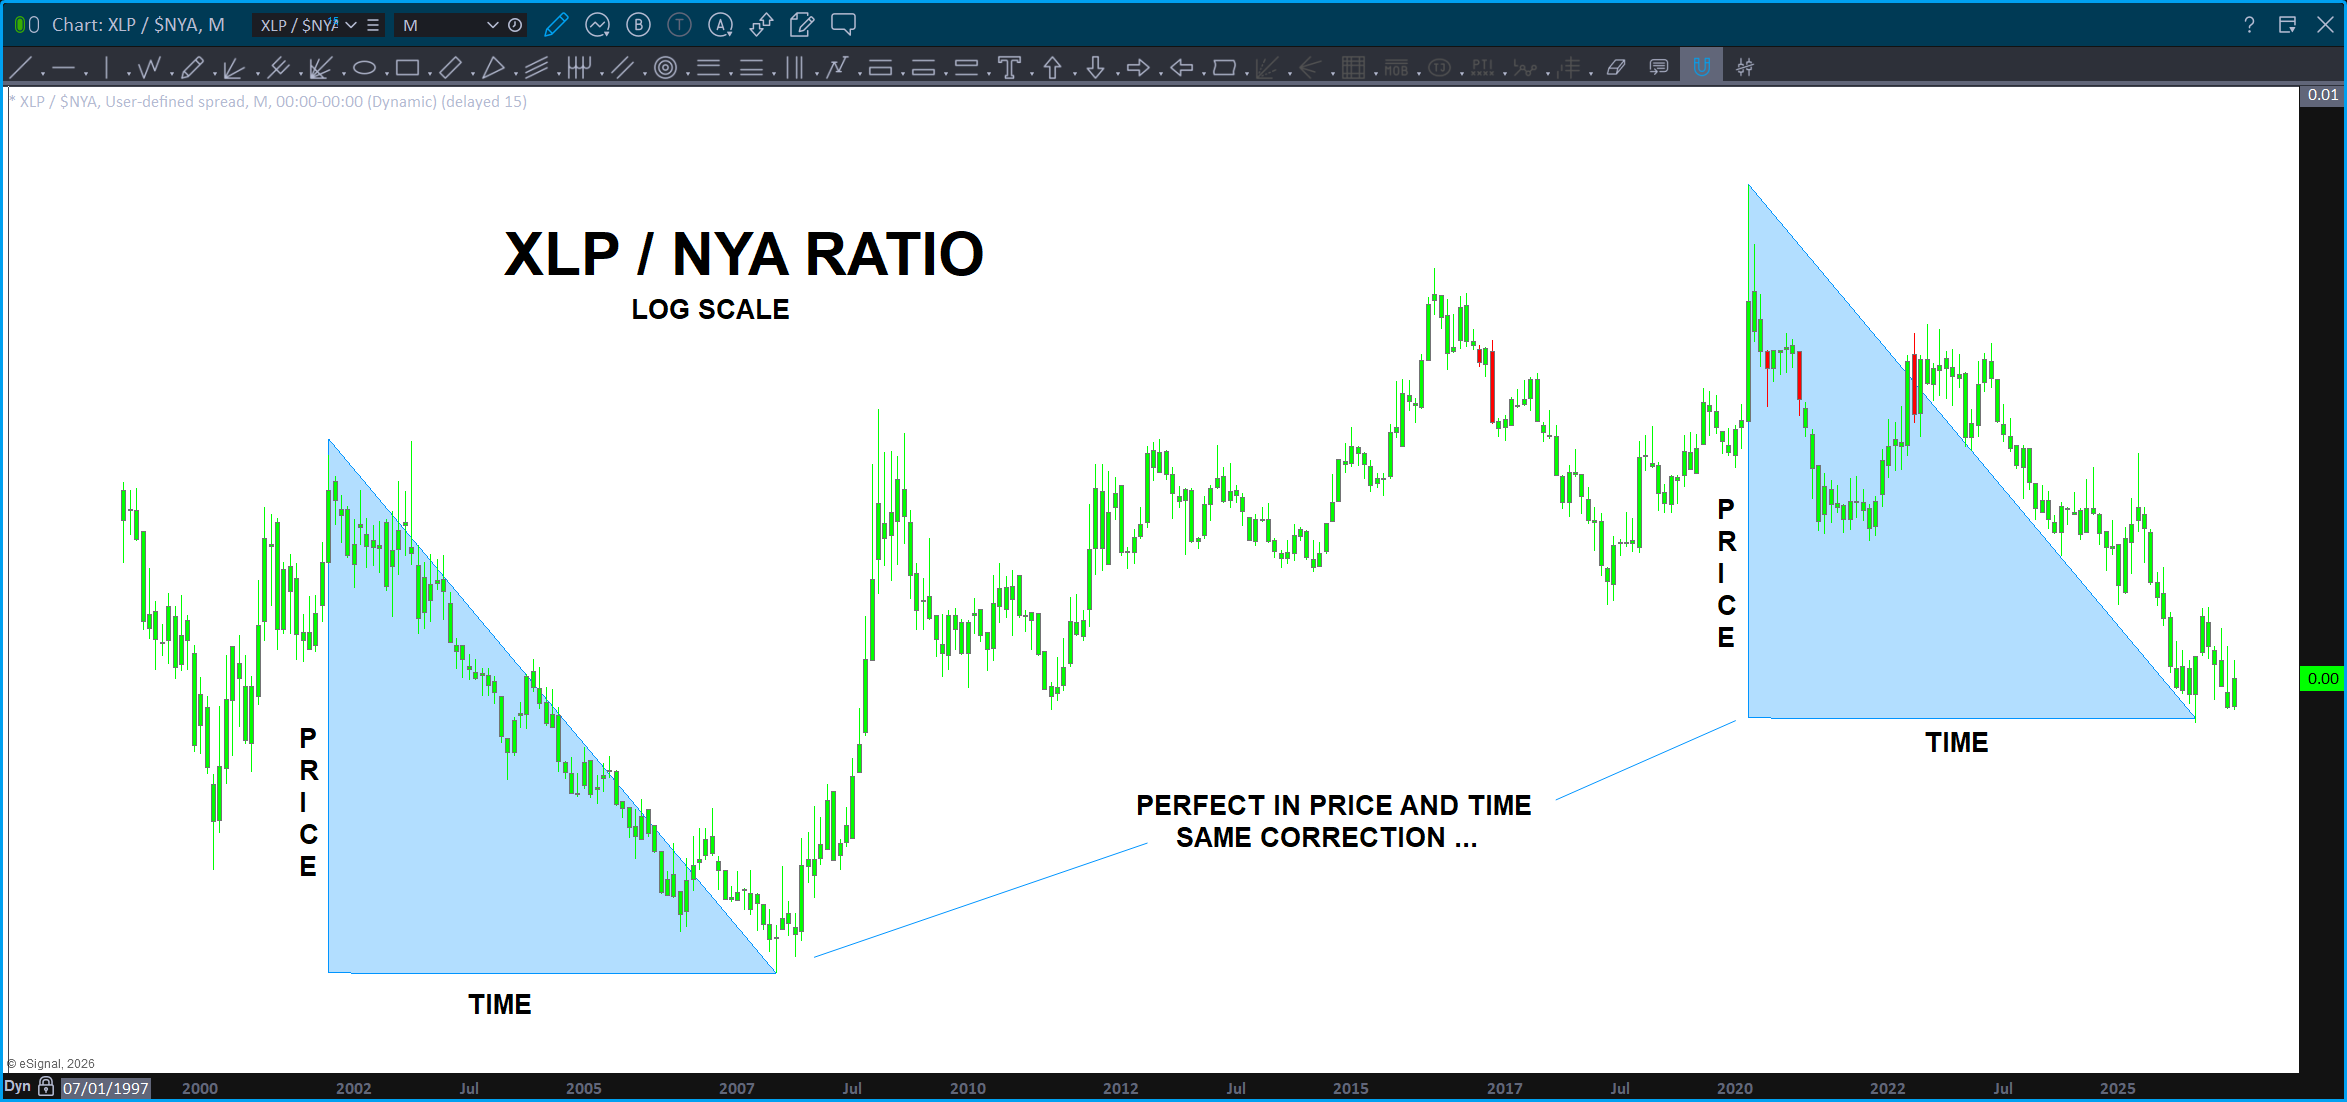
I truly live and die by the XLP/NYA ratio. It’s a ‘near perfect’ indicator of real-time institutional mindset – are they risk on or risk off? I use the NYA (NYSE Composite Index) because its big and isn’t weighted and just gives, big picture, how it’s really going … at least for me.
The chart below is truly a picture perfect work of art … it’s a LONG TERM monthly chart on the log scale. Think ‘percentages’ versus pure ‘price.’ The correction that we have just performed matches in both PRICE and TIME the same correction in the past. Why the big deal? It’s a perfect match of the biggest ‘correction’ for the history of the ratio.
Hence, that is why it was a line in the sand. I went on Stock Twits a few weeks ago and said “well, we are pretty much ‘here’ because I knew we were butting right up against support on the ratio and the move was coming – it was either 1/ going to find support and start up (bad for equities) or 2/ crash on thru the biggest correction and the replica of it in price and time. Market would have exploded higher …
Guess what?
Looks like it’s starting back up …
So, w/ the probability the ratio going up versus going down, where could it go?
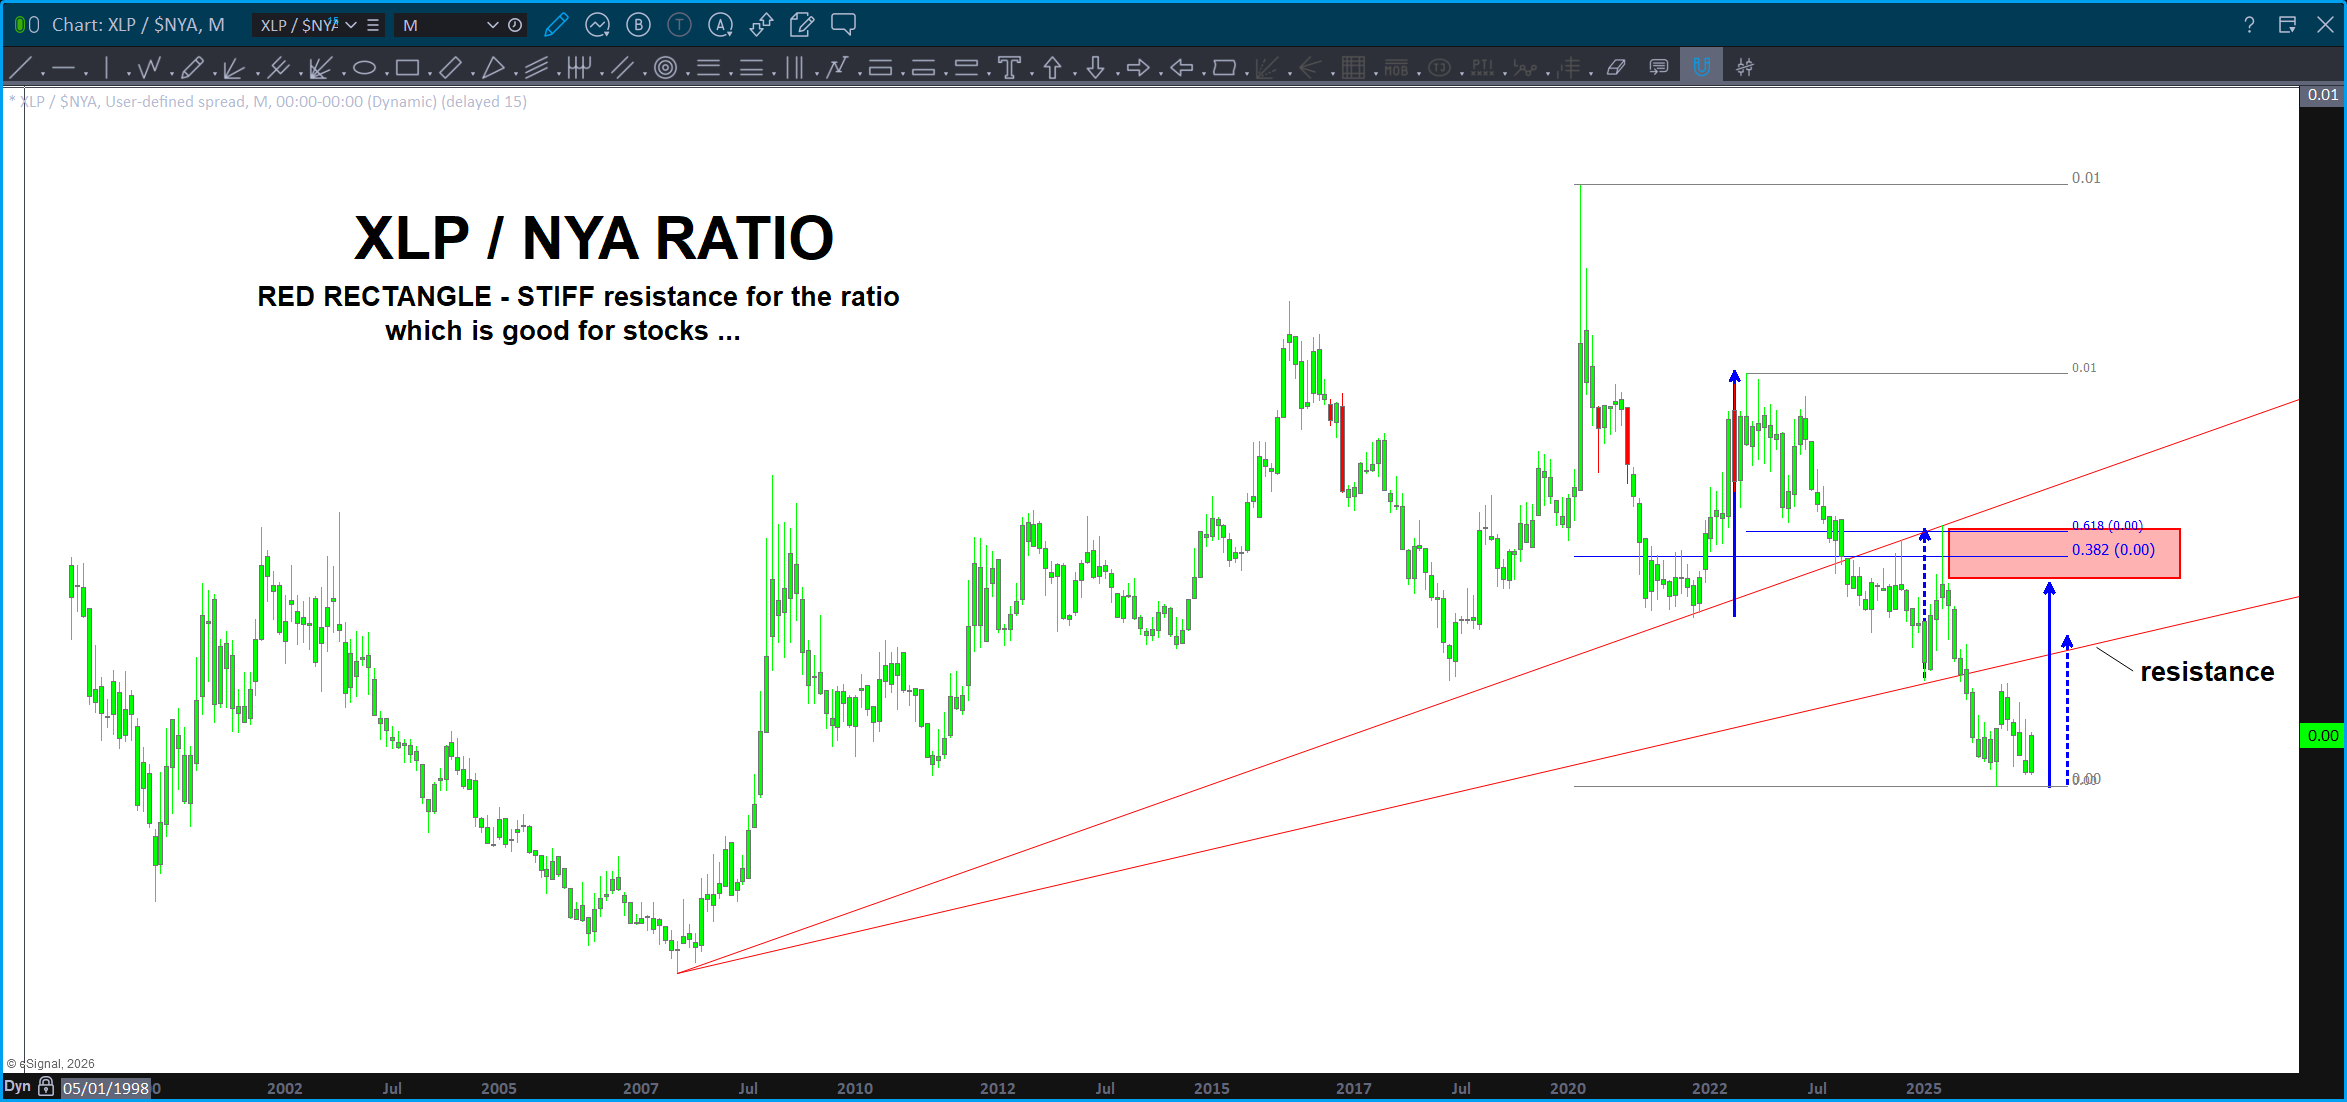
In the chart above, I’m using ‘measured moves’ of the prior corrections (the blue and dashed blue arrows) to PROJECT where this ‘correction’ could be going …
Using the concept of polarity and using the trend line from the all time low we can see that strong resistance ‘should’ be present at the arrow and it’s also about equal to a minor correction in the past.
Using the larger corrective moves and a Fibonacci confluence zone, this is where we will start to think about getting LONG the stock market. Yes, that appears to be a far distance and, frankly, it is.
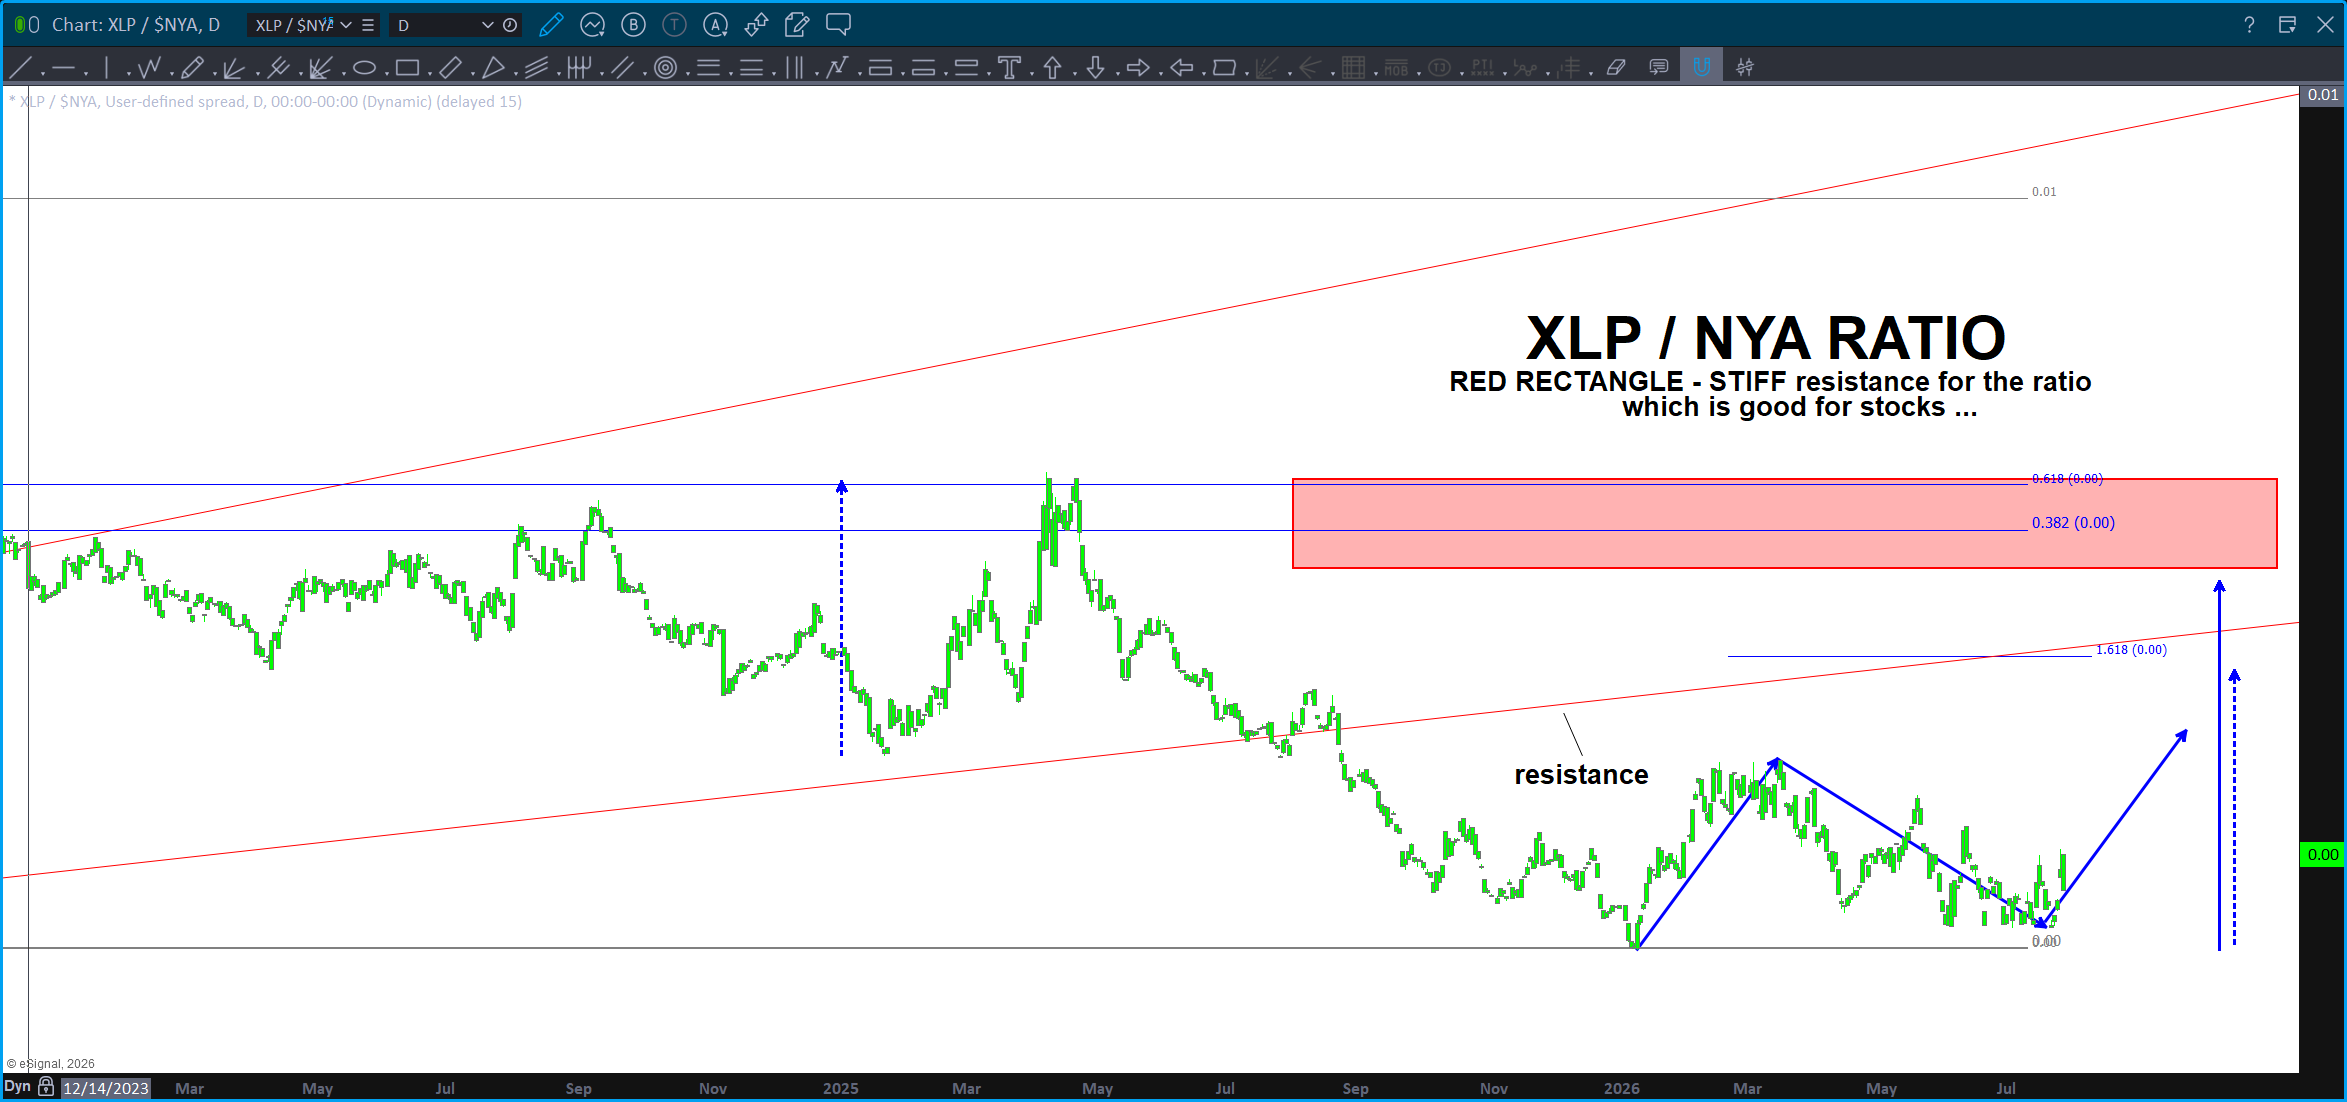
Above is the daily chart – take note we have moved from Monthly, Weekly, down to the daily. Always funnel yourself into time frames where you can take action. As discussed above, the target zones are above. It doesn’t ‘have to’ go all the way up there … we need to see strength in the rotation (as in continued selling – the institutions – who most of the time have to stay invested all the time – are getting out of speculative holdings and moving over to good old Toilet Paper!
Also, take a look at this target on the JUNK BONDS. Yup … I was telling someone the other day, forget who it was, that the Junk Bonds have been diverging from the markets and that’s usually been and ‘other’ in the world of goods and others. Looks like the are selling off, below, but also look at the VERY powerful support confluence on JNK. That should be STRONG SUPPORT.
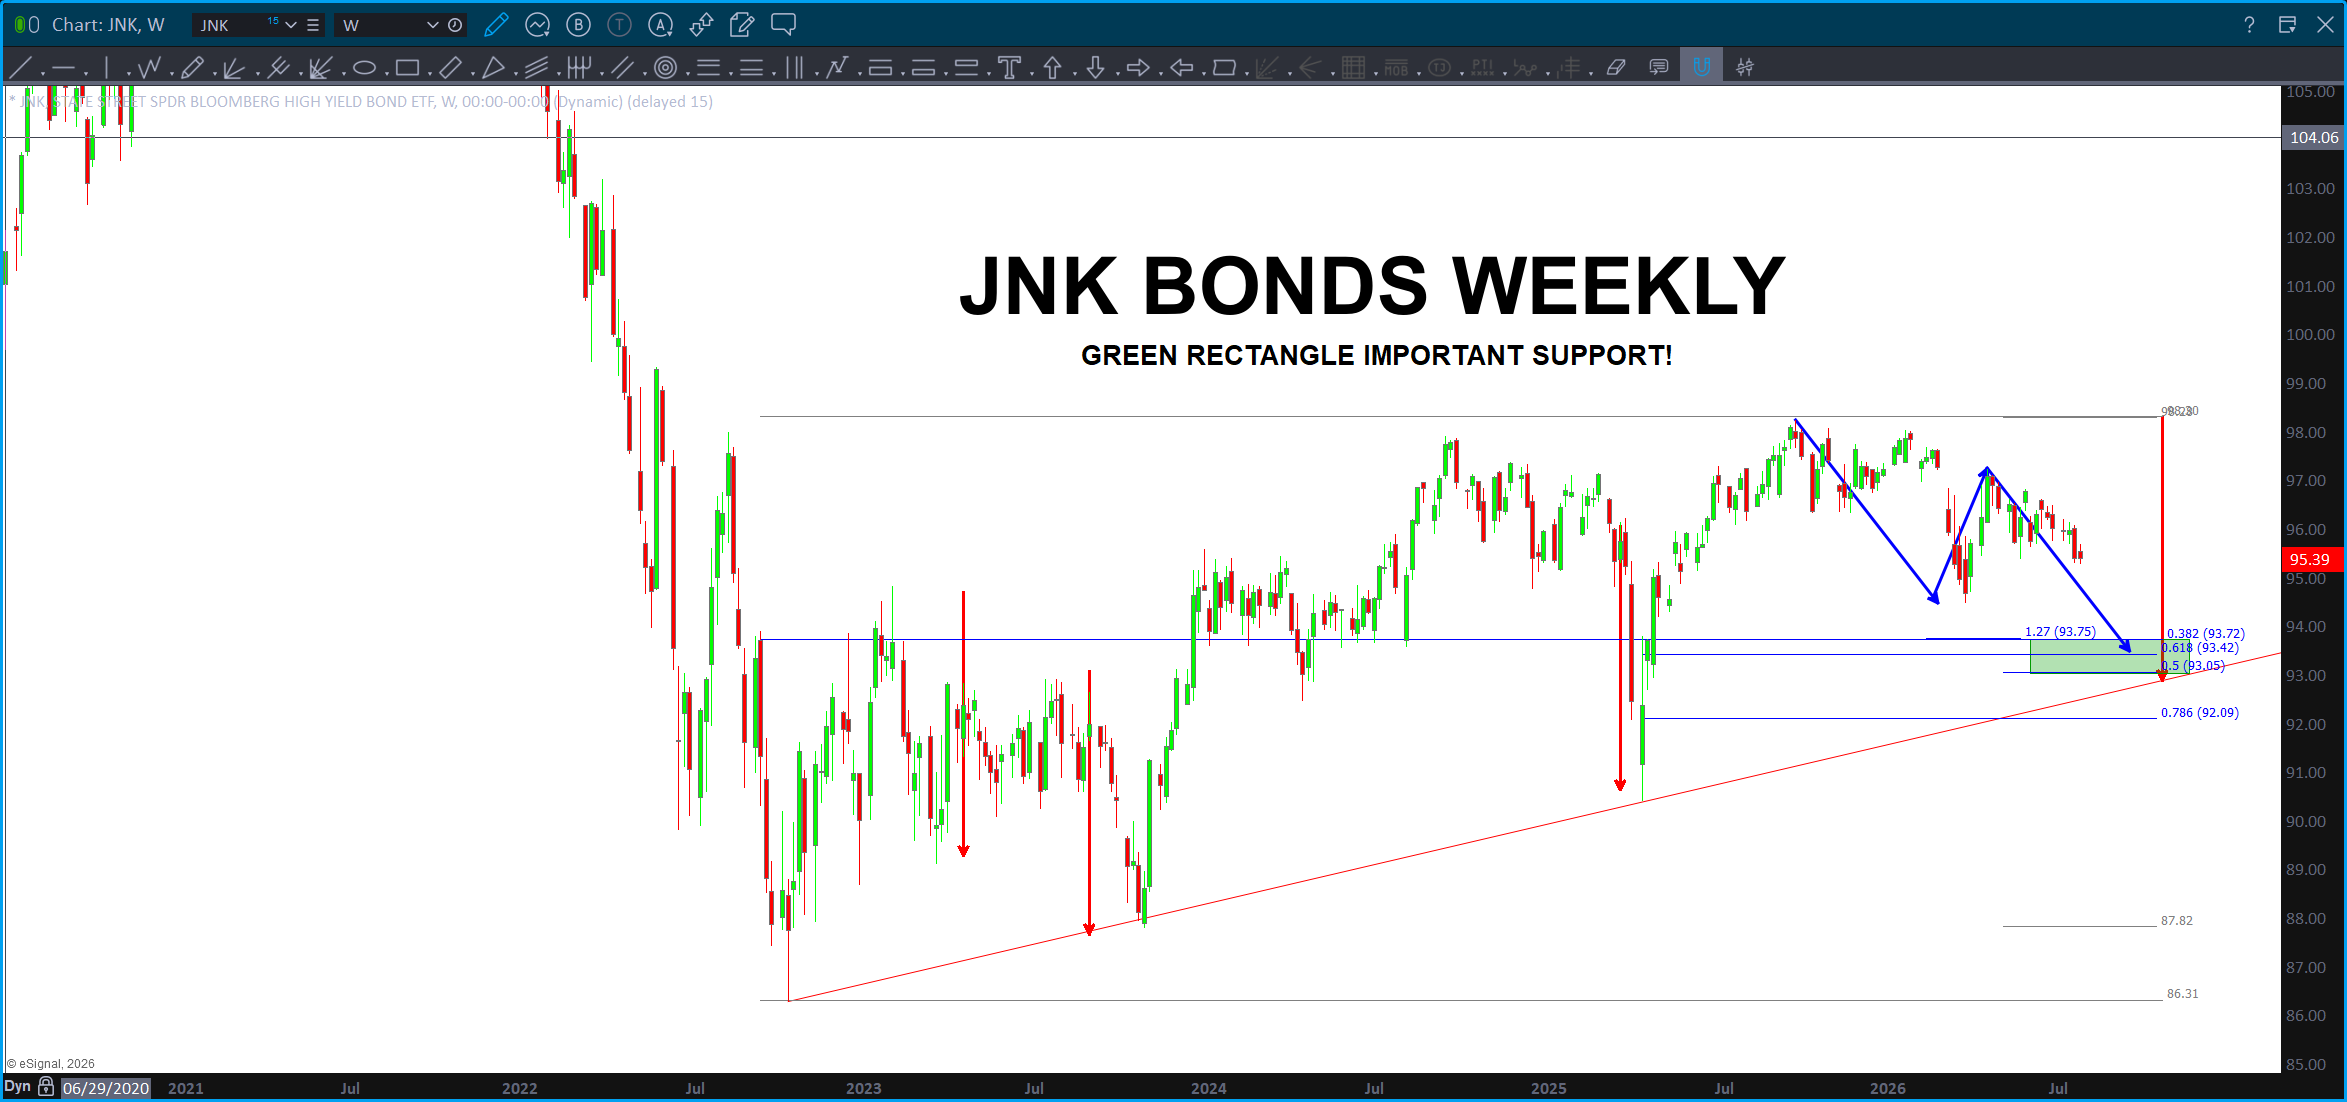
This is a weekly BUY pattern w/ a zone showing measured moves, ‘the’ bullish trend lines that have kept the junk bonds alive and a bunch of ‘numbers’ creating a confluent zone. If we are going to get a ‘first clue’ IF this is a BIG TOP or if this is a pretty normal, perhaps a little scary because ‘some’ sectors of the market were going parabolic but for the ‘steady eddies’ they’ll correct but, ultimately, release some steam and then start chugging again.
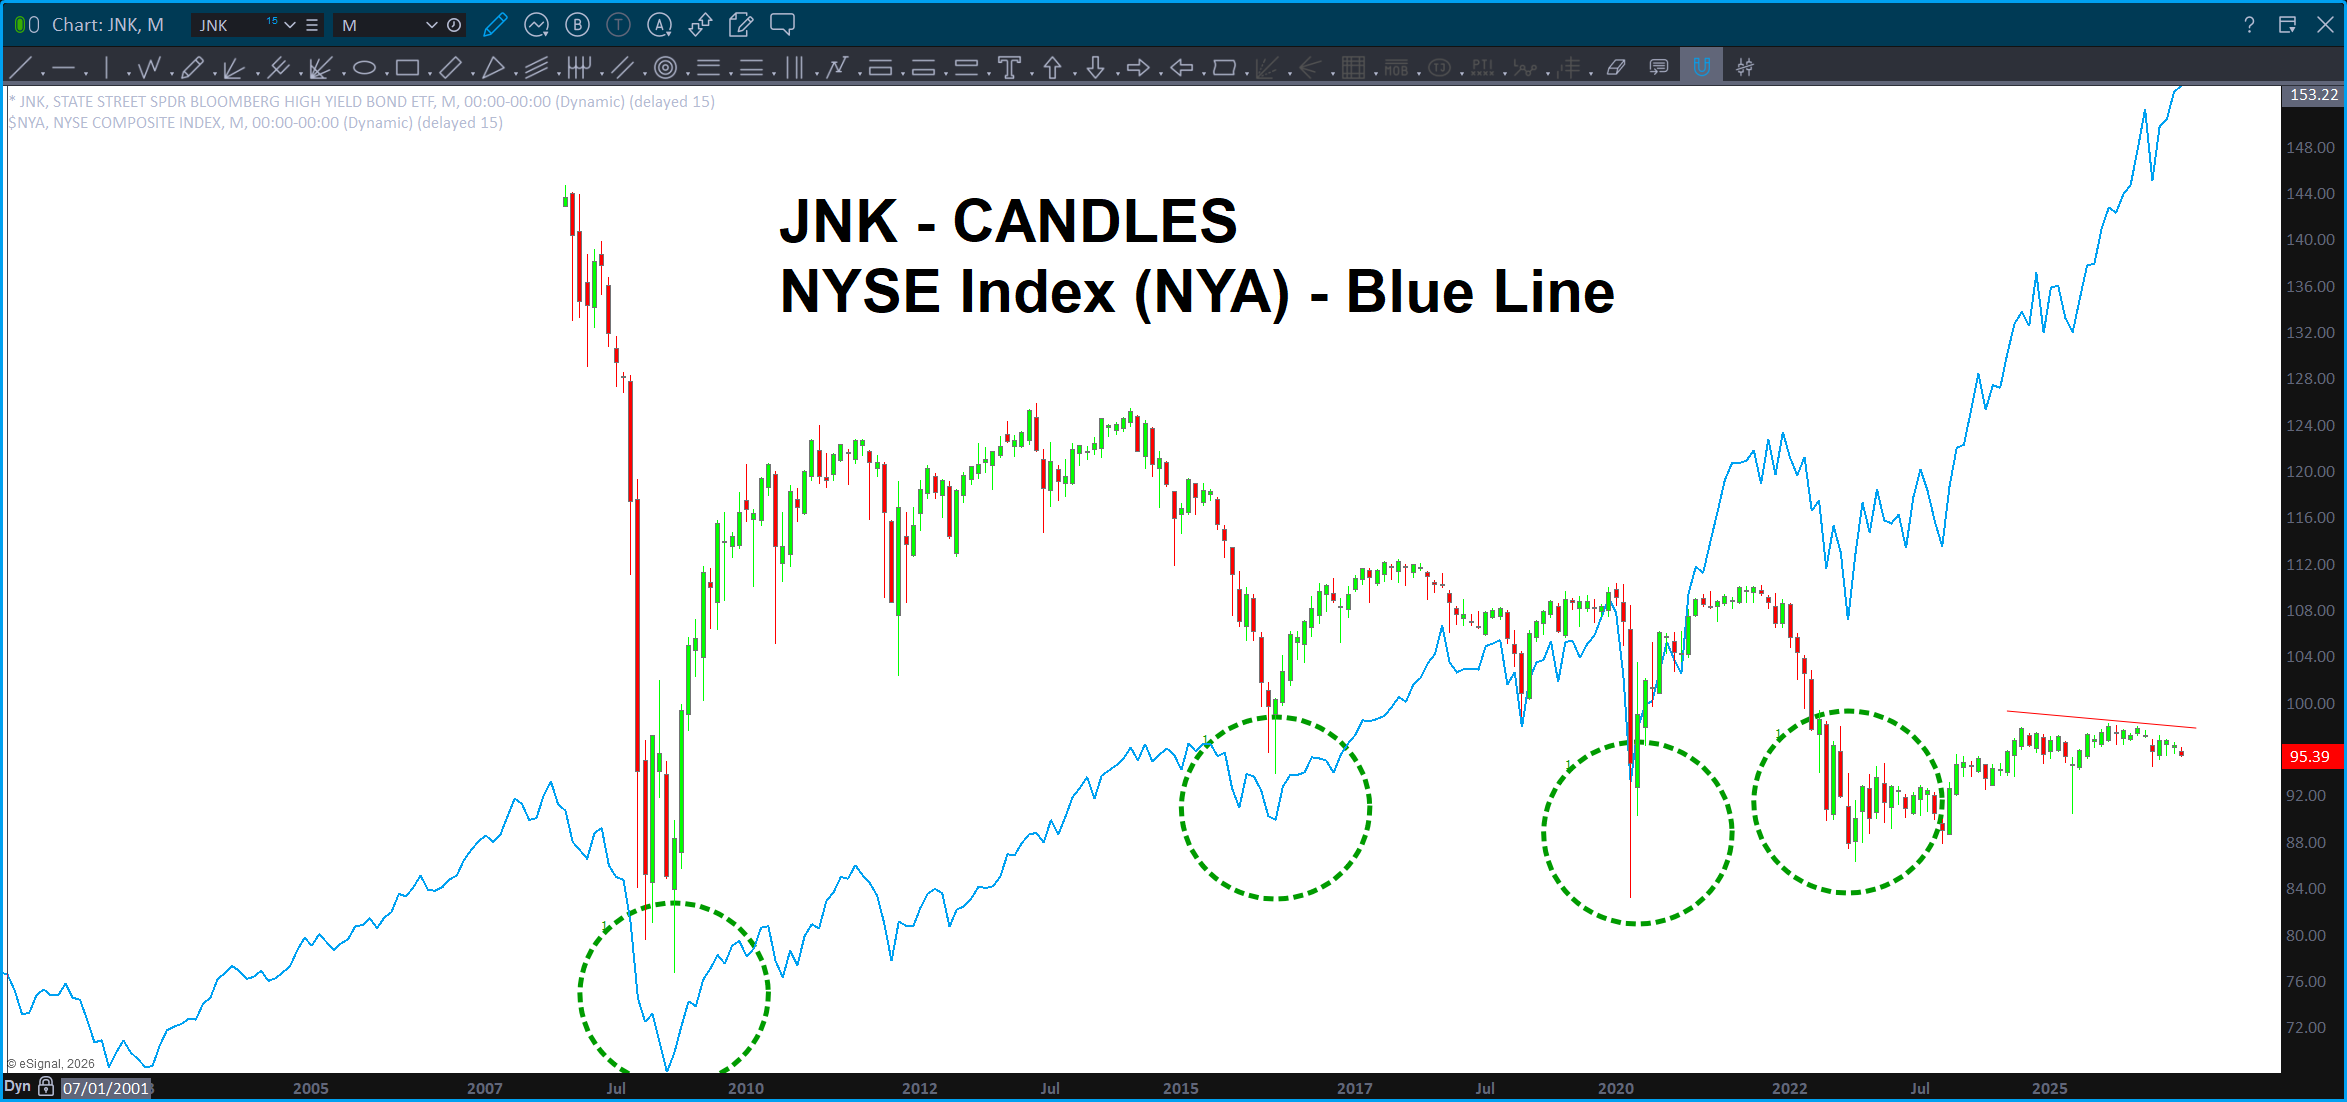
The pattern shown on the JNK is, in my humble opinion, THE level to watch for the severity of the correction. W/ today’s sell off it sure looks like some selling will continue in conjunction w/ the JNK so, simply, expect that. Let’s get really really interested when price approaches the green support – BUY – zone. That’s a good first line in the sand to see what’s really going on …
Technology or Toilet Paper – Mr. Institution?
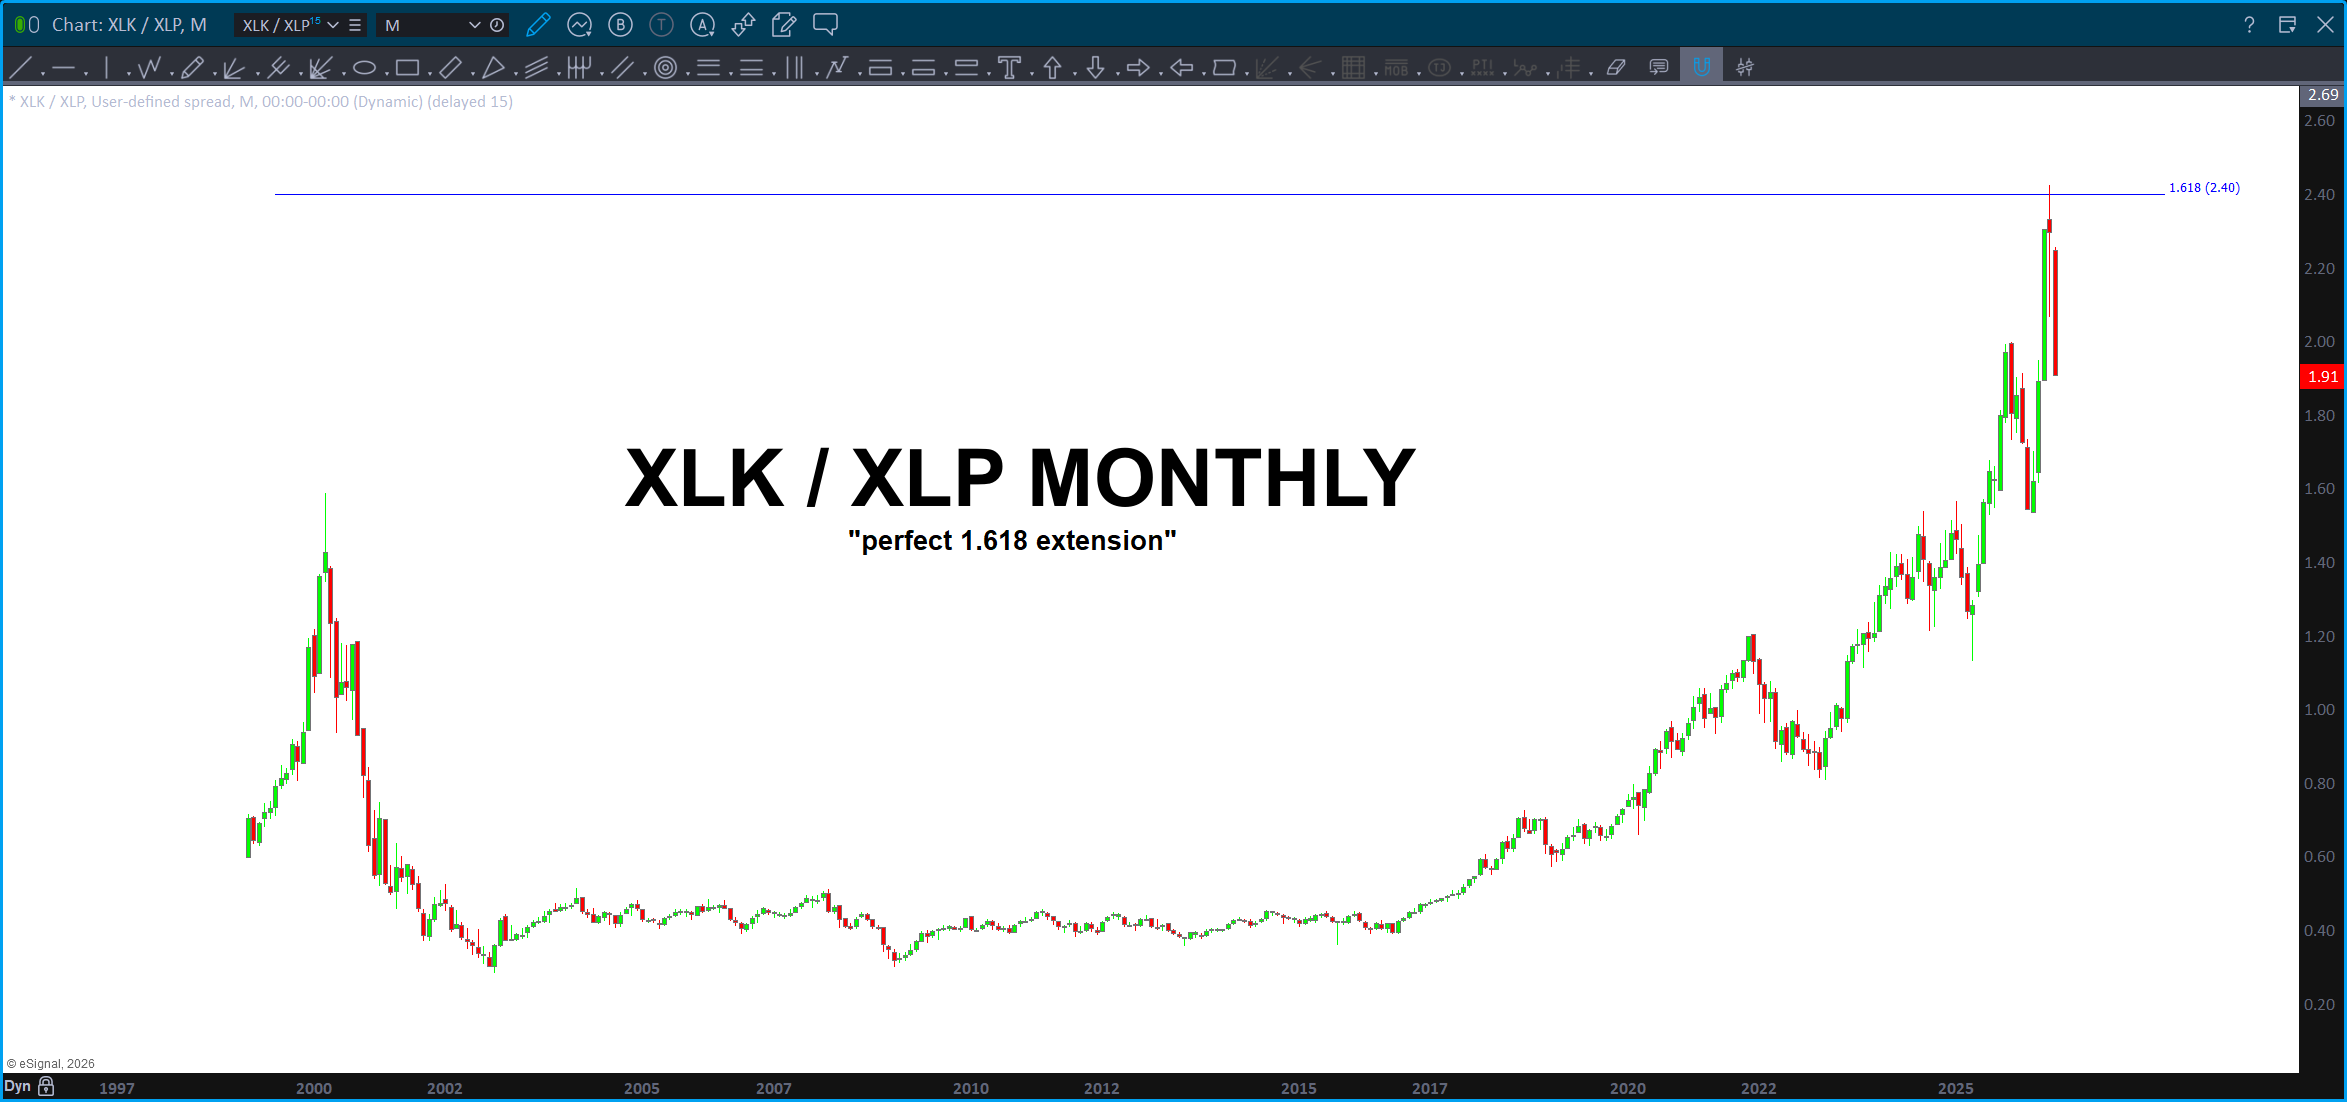
The XLK (technology)/ XLP (staples) ratio slammed right into the 1.618 extension and certainly looks like it wants to go lower …
So, some good targets for the ratio. My bet is the patterns have held and today’s price action gave us the first hint to expect some selling. The real severity of the selling? We’ve got some perfect targets below …
Keep an eye on Japan. The Yen keeps losing strength, but there is quite the thumping going on, unfortunately, for our Asian friends and their markets. No kidding, people were SO LEVERED they are getting wiped out … does this mean it will be a contagion spreading to other markets? I have no idea, objectively. Subjectively, just me who isn’t a fundamentalist at all. (Not smart enough.) But, wouldn’t it make sense that there would be some reciprocal selling? Probs …
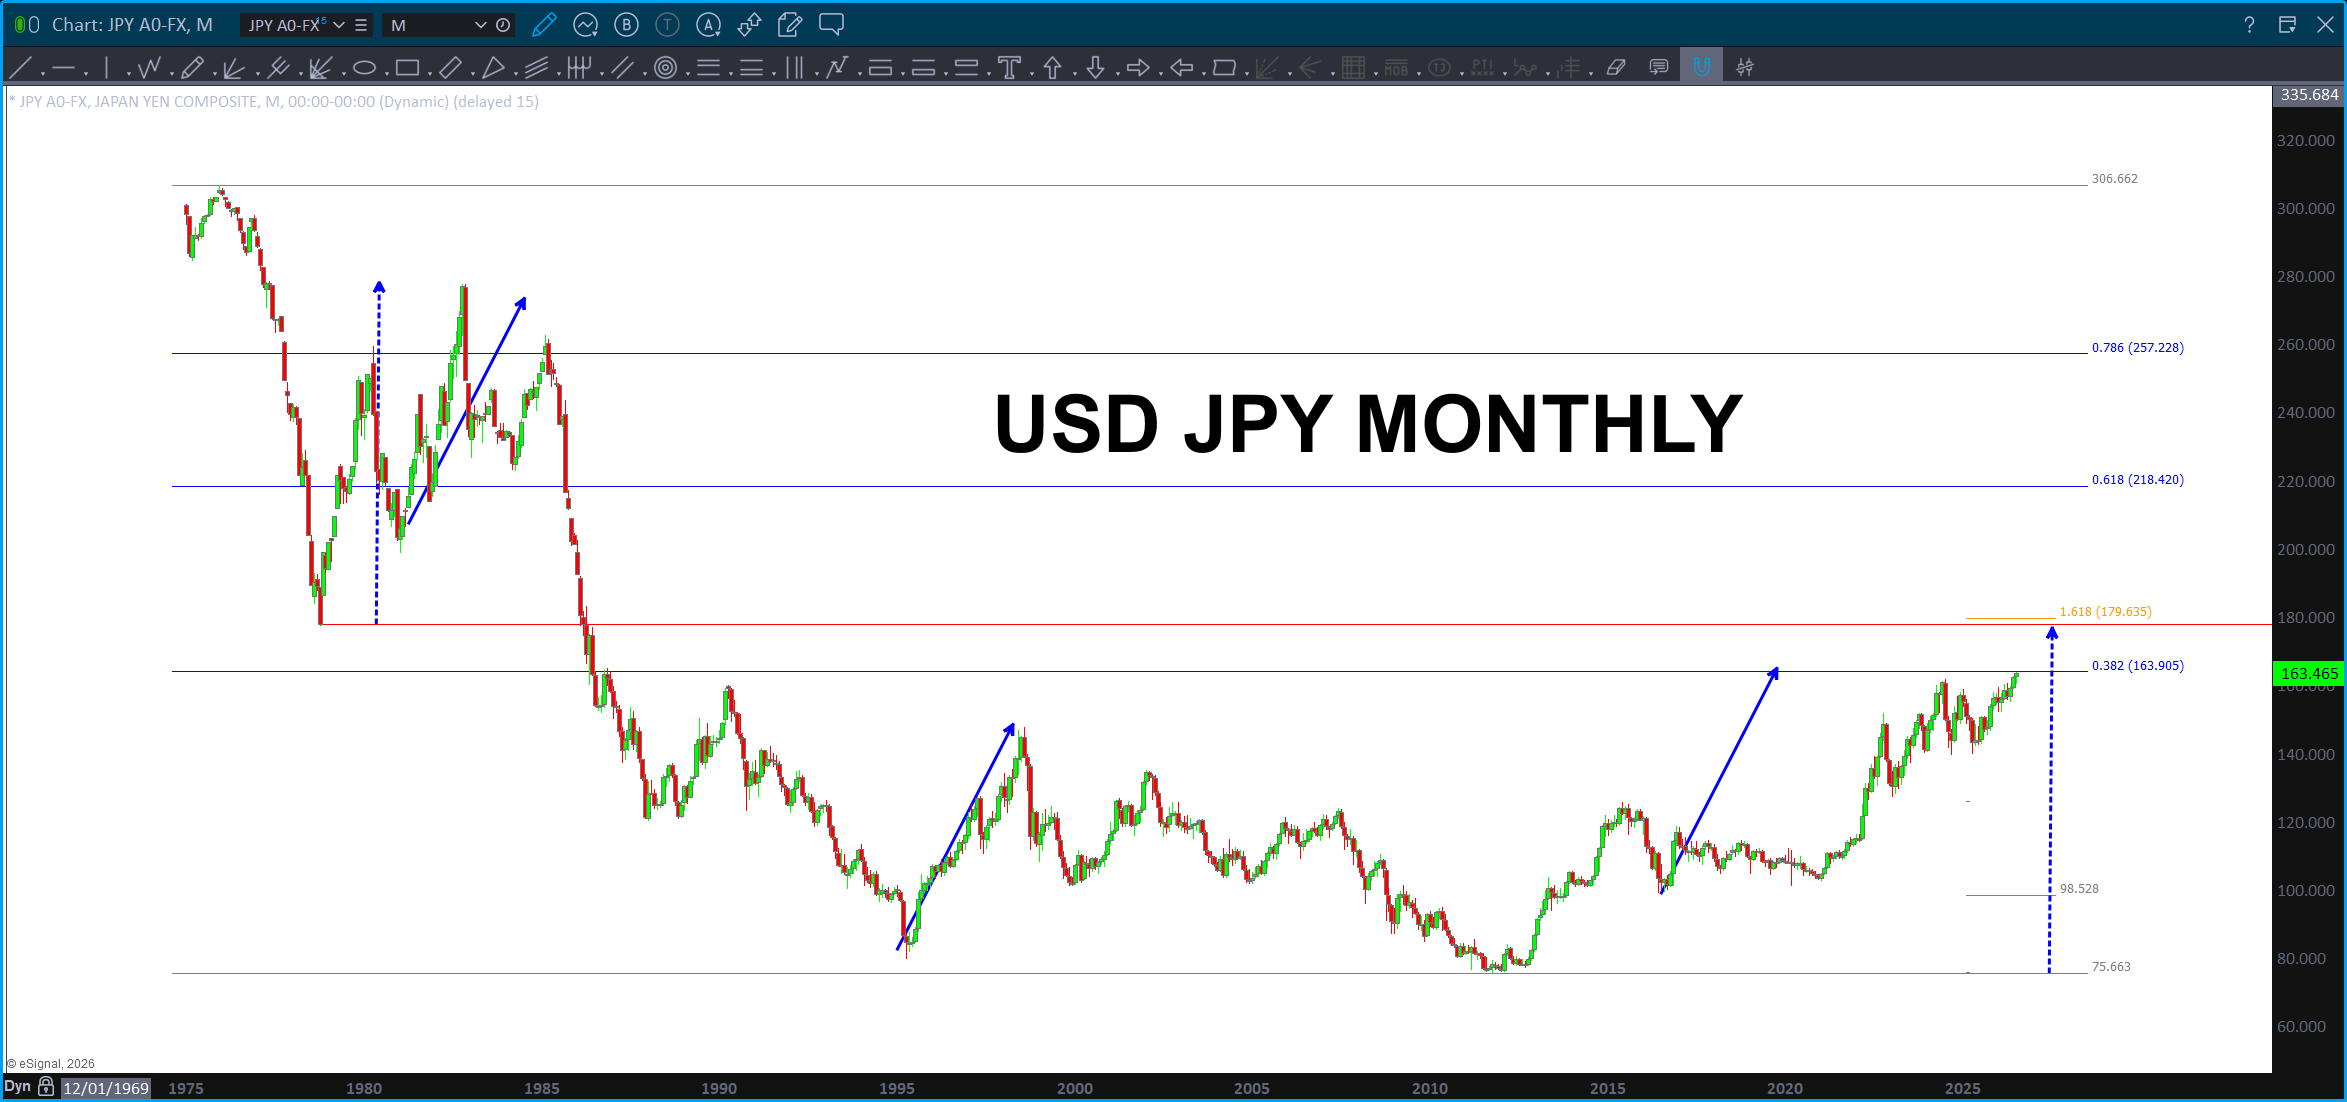
And here is the USD vs JPY. Check that out – right at the .382 of the entire bear market run from 1972. Hmmmmm resistance anyone? If that doesn’t hold it, we have another set of strong targets a little higher also. Keep an eye on the Yen!
Attractors … July 23, 2026

I think I’ve mentioned that for the past few years I’ve talked to my buddy Ponch probably 3-5 days/week. Sometimes every day …
I think, I really don’t know, that we met each other at intersection points of time/space where he needed to kick into the platonic space and I needed to understand the creation of reality. Seriously, how does the brain PROJECT this reality? Why? Well, if your reading this blog, you know that w/ pretty good probability – I’m the first to admit the patterns do not always work – go thru this blog you will see where the geometry was pretty darn good.
So, the question is – why? Geometry … ?
Just watched the Zach Bush and Joe Rogan Podcast and, first, watch it … but second, he talks about Geometry … that, literally, the hieroglyphics on the walls of the pyramids had the ability to HEAL. TILT …
For me, the answer was OF COURSE, as frequency is truly the finest medicine.
In this case … frequency and the hieroglyphics? TILT.
Even the very hairs on your head are numbered .. it’s all vibration.
So, based on a certain shape that enters the ocular field and stimulates some/one of the 12 cranial nerves that PATTERN (just the shape) creates a signal (vibration) w/in the neo-cortex that sends the signal to HEAL. Different body parts have different frequencies on a stand alone basis and as part of the entire orchestra of the body. When we are able to provide harmonious frequencies which, in a sense, tune the organ that is under stress, then we can create harmony and equality and ‘neutrality’ w/in the universes of ecosystems w/in the human body. Why, my friends, do you think the things that bang out music are called ORGANS? Why the amazing mandala stained glass windows and geometric shapes w/in those windows .. while in CHURCH you get the stimulation of the music (frequencies), the geometry of the windows (frequencies), the smell of the incest (frequencies) and, of course, the “lean to the right, lean to the left, stand up sit down fight fight” monotone movements w/in, was for me, the Catholic church. Still … think about it.
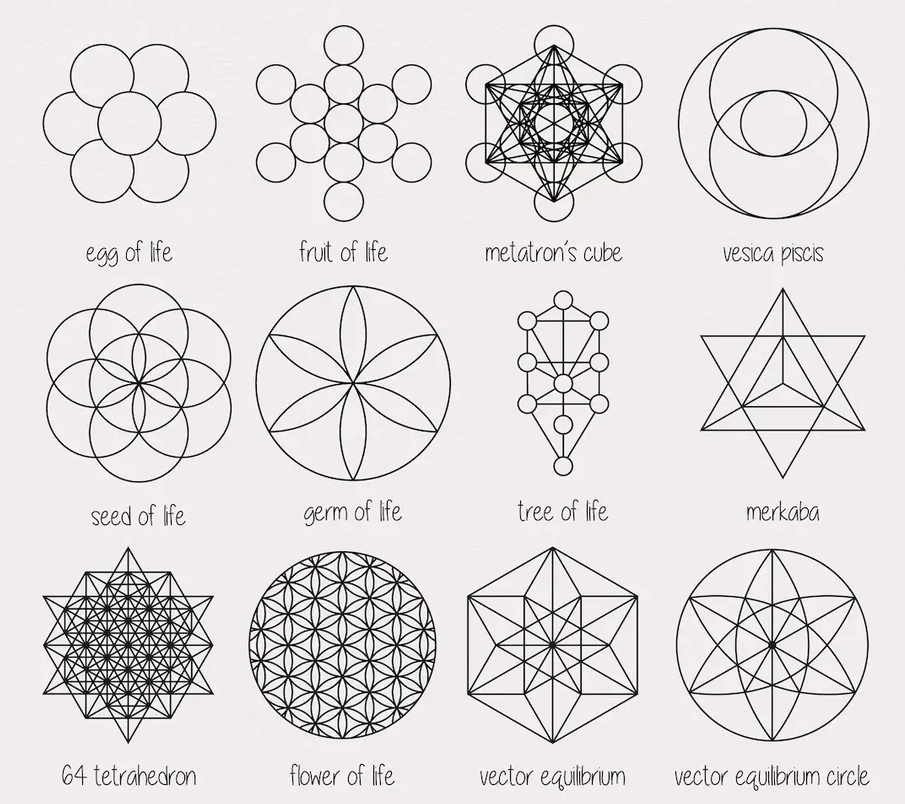
So, I’ve always wondered ‘what’ to call this type of technical analysis. It is pattern recognition. Yet, when I hear that I think of the classic patterns. Not patterns derived from sacred geometry, music theory, euclidean geometry or Metatron’s Cube. Perhaps it’s simply Attractor Hunting?
Ponch and I have gone DEEP. At a quantum level, we believe that anything that is thinking of – Amazon – will meet at that vibration. Anything to do w/ Amazon … out of the meeting of vibrations, a geometric shape emerges. The same geometric shapes that emerge from nature and life that allow our brain to comprehend, at quantum speed, the multiple mouse clicks of information that are coming thru our 12 cranial nerves (instantaneously). How does it do it …
FRACTALS. The reason the free energy principle WORKS is because of the perfect fractal nature of the universe. If you were the architect of these avatars (perhaps you/we are, perhaps not? ;)) how would you do it …? You would make every piece and part that makes up the fabric of reality grow/expand and form based on one universal constant. 1.618
Think about ANYTHING that GROWS from nature … it’s the Fibonacci sequence. It’s also the merger of male/female or the dark and the light. You getting it …? So, if everything is going to grow based on the SAME principle. What about the geometry? How would you do that …?
Close your eyes (I know you can’t because your reading this) but after you read, then close your eyes …picture the darkness. With our eyes close we experience/feel the darkness. Yet, GOD said “LET THERE BE LIGHT” … so picture that darkness as the single point of singularity. From that point God SPOKE (that’s why we need to continue to refine our speech as they are cocreators of this reality) the first AUM or vibration. At the end of the first AUM was the end of the first line. From the point, to the line … so how do we tie this frequency, this beat together? We create the circle .. the representation of time and the orbits of the planets, which, OBTW God CREATED the Heavens and the Earth and used planets to tell time and give memories of seasons. Look it up, it’s in the Bible.
So, now we have the first circle. You CAN NOT divide perfection … but, you can replicate it. So, the 2nd circle is created. Boom, see my last blog on the Vesica Piscis.
Go back and read .. it’s the USO Vesica Piscis.
BOOM .. there it is. Remember how I showed how EVERYTHING is created from the radius of that first line or measured move on a chart? Now you getting it … from that Vesica Piscis the square roots of 2,3,4,5 are derived. Well, why square roots? Boom .. musical theory. Frequency of a string being equal the square root of its tension or 1/square root of it’s length. Square roots and inverses = big deal.
To continue our thread … the first 6 days of creation are the seed of life. Boom …the 7th being the point of singularity – or the SUN.
From the Seed of Life we go the Flower of Life. That amazing geometrical shape … and then the flower of life BLOOMS into Metatron’s Cube. The mack daddy of em’ all.
From there … let’s bring that into the 3rd dimension. That creates the 5 PLATONIC SOLIDS and that’s where the “5” comes from w/ regards to the 12-13-5 triangle. 12 being the sun cycles and 13 being the moon cycles (moonstral cycle for the DIVINE feminine) and 5 .. the platonic solids. So, this triangle is the ONLY triangle in the world that has the area and perimeter equal to 30. Yup … and so that is the triangle that we use to … divide the circle into 12 parts of 30 degrees each. And, that’s the angle that is made when you connect the two mistakes on the Declaration of Independence.
Why the diatribe?
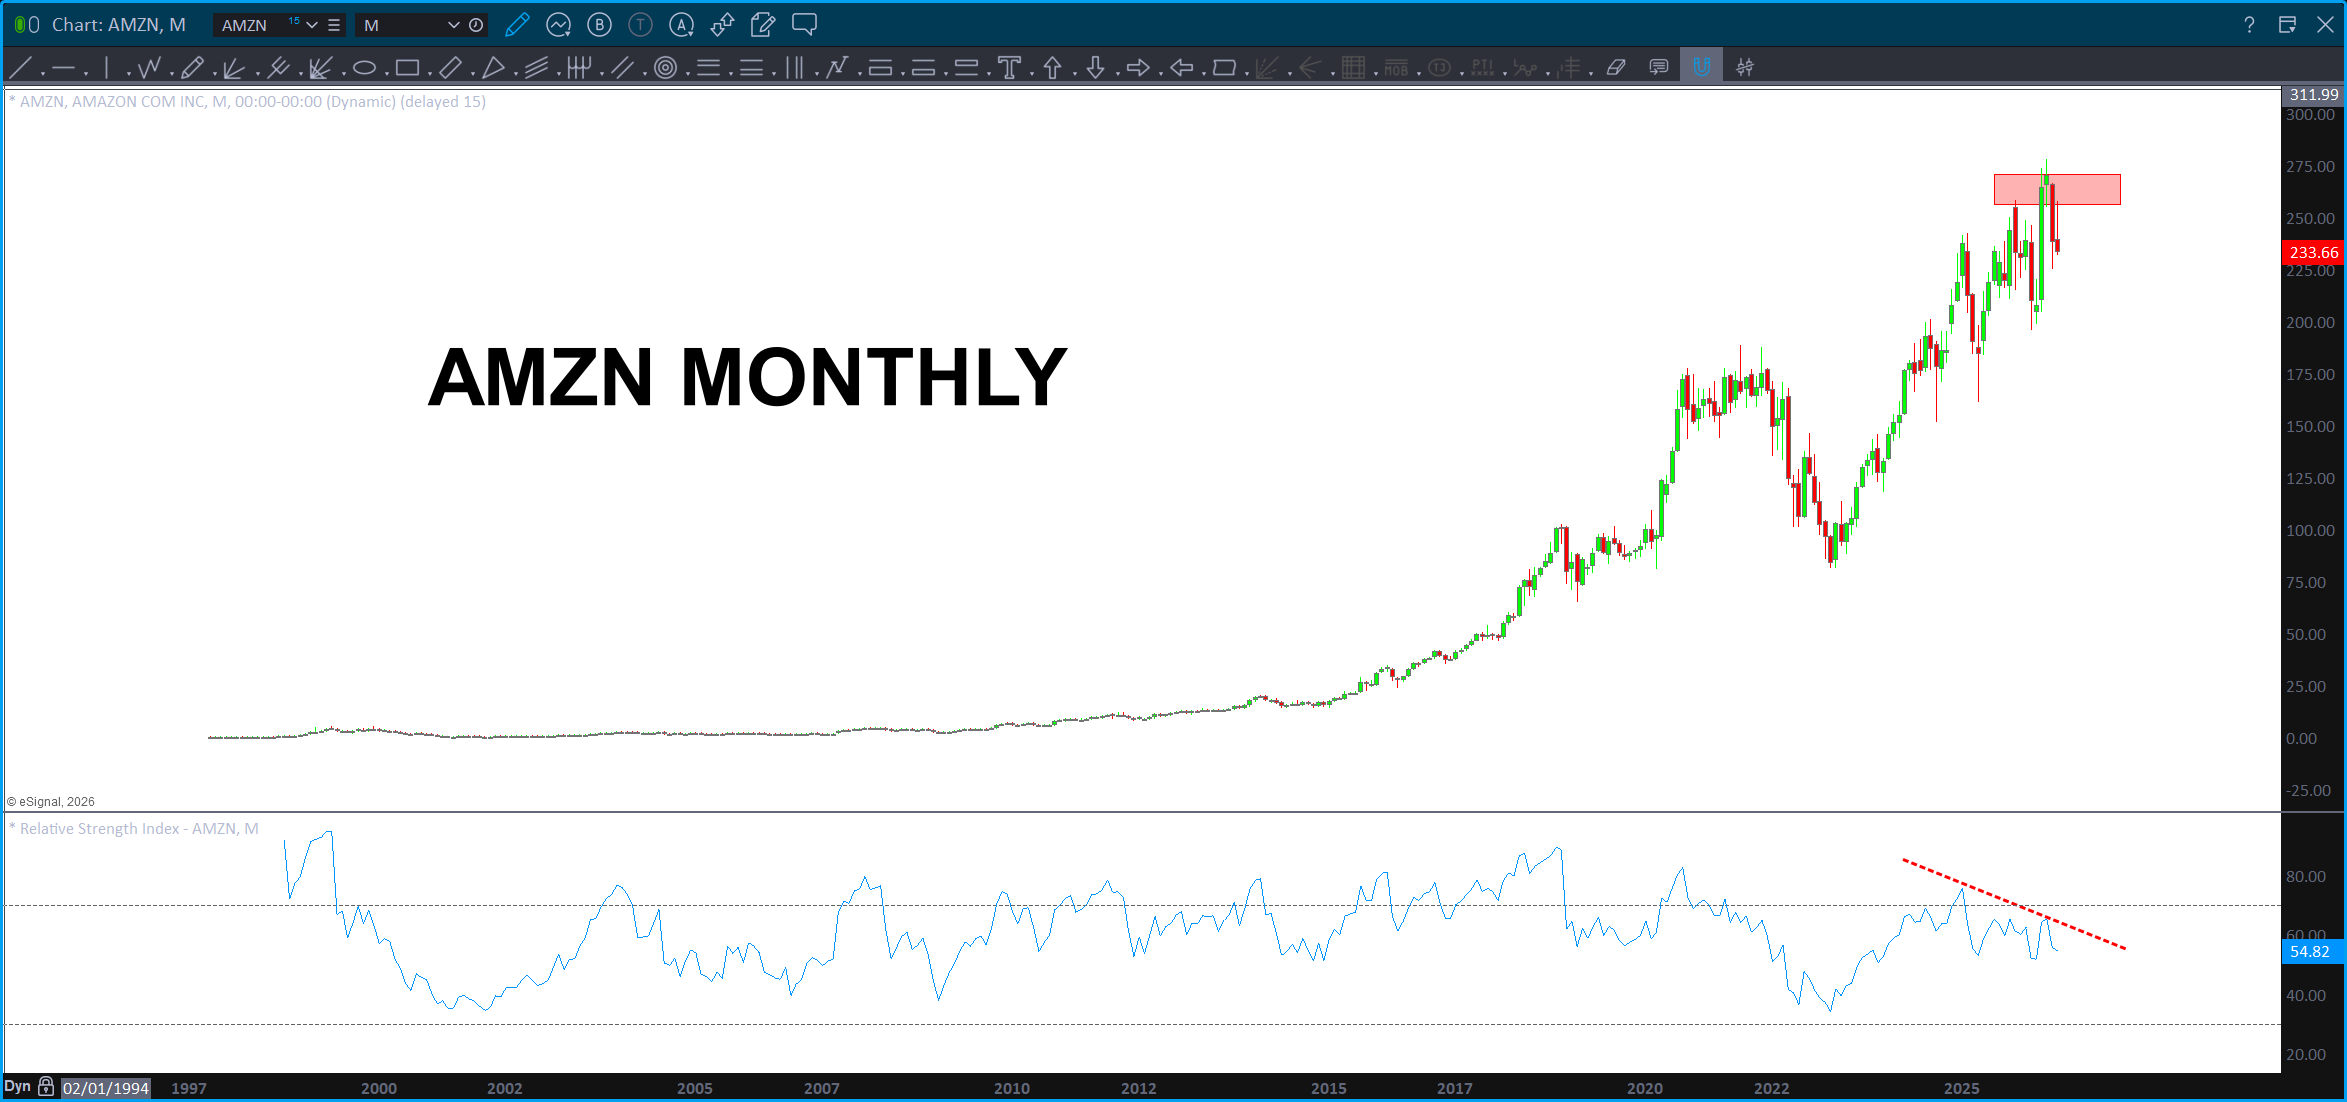
Well, I honestly forget a lot about the things I do on the charts. To be honest, it’s my relaxing time. I come and sit down and blog to just relax and chill out after dinner. Maybe pop and edible, maybe not. Always w/ very trippy music and I just go and draw stuff. Anyway, w/ today’s sell off I asked myself about AMZN. I had forgotten this video:
Don’t judge, I forget all the time.
Anyway, w/ today’s action we smacked right into the target zone and it was a three drives PATTERN to a top.
Again, work with me, what the heck is really going on? This video is back from January. I had no idea (still don’t as it could reverse tomorrow) it could or would hit the zone back in January. But, it did …
I’ve seen it too many times. There are attractor states in the market based on the platonic space. The platonic solids are specifically mentioned w/in the American Codes prominently when you take the distance of the center of the sun to the center of the earth and divide by – get this – 1776*6771- you get the angular ratio for the 3 platonic solids that govern this 3D matrix of consciousness. No kidding …
The tricky part? How long does it take – TIME – for these patterns to form. I’ve got an idea … I talked about it above. It’s that simple.
Let there be light …
Ding Ding … Ding Ding – July 22, 2026
For those that might not know, today is Mary Magdalene Day … 7/22 or 22/7 = Pi. Come on man … and, there are now, 162 (hello 161.8) days remaining in the year. Mary Magdalene … in honor of her day, may I recommend “The Magdalen Manuscript – The Alchemies of Horus and the Sex Magic of Isis.” Yeah, no kidding, if you want to understand, cough cough, some of the stuff that’s about to happen, this might help you. Just a tad …
Anyway, I spent a significant amount of time working w/ Alan and the America Codes the past couple months and I’ve had the unique opportunity to literally see the dedication and effort has POURED his life into getting THE message correct.
Guess what … Mrs or Ms (ask a Knights Templar ;)) Magdalene comes out to777 in Hebrew Gematria. And that plays a huge role in the entire information being passed down. I’ll stop …but there is so much happening right now. One of them, the below …
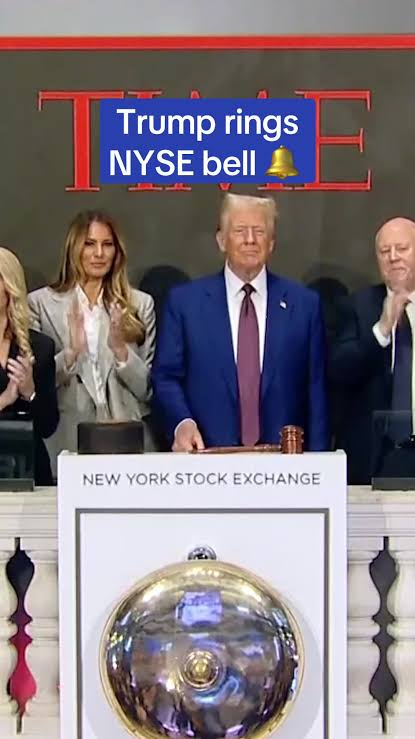
I was just thinking, “you know, wouldn’t it be funny, IF the President is literally ringing the bell at the top?” Seriously … we are at a pivotal point of “should I stay or should I go?” And, trust me, go it could … I for one want a nice correction to buy into but who knows.
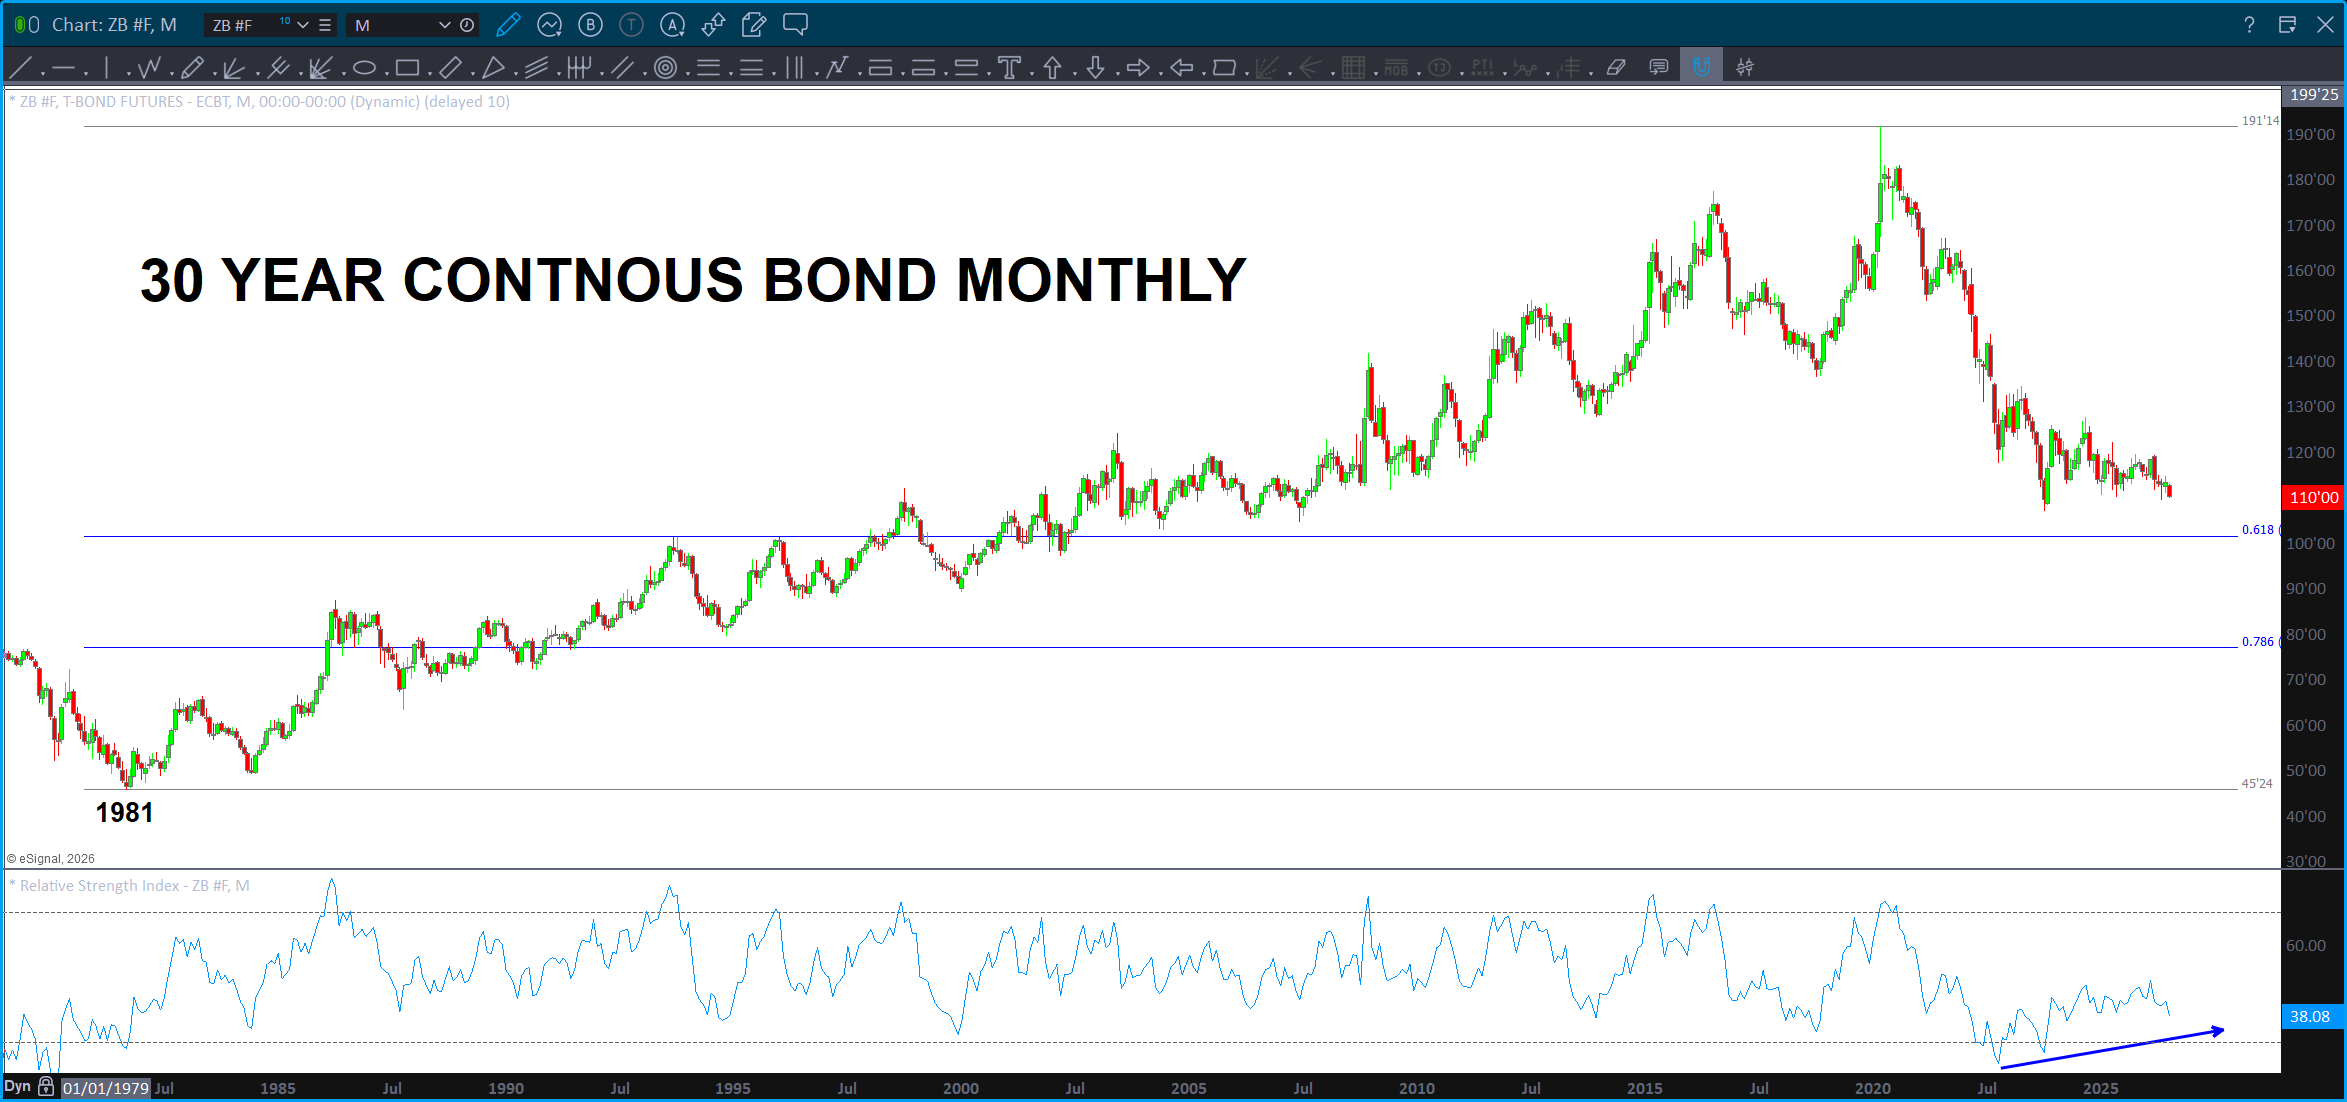
But, here come the bonds. If you go back and look at some of the work on the bonds I’ve been waiting for this to happen and here it comes. I don’t have all the other ‘math’ going into the .618 of the entire 40+ year swing is the next support target. For those who have followed me for a while, you know I’ll jump in but I’m not much for the ‘jump in front of the train’ mentality and this wave down in the bonds certainly looks like it could accelerate which, frankly, ain’t good so – for now – I’m going to give it a wait and see. I am long TBT from a while ago so I’m actually thinking more from the perspective of the US. Who is dumping our bonds?
Either way, just stand by as the media and the MSM is going to scream about rates and it’s out of control (it is – frankly) but we are getting to a point of a multi-month or multi-year BOUNCE in bonds. I’m feeling pretty good that we just finished the multi year 4th wave triangle that I’ve been watching and price is doing what it’s supposed to – sprint out of the triangle like a snake as it’s been coiling the energy of the continuation pattern for a couple years …
I’m fairly certain that this triangle occurred as a 4th wave correction which gives credence that we are in a 5th wave down and I believe we have stared the 3rd of the 5 waves that make up the last wave.
Then … we BUY BONDS!
Gasoline – July 21, 2026

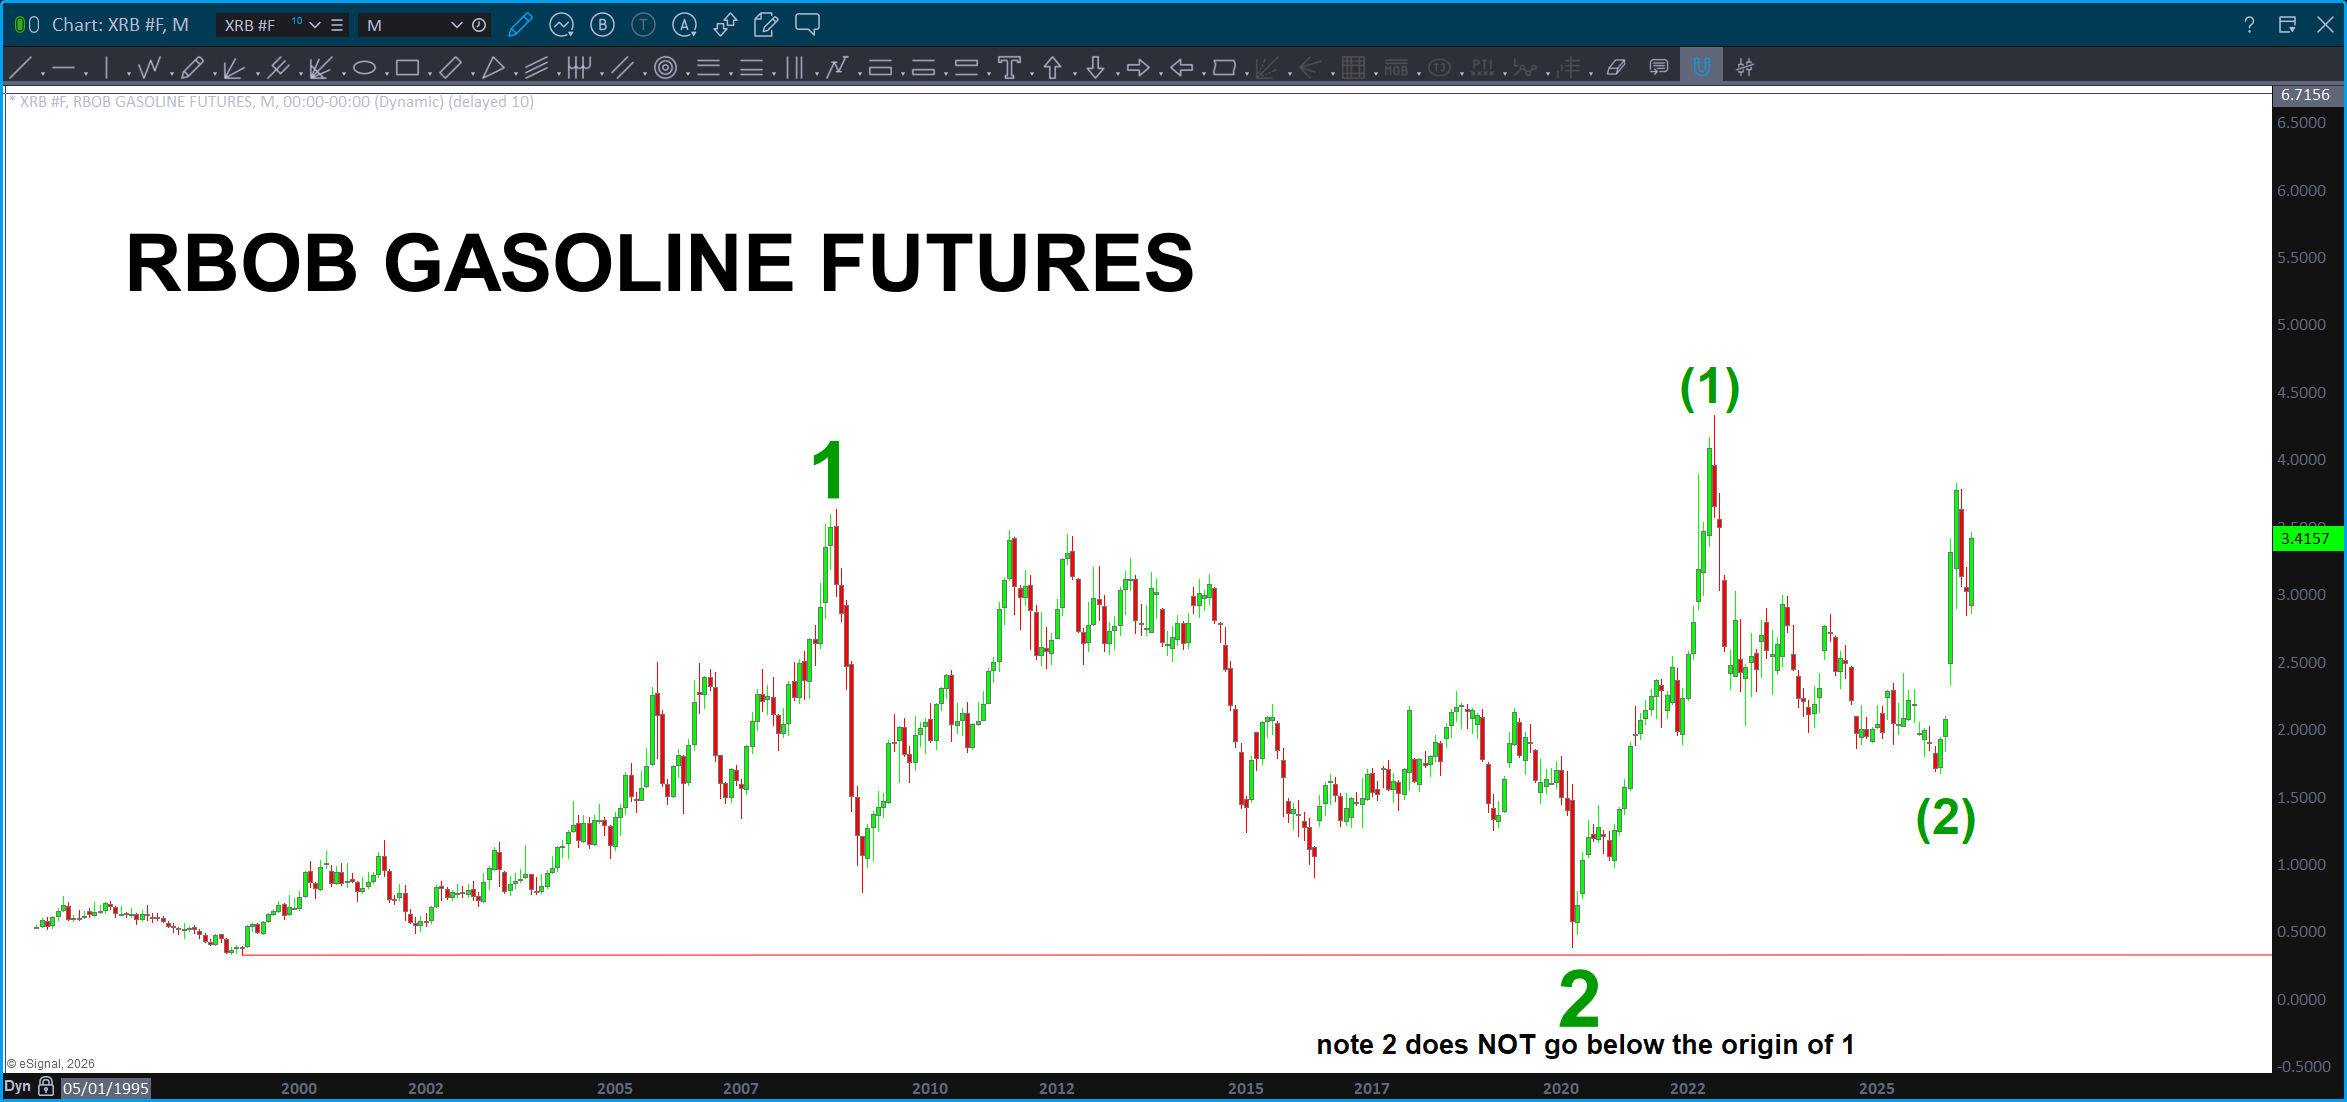
Look, I always say my counting is like my golf game … if you ask me what I got on a hole and you see me pointing at the hole and pretending to count, I’m probably confused. 🙂 “Give me a 6 on that Par 5” (yeah right) Anyhoo, that’s why I subscribe to counting (or attempting to) on longer term charts as it’s ‘easier’ to not get lost in all the subwave machinations. All this to say, I see nothing wrong w/ the count below.
That almost seems Mad Max like but the first rule we are looking for is – wave 2 cannot go below the beginning of wave 1. It doesn’t .. Valid.
Now, I look at the waves of what I am labeling the 2 wave and you can easily see a three wave CORRECTION. I don’t have a problem labeling that sequence of PATTERNS wave 2.
So, now … dare I say off we go in the 3rd of a 3rd wave that is the most powerful in the wave structure. A wonder to behold is how it’s described in the EWT Theory Books …all that saying, prices could sky rocket higher and go to levels not many of us have ever seen.
Go look at some other ‘auto-elliott’ software program or service and see what they think if you want. Please let me know because I seriously went “OK Bart, double check what your looking at dude …” I did.
My bet – gas is on the verge of going higher in the 3rd of a 3rd wave to take gasoline futures to new highs and, potentially, crippling prices in regards to the economic impact.
Just calling it like I see it … I’d say the same thing if it was the stock of a tech company or whatever. It’s “just a pattern” to me …
Do really hope I’m wrong …
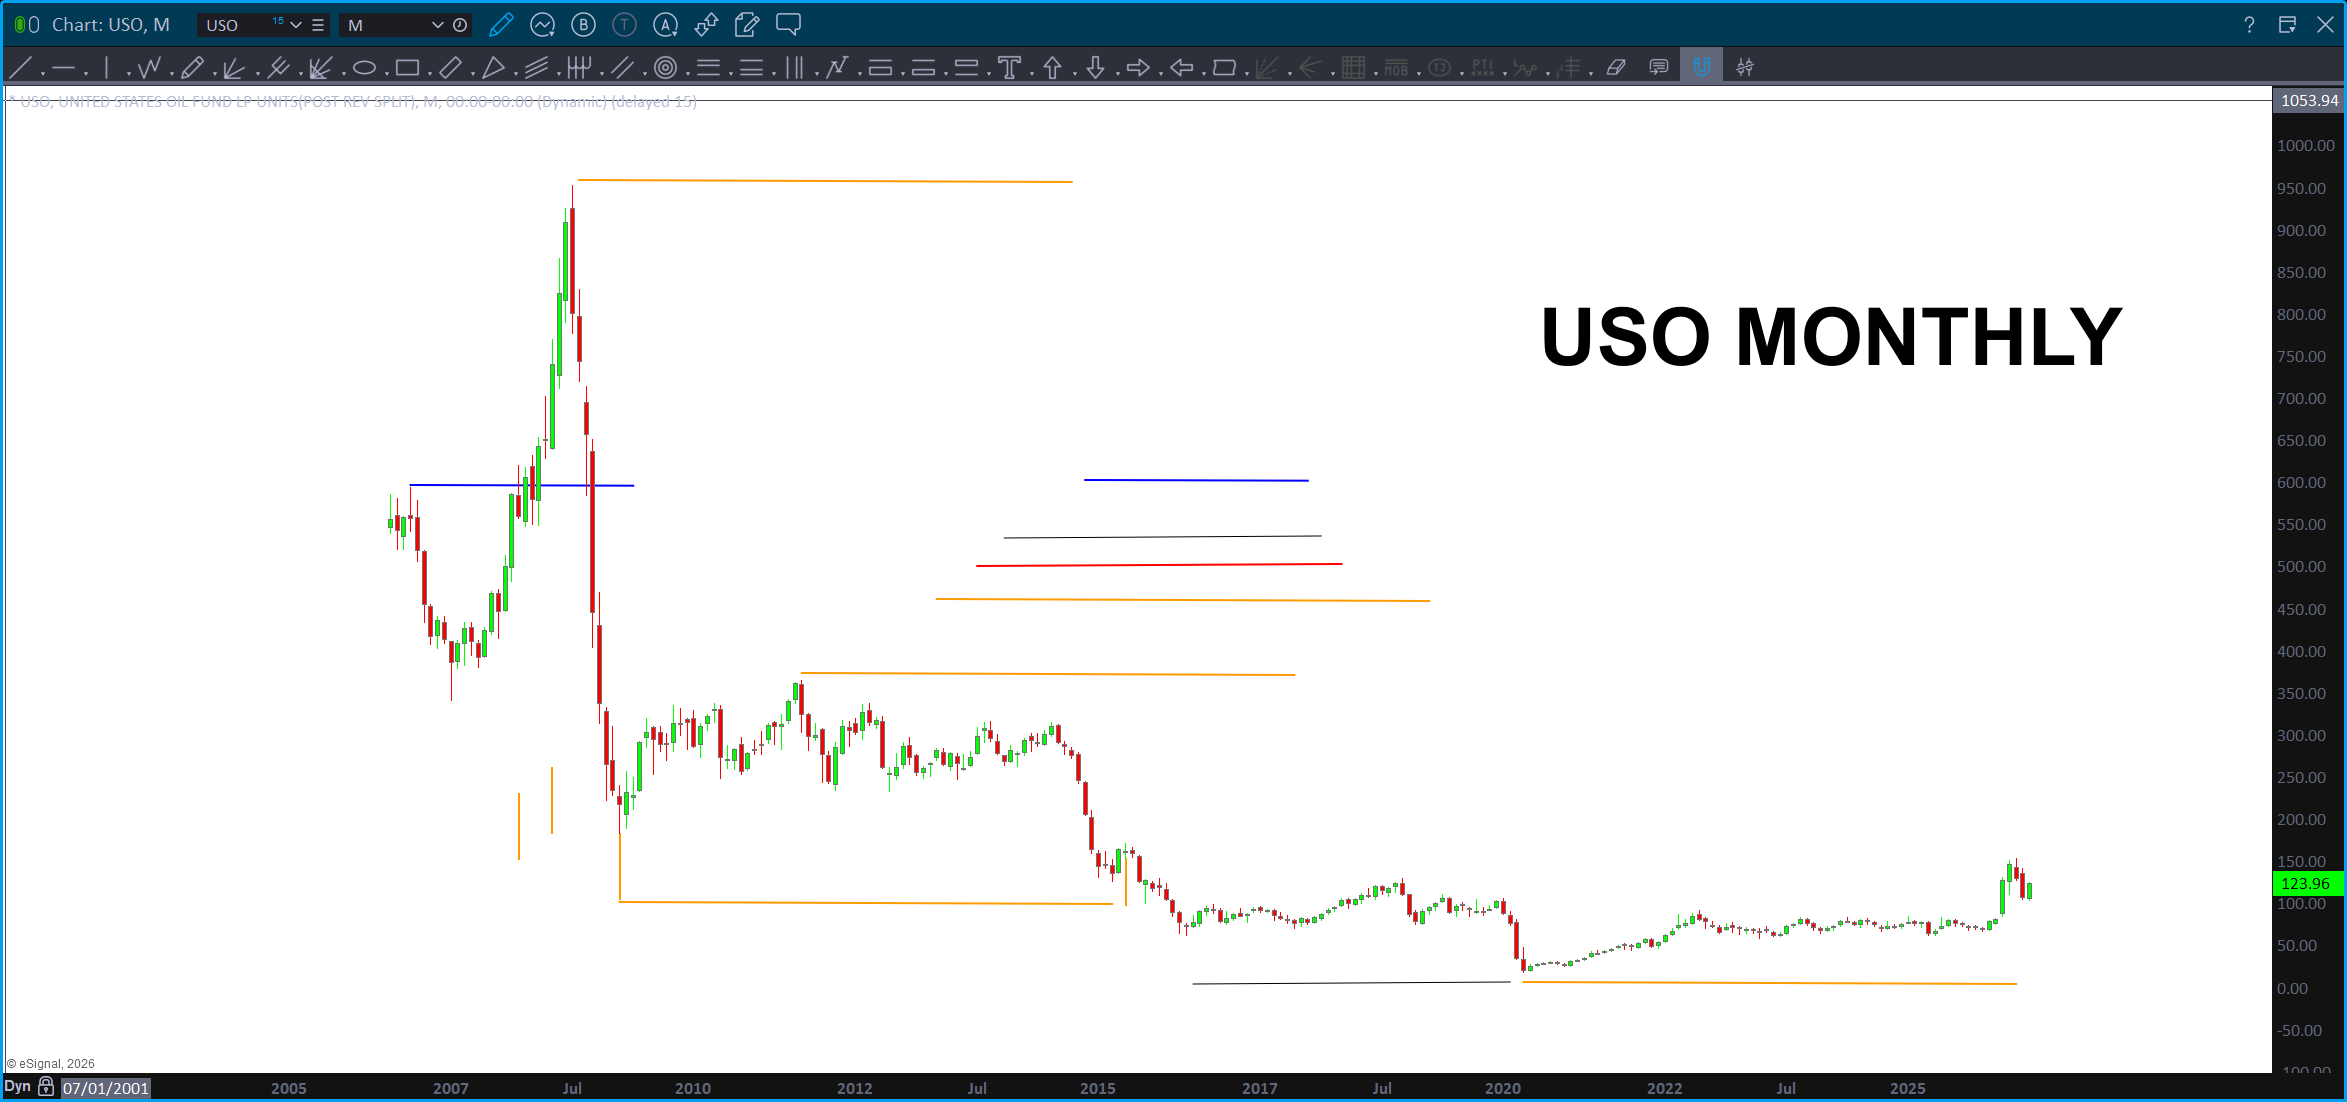
USO Vesica Piscis – July 19, 2026
Last night I got into the zone and just started typing … dove into the D’ver, Solomons Temple, the Gospel of Thomas, musical theory … I saved it as a draft.
My last post was the D’ver …
Here’s the USO and the Vesica Piscis. Folks, trust me, just go get http://www.theamericancodes.com and/or check out Truth Social in a few days. 🙂
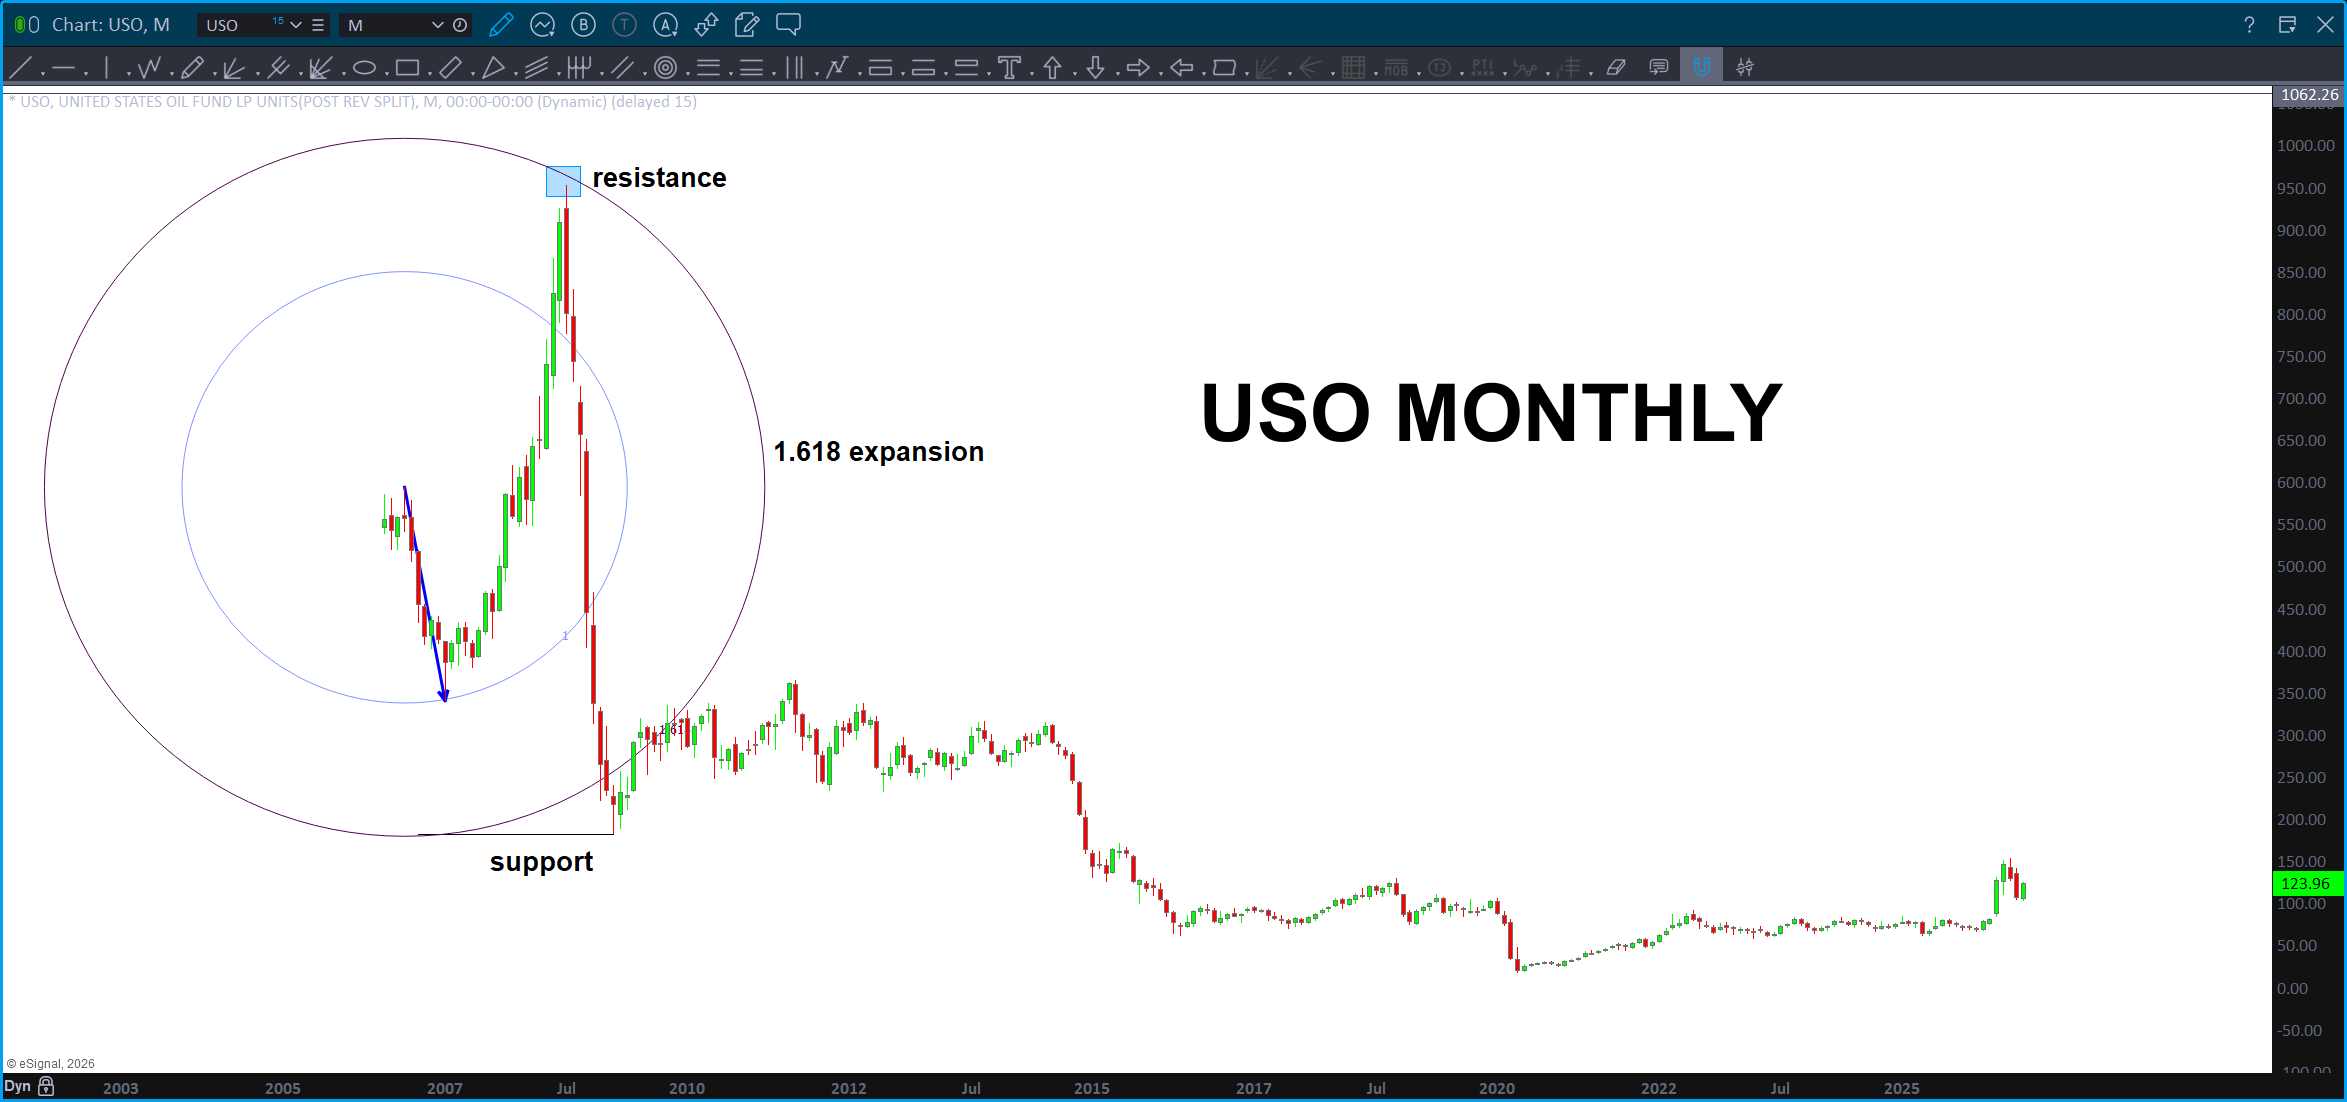
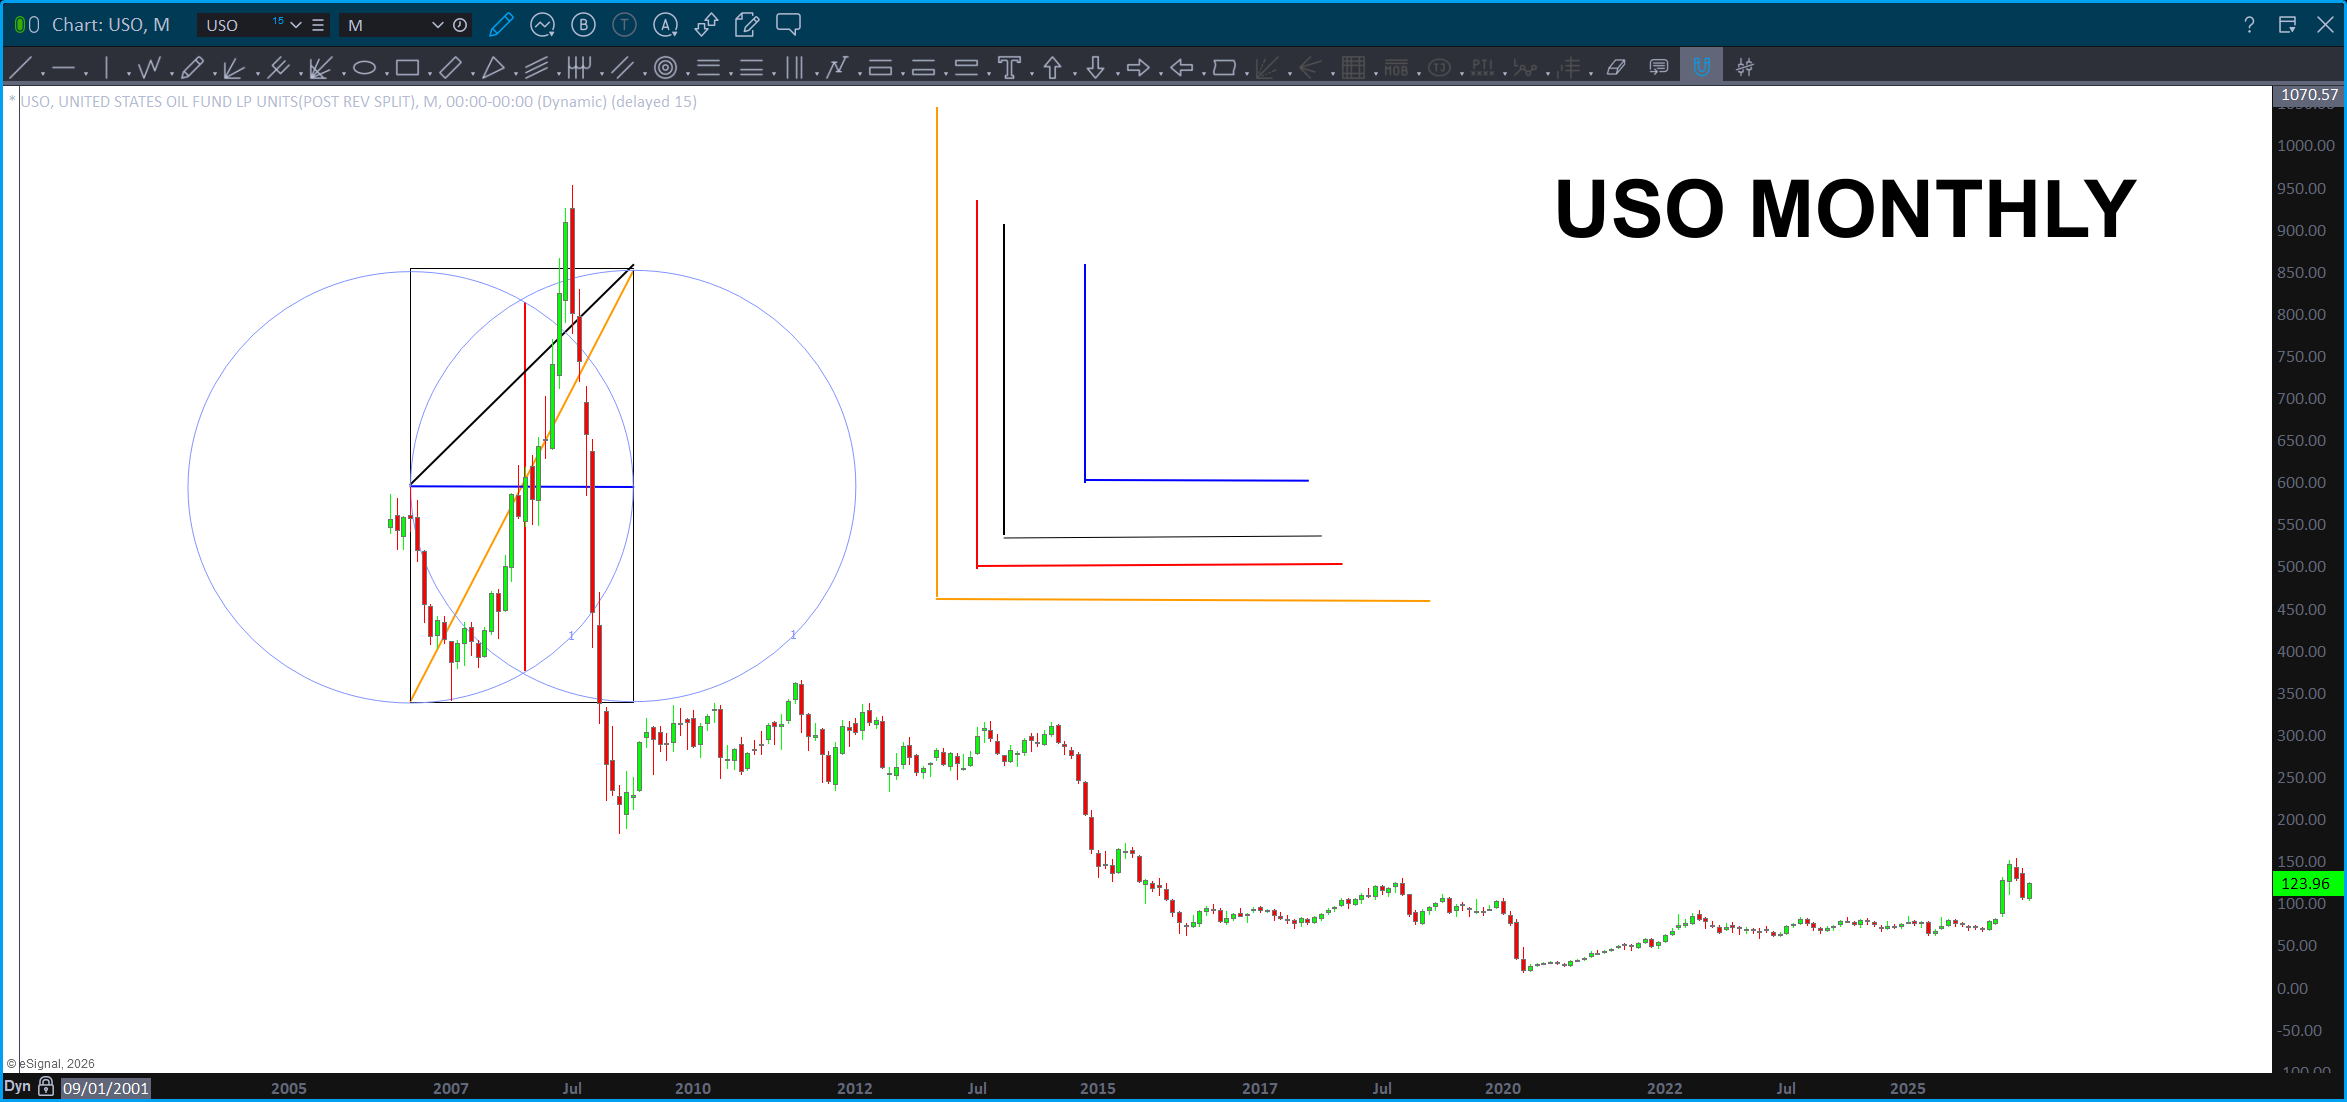
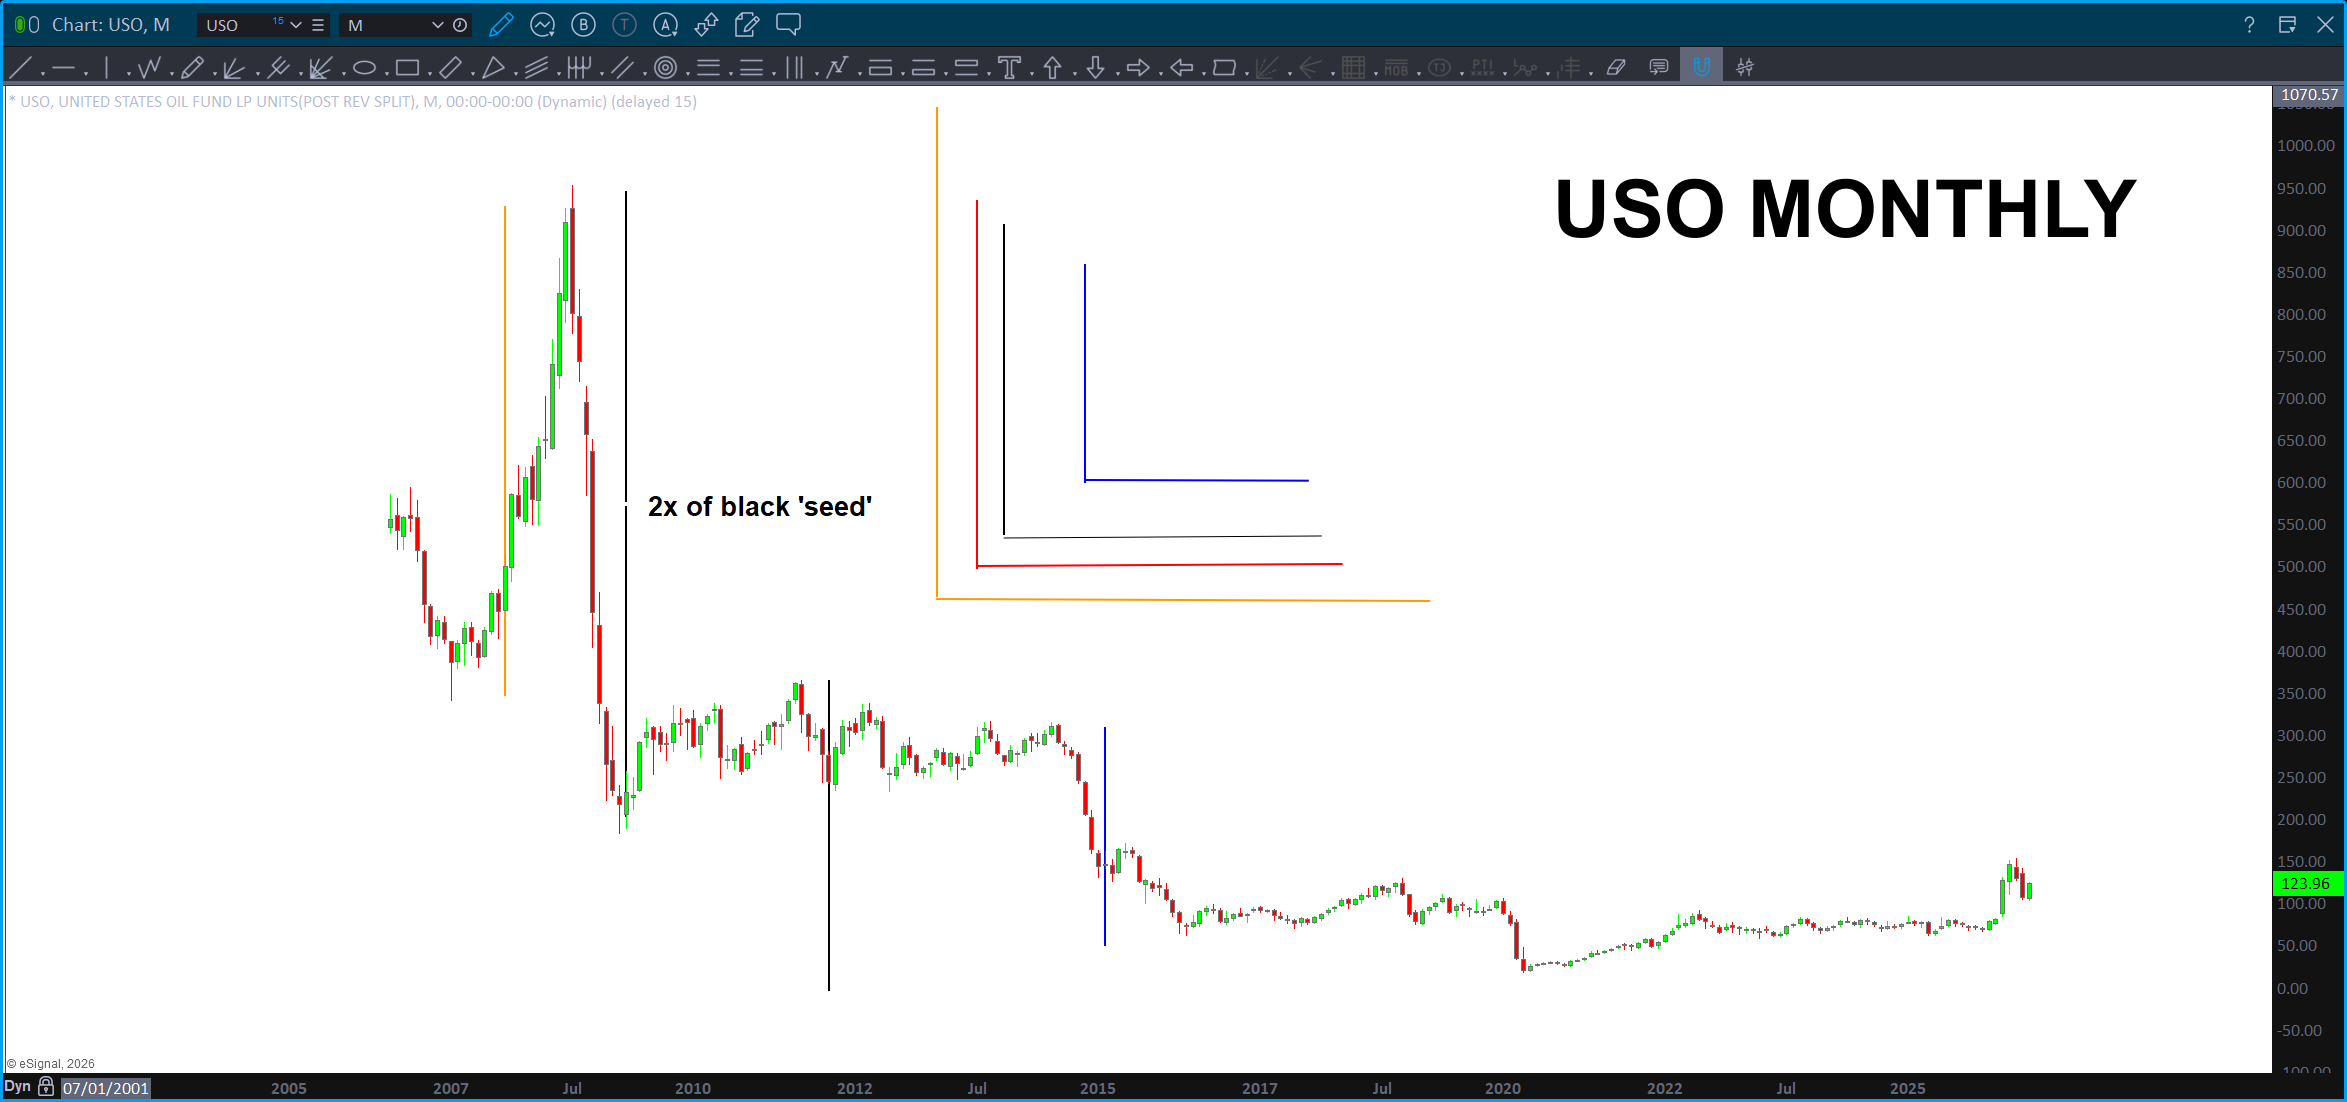
Oh, two crop circles, right next to each other …the first one being on my birthday 7-11. Come on man … 😉
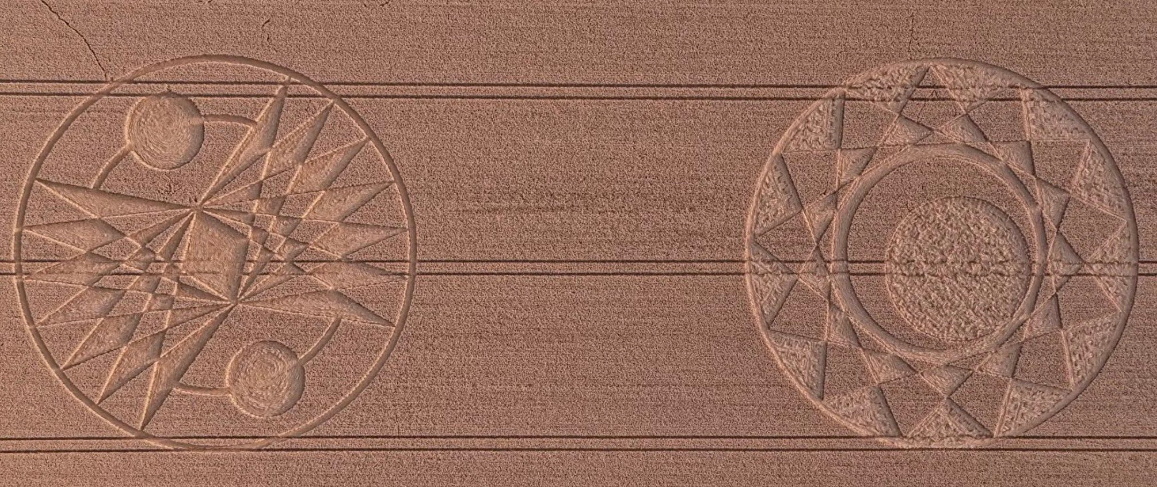
Hmmmmmm … even the very hairs on your head are numbered. 😉
buckle up butter cups …
11, 888 figure it out yet … the ONLY number that Trumped mentioned in his speech on Thursday. Also, right at 33 seconds … 😉
Wakey Wakey Eggs and Bakey
Lithium Update – July 16, 2026
Here are the charts from LIT back two years ago ….

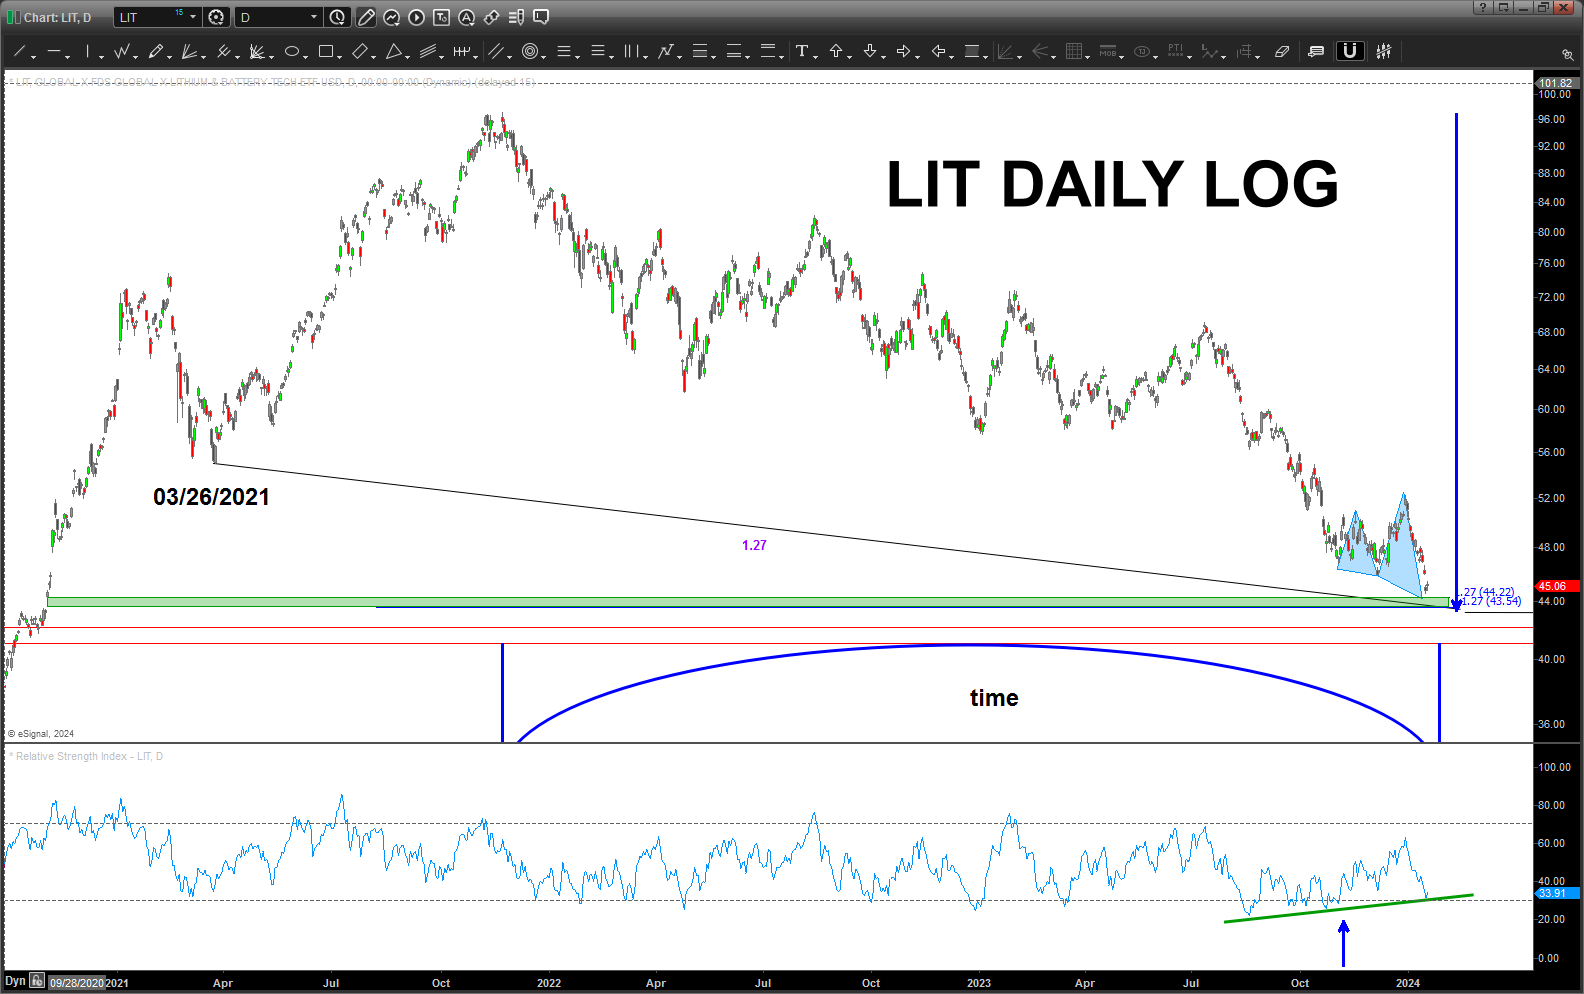
Again, must have been in a rush or just missed it but only used one area for the measured move … it got us in the zone but the exact measured move? Nailed the low …

It went a little below the suggested buy level and was, ultimately the ‘other’ measured move at 67% – exactly. Again, I must have just missed it but there it is. Pretty wild how that works, hugh?
Anyhoo, what you can see above is we have been going down pretty big for the past 3 months. We have a nice pattern of support at the .382 but that big monthly candles begs of caution. So, per below, let it prove to to us. Ultimately, on a monthly, if this is support, it will more than likely be a bounce followed by another wave down. That’s what we want …
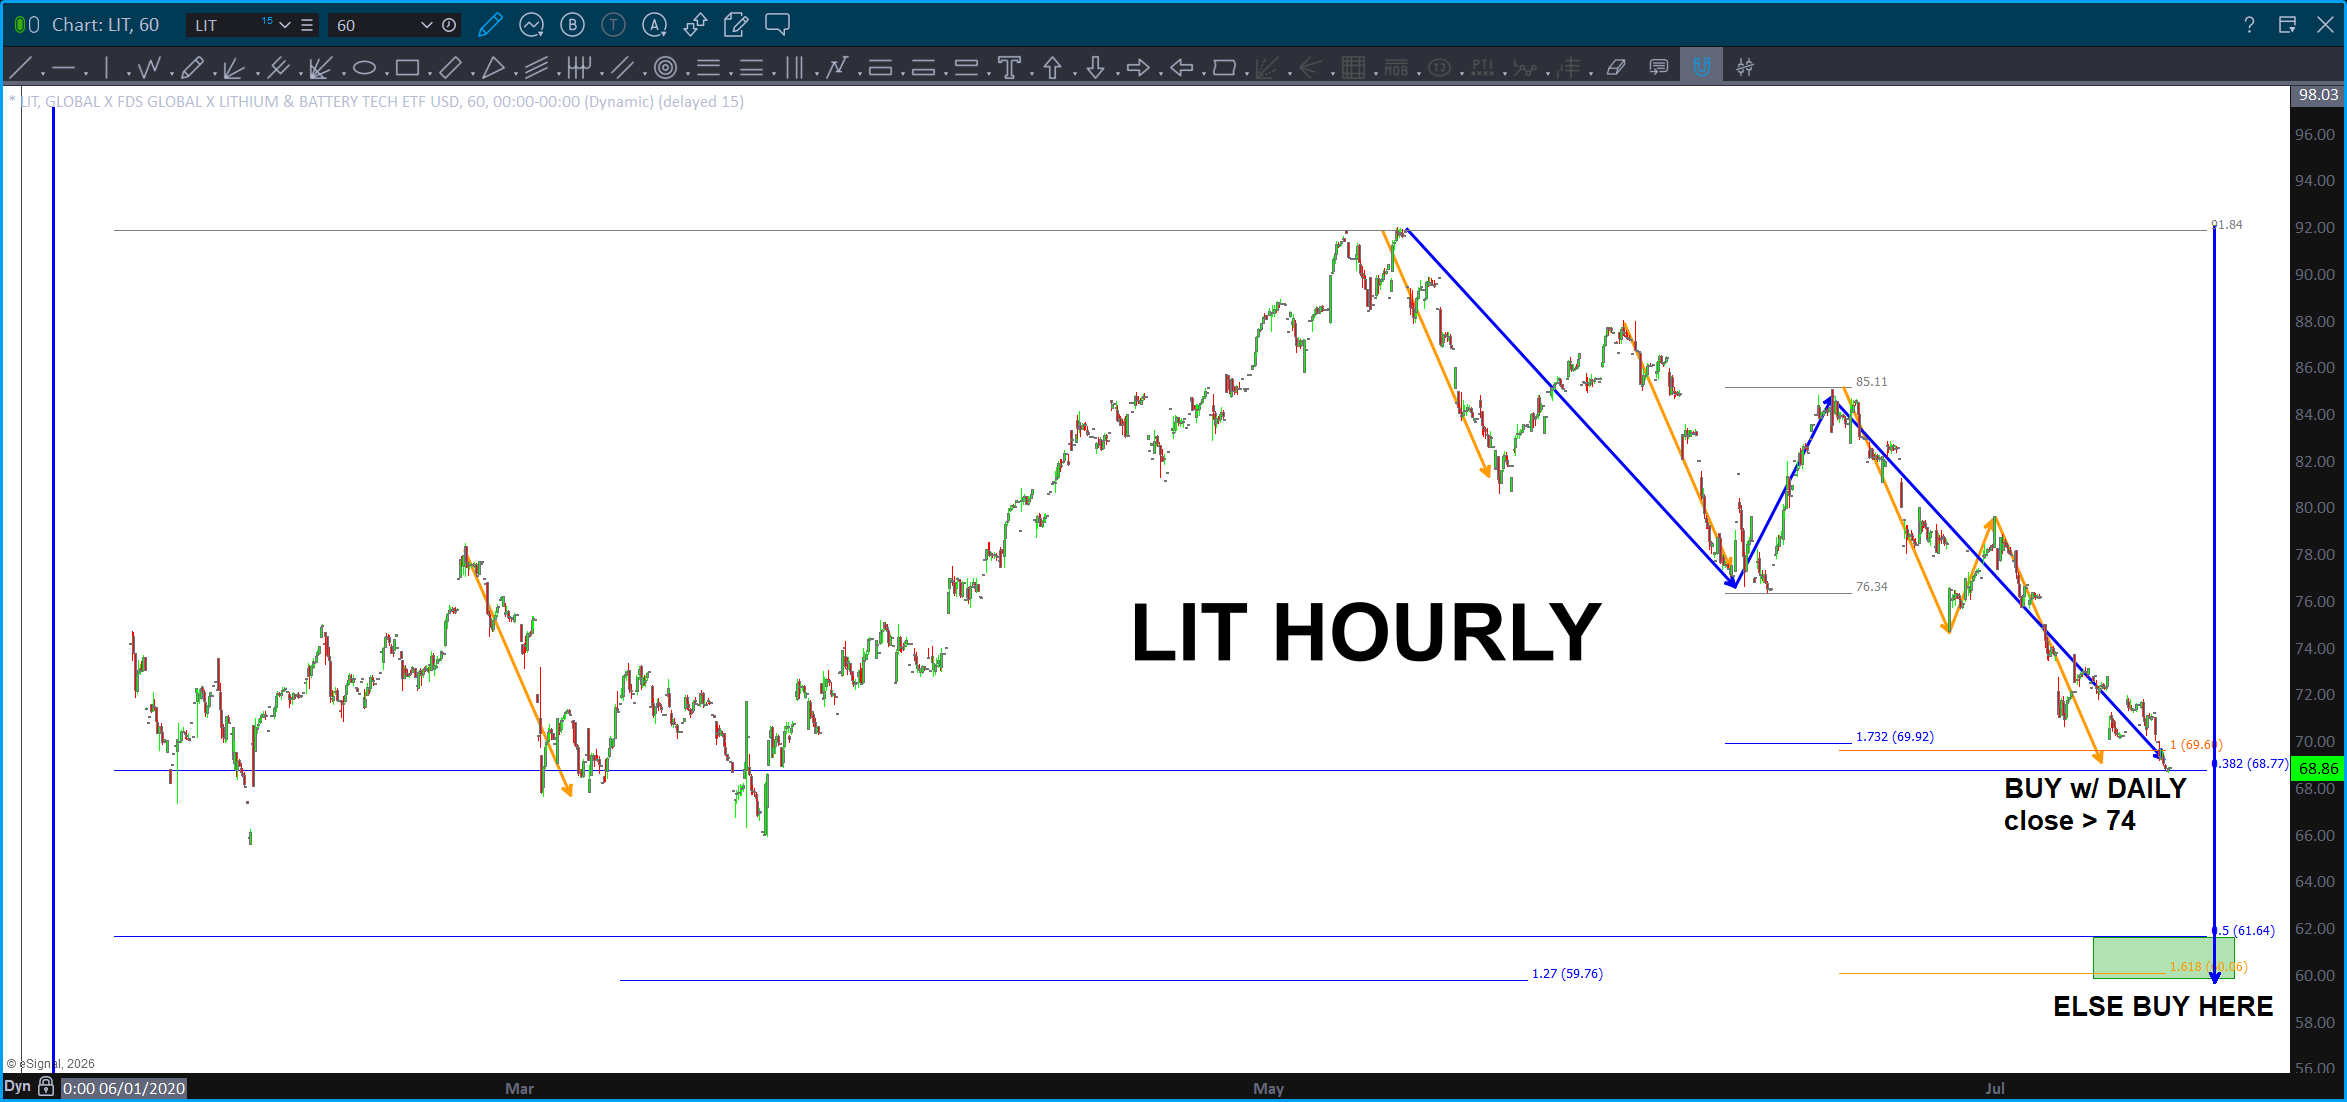

So, on the hourly, it looks like support at the .382 but let’s let it prove it to us …
On the daily you can see a 1.618 price projection that lands right at THE measured move correction w/ the 1.27 extension from the last move right at the 50 percent retracement. We like that so, I’m going to step aside and wait a couple more weeks or months for this correction to fully develop. Which means – I really am not sure what level to buy but I like the lower one because I’m conservative. Ha!
Bart
Global Dow and the Prevost Constant – July 10, 2026

I’m doing some prep work for my talk I do once a month over @stockmarkettv … I’ve been doing the Prolon 5 day fast w/ my ex-girlfriend, Kathy (my amazing wife) and we are biding time to go see Toy Story 5. To pass time and keep my brain from atrophying decided to take a peak at the Global Dow. I get a big protein shake in the morning and meet my son for a surf tomorrow. Swell looks decent so maybe we will catch some waves …
Next year, turn 60 and my goal is to be lying in the Sarcophagus of the Great Pyramid at the EXACT time that I took my first primordial breath. Why?
My birthday is 7-11. This is the relationship of the height/base of the Great Pyramid and the mirror image of 117. 117 being, of course, the resonance frequency of the Sarcophagus.
Also, take note of how close the top is to 7000. It’s basically 99.64% there … 7 being the magical number w/in the Bible, the Master John Dee’s favorite number who, as a matter of fact called himself “Double OO7.” Yeah, no shit … look it up. His partner in crime was Edward Devere the 17th Earl of Oxford. 17th letter of the alphabet being … Q. Who made all the spooky stuff on the Bond movies? Q. OBTW … Princess Dianna was a descendant of Mr. Devere. Also, the “Q-anon” movement, whatever the heck that is. 😉
Ever heard of the D’ver?
The ‘first’ mention that we might understand goes all the way to Solomon’s Temple. Yeah … the D’ver was the word used to describe the primordial vibration that exploded upon us w/ LET THERE BE LIGHT. King Solomon, of the famous Solomon’s Temple on the temple mount built an amazing structure to hold the Arc of the Covenant. The “holy of holies” was entered once/year on Yon Kippur. Interestingly enough … the colors of the cloth that the high priest walked thru to get to the holiest place on earth … red, white and blue. Also, throw a little purple in there … (think Count St. Germane and the purple flame). Go check out Hebrews 9:1-7 (9 number of completion and there’s 17 again. Coincidence, coincidence. ;0)

Actually, the D’ver predates Solomons Temple … really?
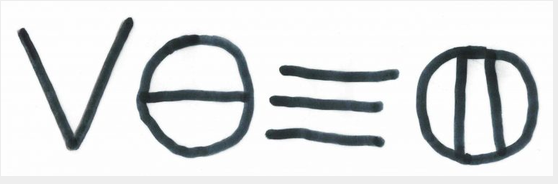
is inscribed to the entrance of the Great Pyramid.

Don’t you find it interesting that one of the mistakes (there are two) on the Declaration of Independence looks like this:
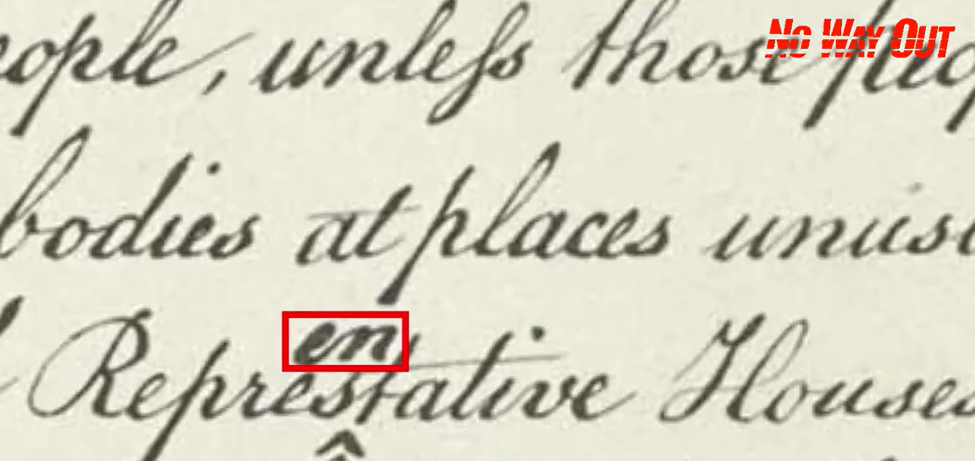
Notice the en in the boxed red but also notice the double chevron below it … same as the Great Pyramid. What do we have here? Coincidence, I know … 😉 (I didn’t do a good enough job cutting the video from our podcast w/ Alan) but you get the point.
So, anyway, we have the D’ver mentioned w/in the description of the Solomon’s Temple but what the heck is the inscription in from the Great Pyramid?

Do you see where I am leading us …?
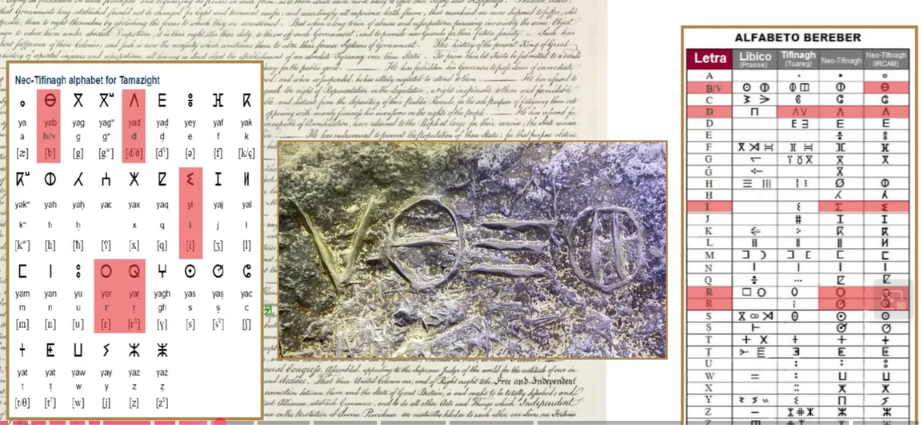
Literally, there was on archeologist that had the knowledge to decode this ANCIENT inscription that met you as one entered the Great Pyramid. Again, look it up … what possibly could this mean?

Yeah … um. Sit with that ….LONG before Solomon’s Temple housed the holies of holies, the Ark of the Covenant, inscribed in an ancient language of Amazigh that goes back 3000-5000 years had an understanding of the D’ver or the initial OHM that created this entire thing from Genesis 1:3. (note – that ‘3 in 1’ or ‘111’ will come into play, later, but for now, I’m running out of time to go see Toy Story. Kind of wild that I’m typing about ancient languages, the D’ver and the nature of reality but need to go see Toy Story? Must be the fasting?)
Anyhoooo ….
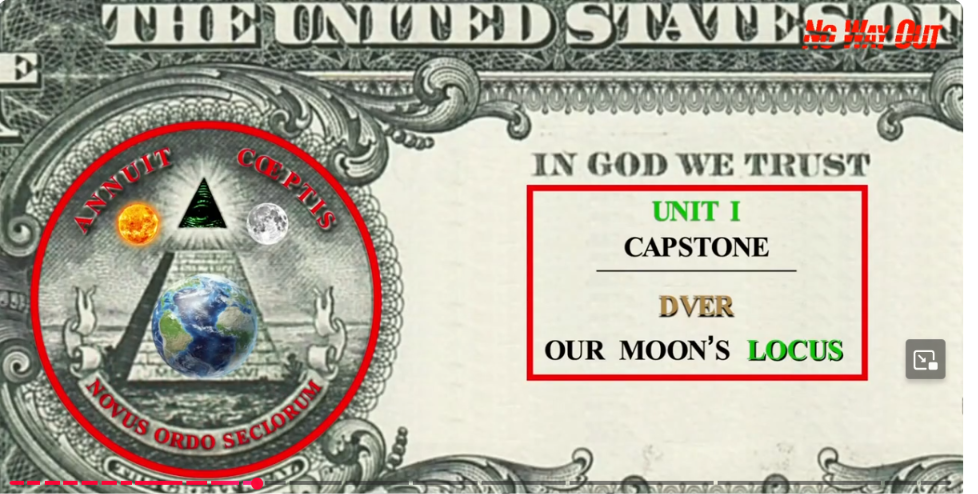
Well, would you look at that … the back of the Dollar Bill was an annagram! And, there, was encrypted the D’ver.
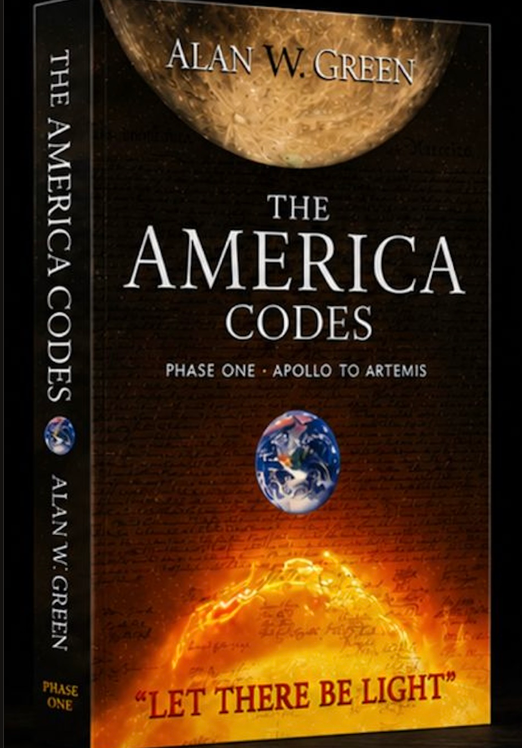
The above information is ALL discovered by my friend and author of the America Codes, Mr. Alan W. Green. An amazing joyful chap with an infectious laugh and the mind of THE master engineer.
Off to see Toy Story and try to remain grounded in this 3D matrix of consciousness and polarity.
59 amazing years man … I’m just getting started.

SURF LIVE. Love you all …
James Anthony Bartelloni …
Japan – July 7, 2026

The yen is worth watching right now, and not just for FX traders. USD/JPY is sitting near 40-year lows even after the Bank of Japan hiked its policy rate to 1.00%, and Tokyo has been openly threatening intervention to stem the slide. That weakness has fueled a massive yen carry trade — investors borrowing cheap yen to fund bets on US tech stocks — with speculative short positions on the yen near multi-year highs. If the yen snaps back sharply, that trade unwinds fast, forcing a rush to sell US equities to repay yen loans, echoing the July 2024 episode when a BOJ hike triggered a global risk-asset selloff in a matter of days. There’s a slower-burning version of the same story in bonds: as JGB yields rise toward levels not seen since the 1990s, Japanese banks, insurers, and pension funds — who collectively hold about $1 trillion in Treasuries — have less reason to keep recycling savings into US debt, and even a gradual pullback could add 15-25 bps of upward pressure on 10-year Treasury yields over the next year or so. Put together, Japan’s policy normalization is a genuine cross-asset risk for US markets: a fast channel through equity-market carry-trade unwinds, and a slow channel through rising Treasury yields and tighter financial conditions.
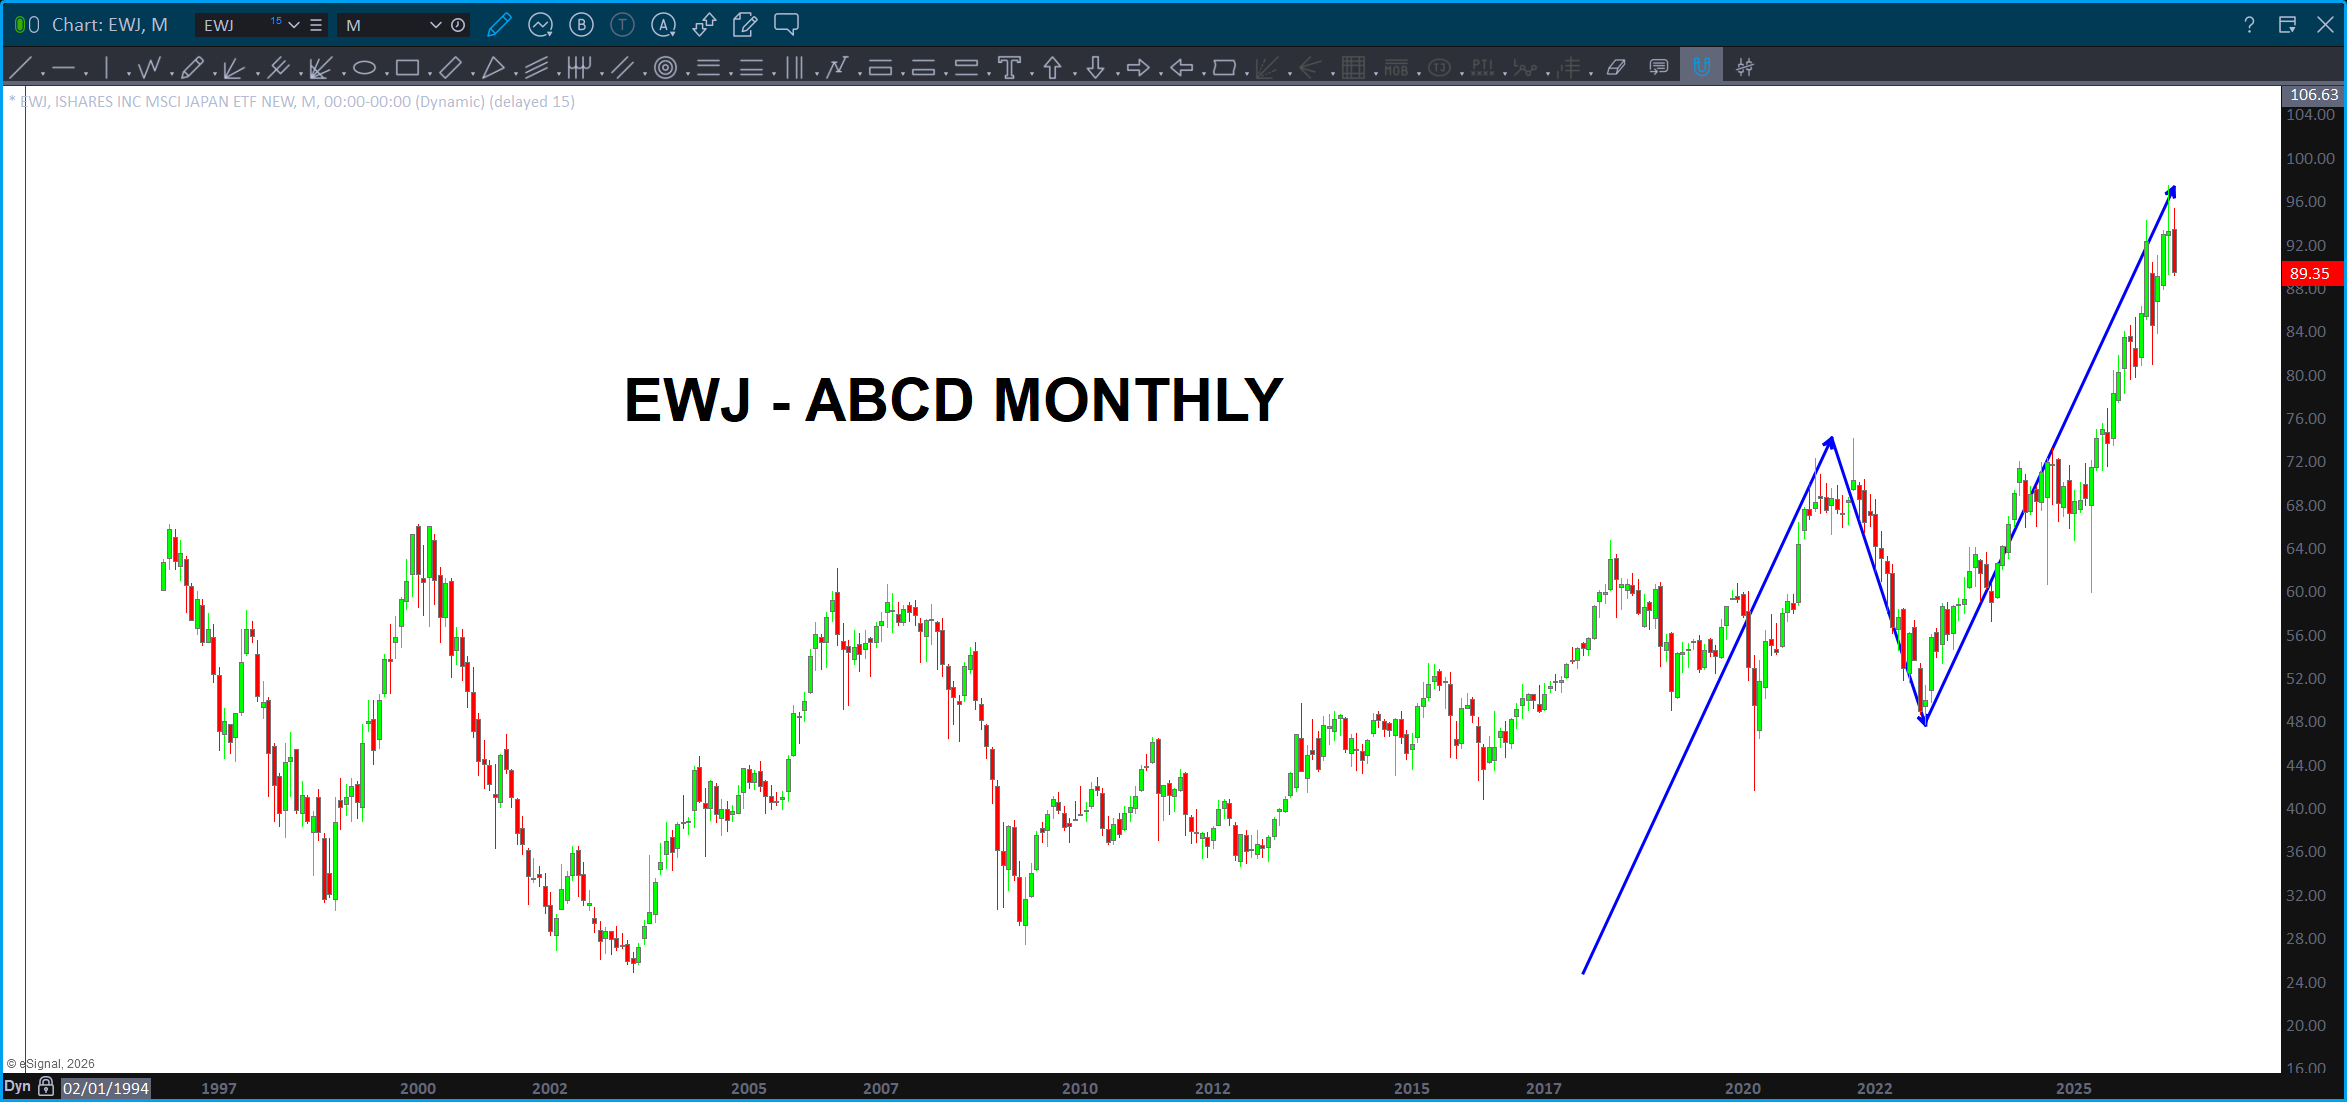
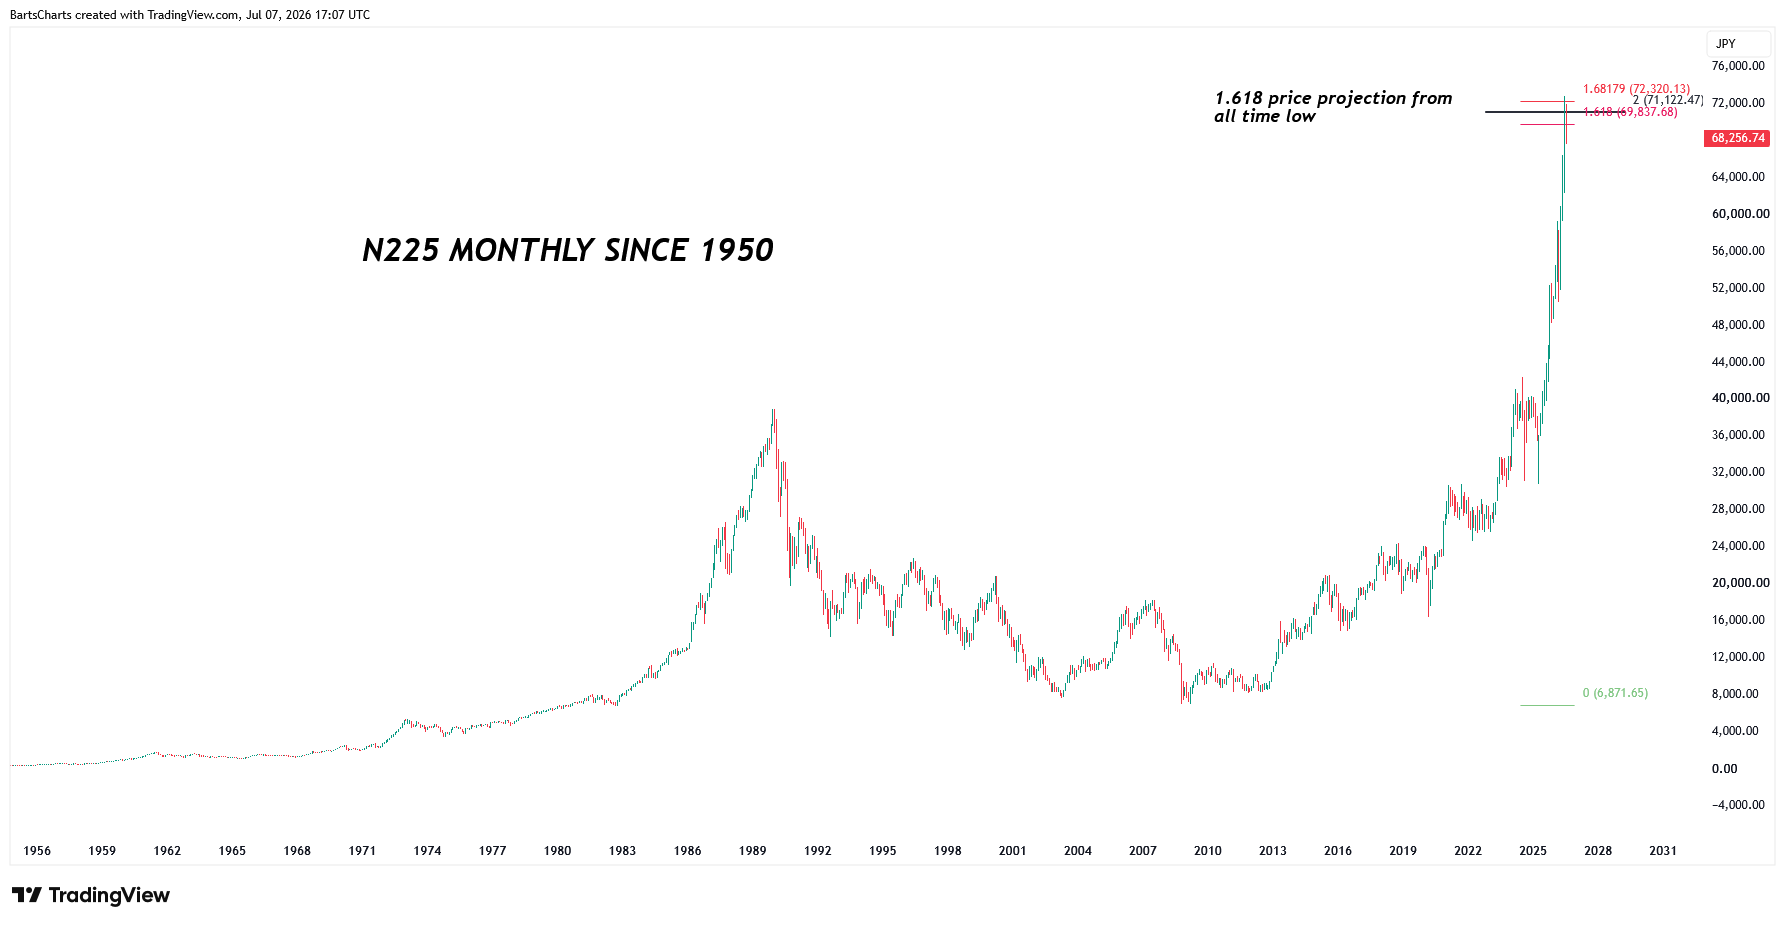
Here is the Nikkei 225 – smacked right into the 1.618 projection from the all time low … folks, this is a projection from 75+ years ago. SHOULD be big resistance.
Here’s the EWJ and YCS:
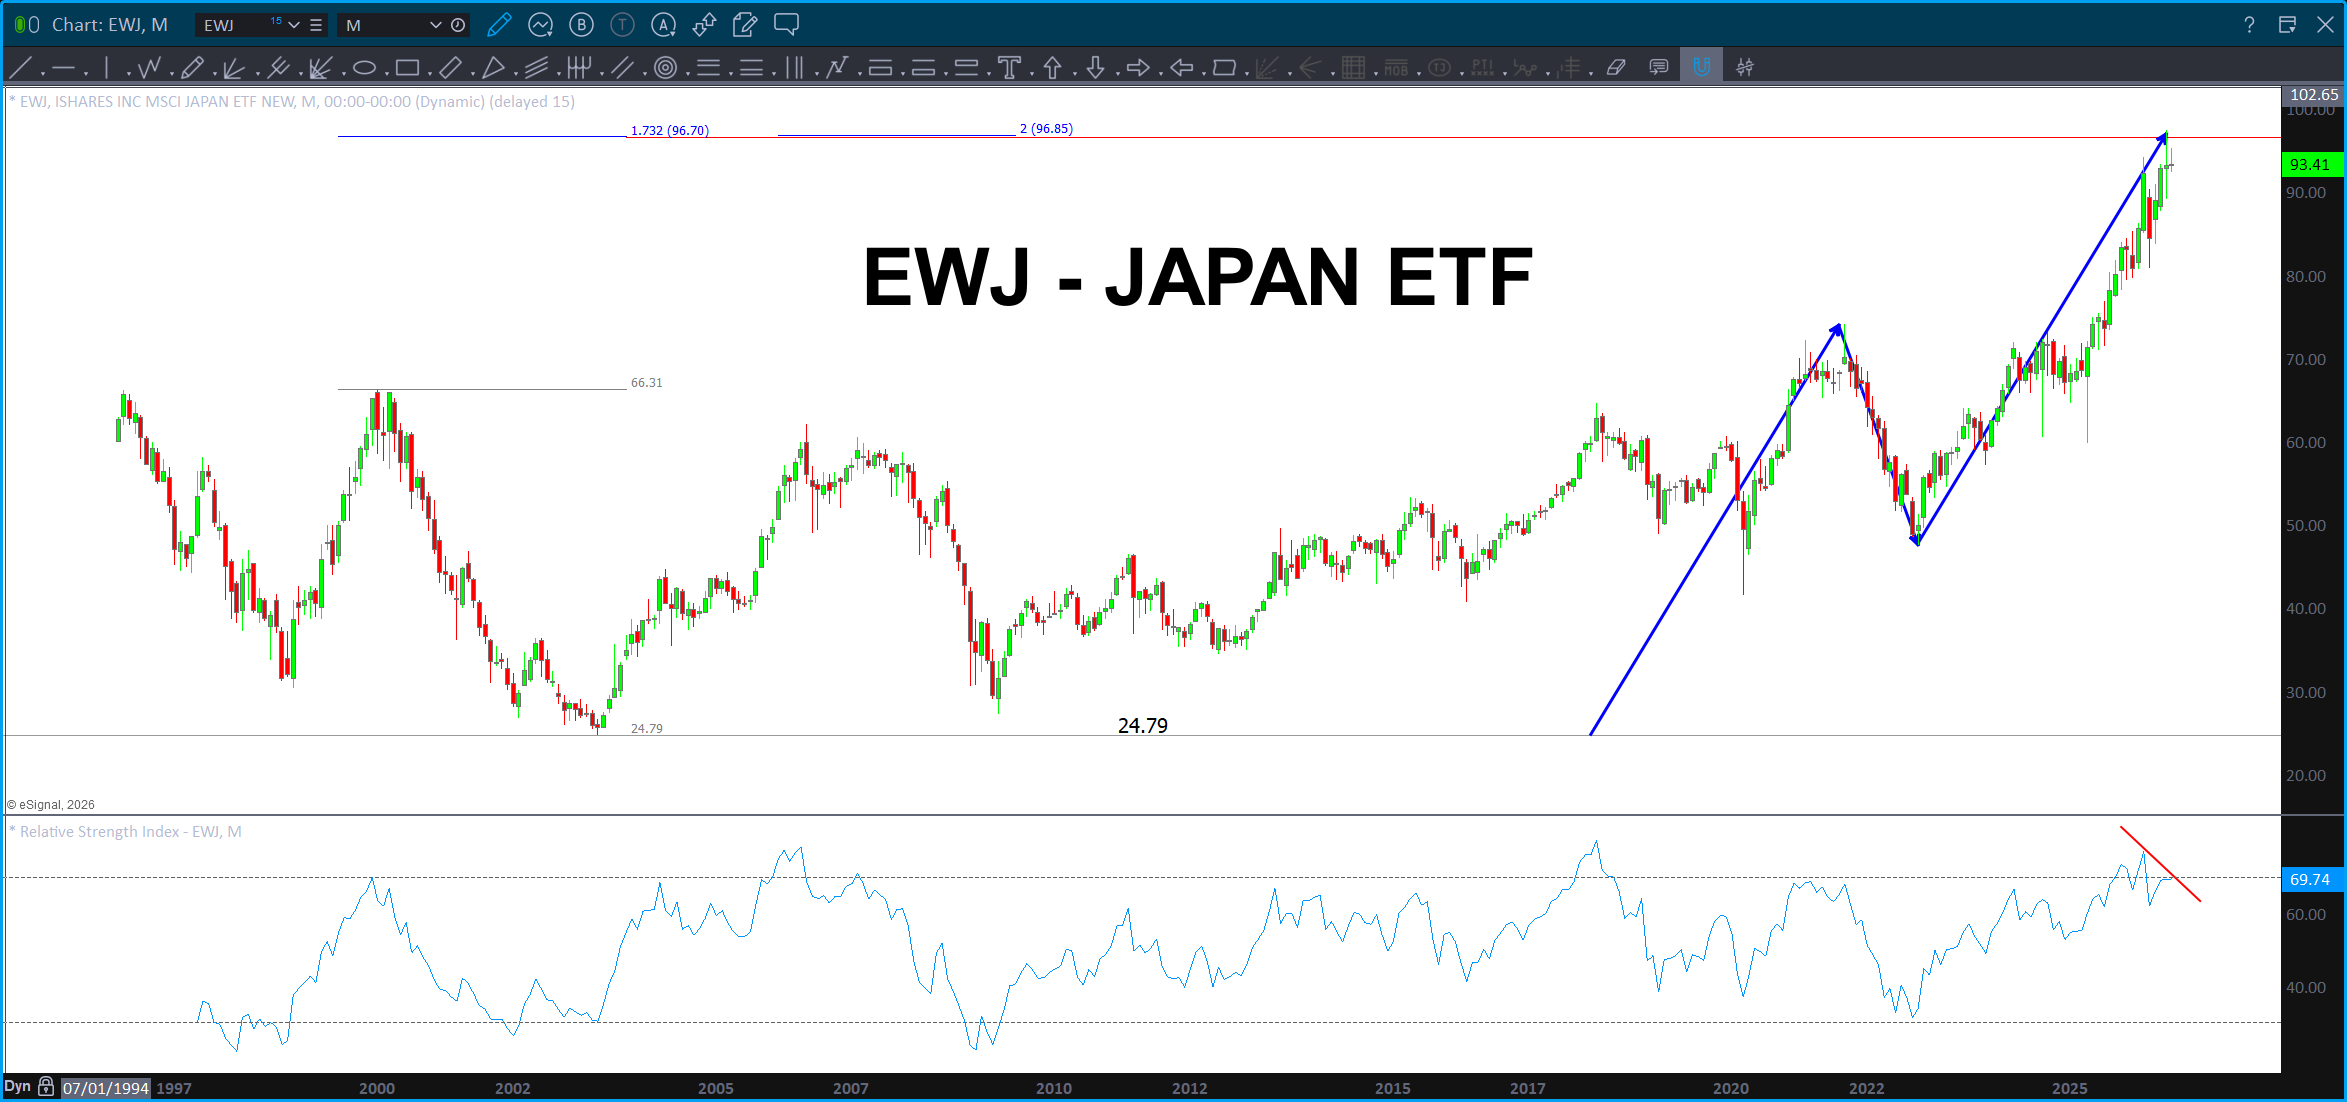
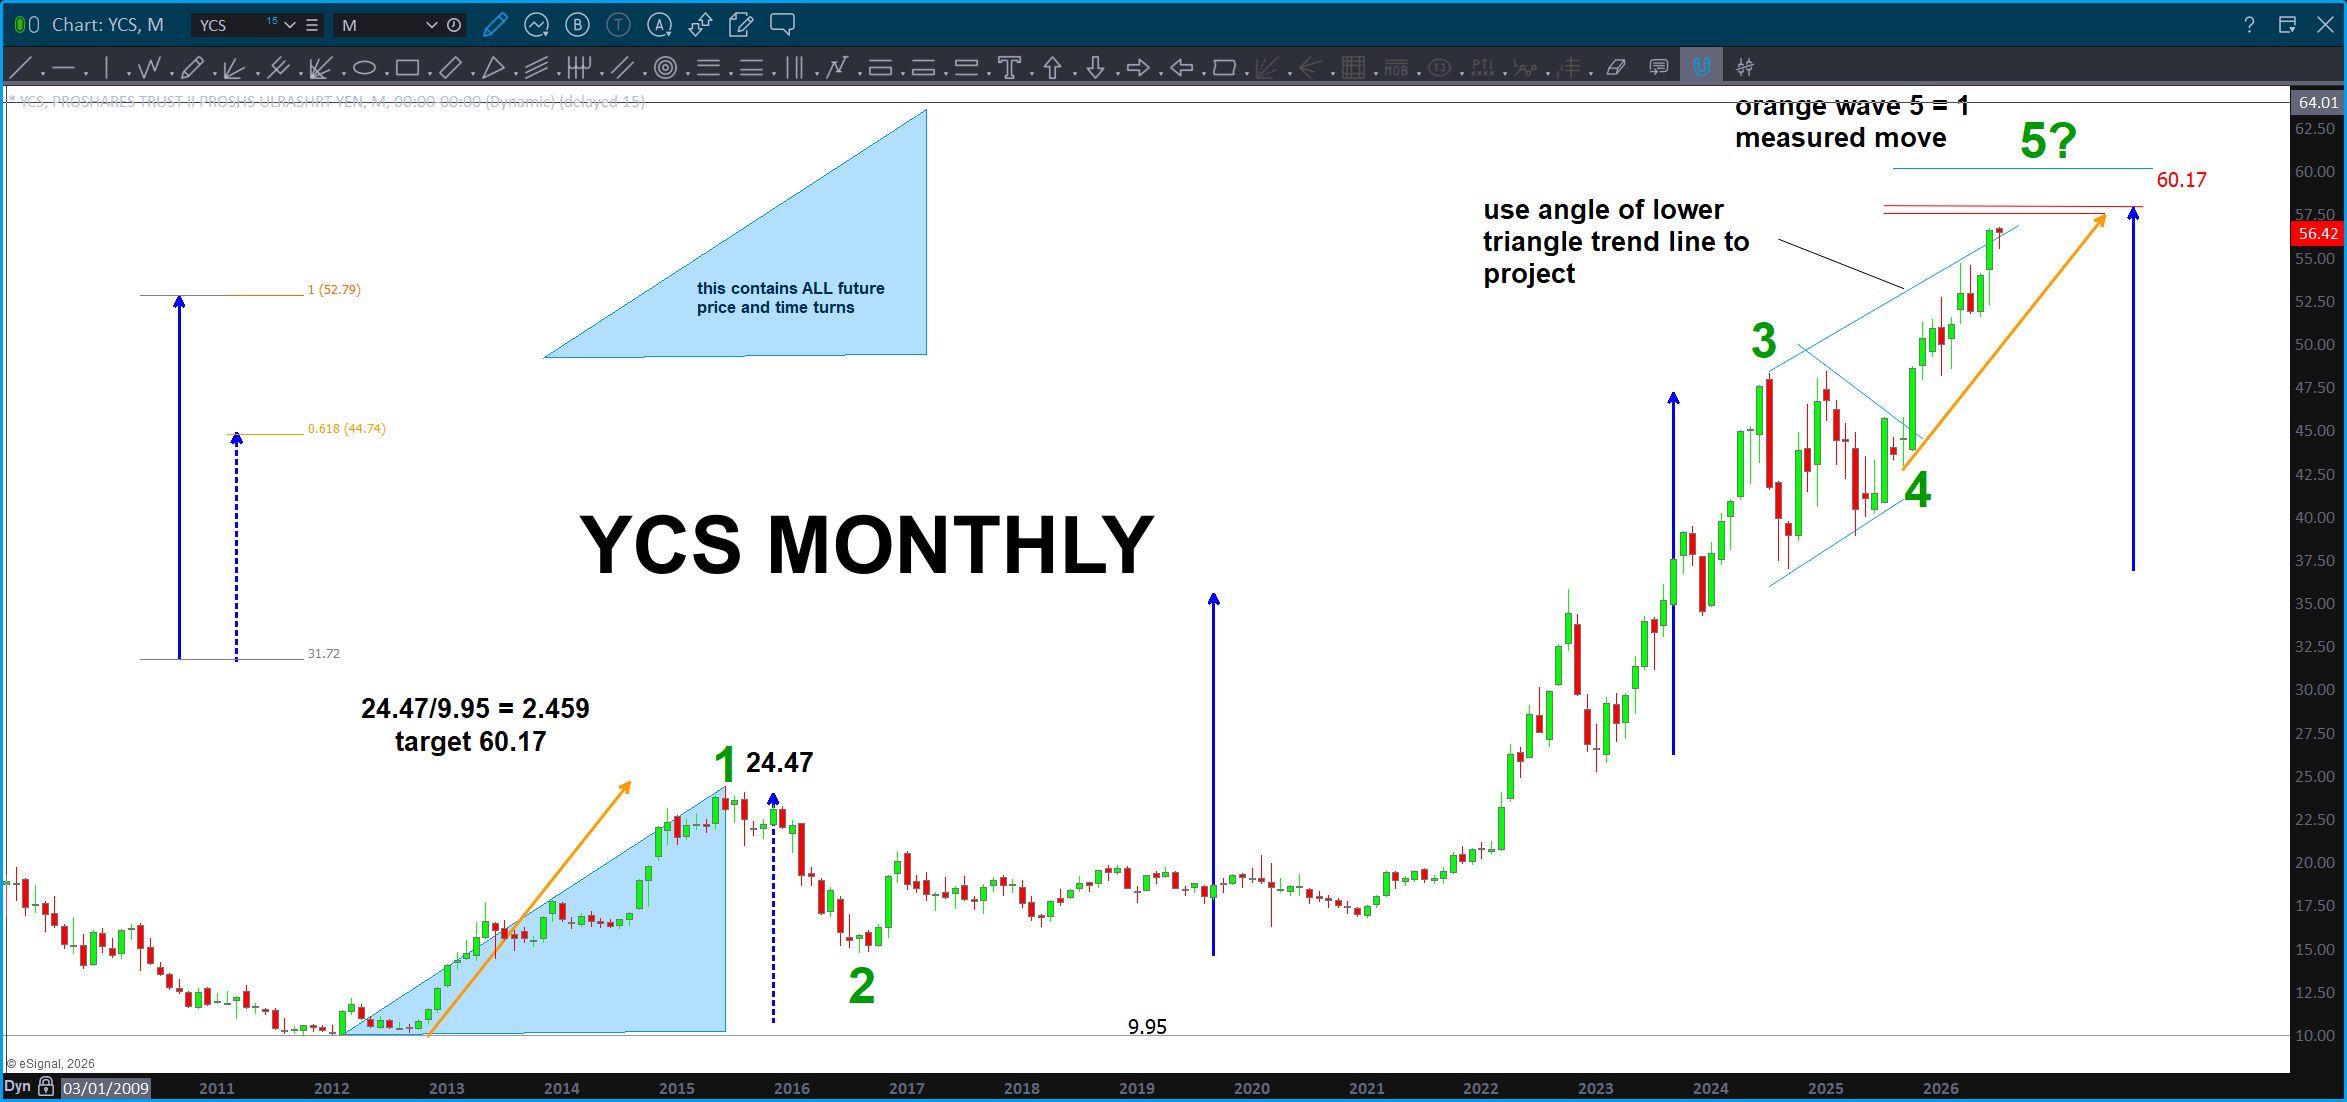
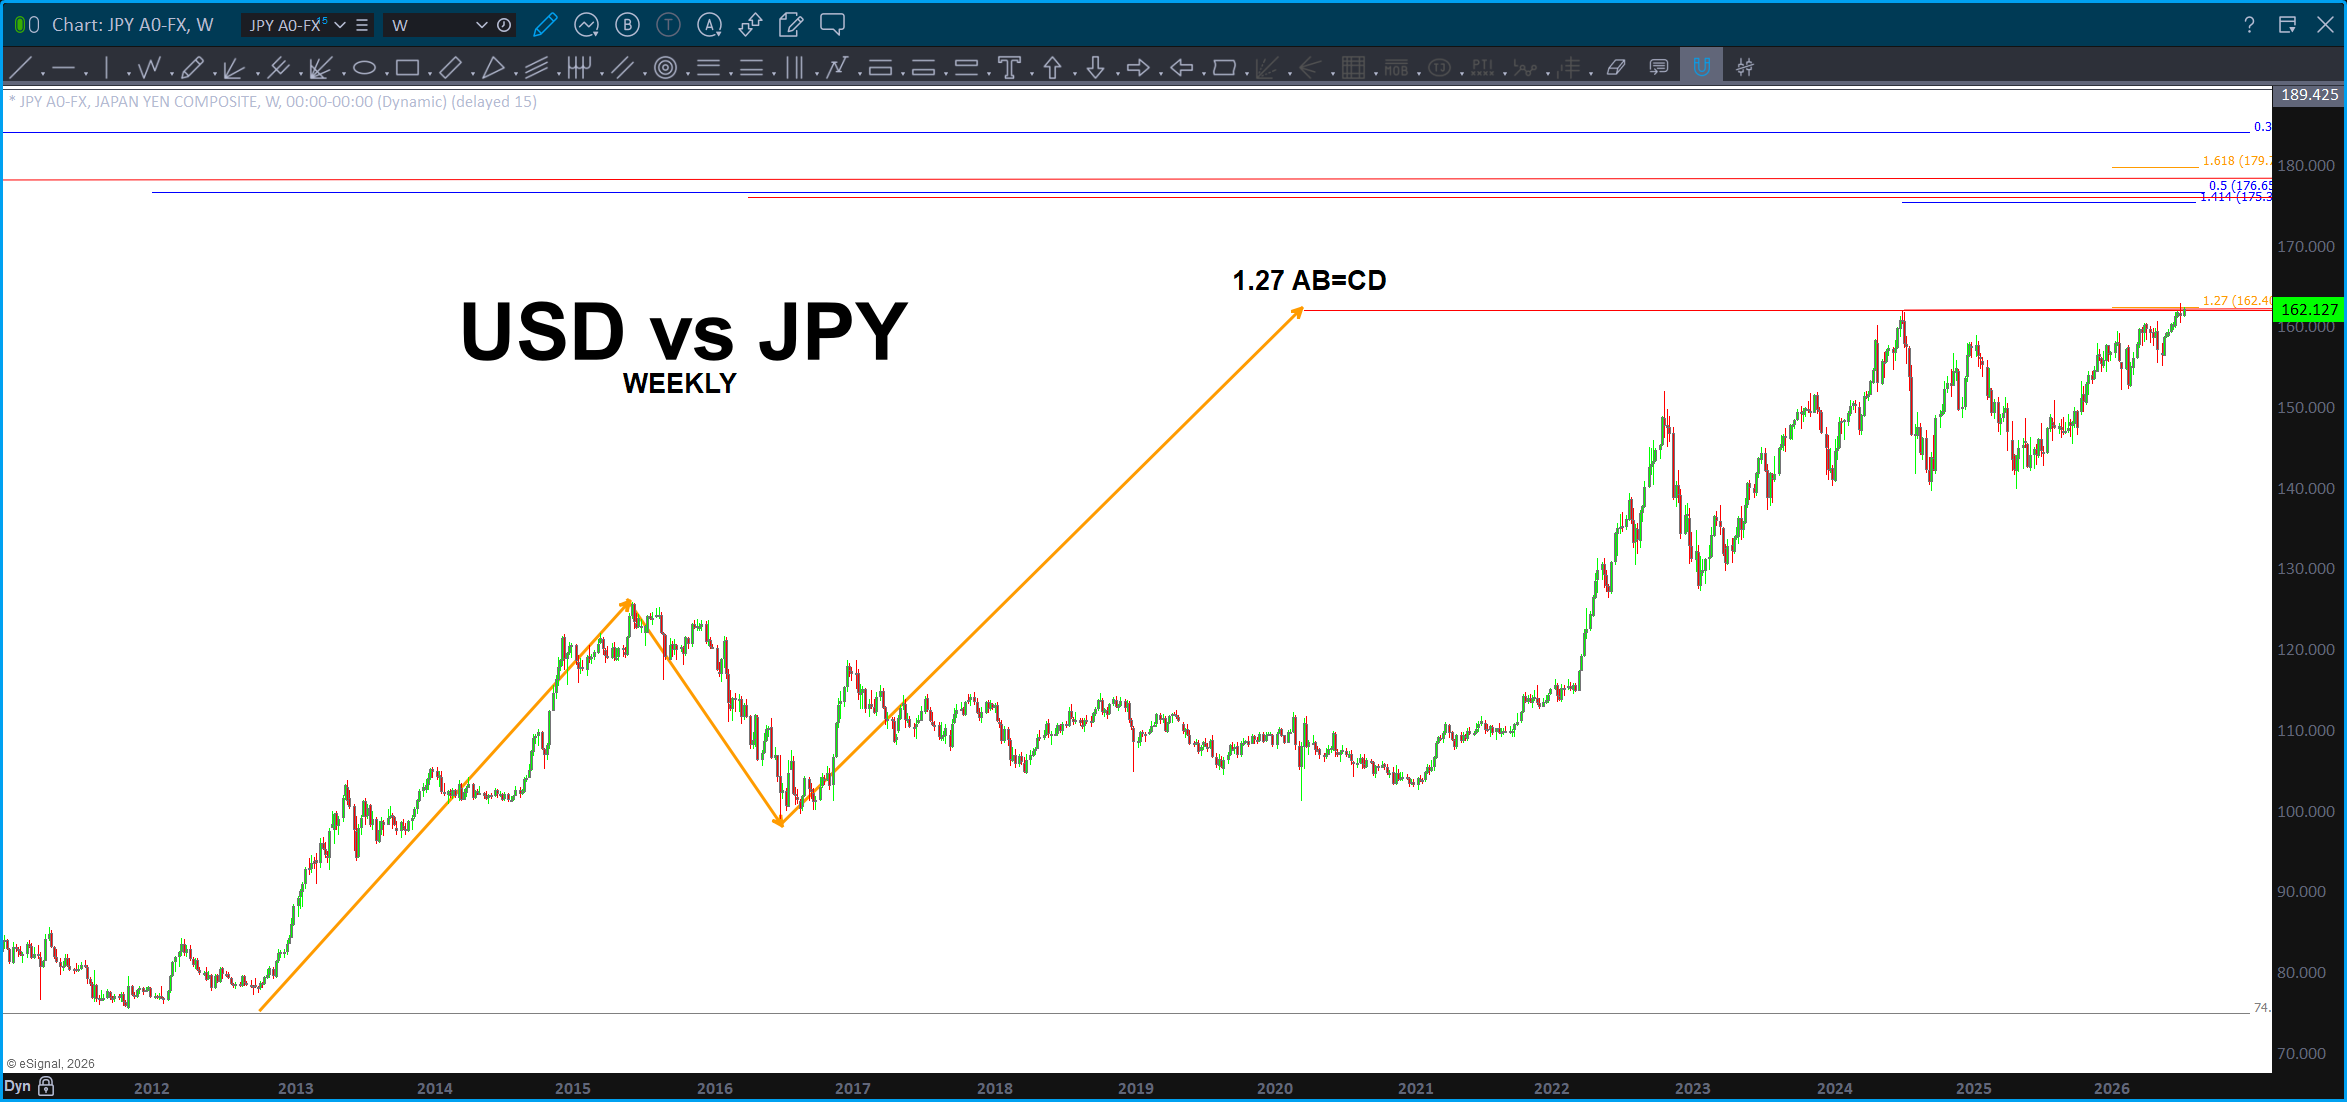
Then, the big player, the YEN vs the USD. Folks, remember, the FX world is the apex predator of the financial world … just think of the FX market as the killer whale.
We ID’d a resistance level back in April and, surprisingly, it’s just been taken out to the upside by just a little bit …
Depending on the moves (or not) w/ the BOJ there is also a VERY strong resistance zone higher, keep that in mind:
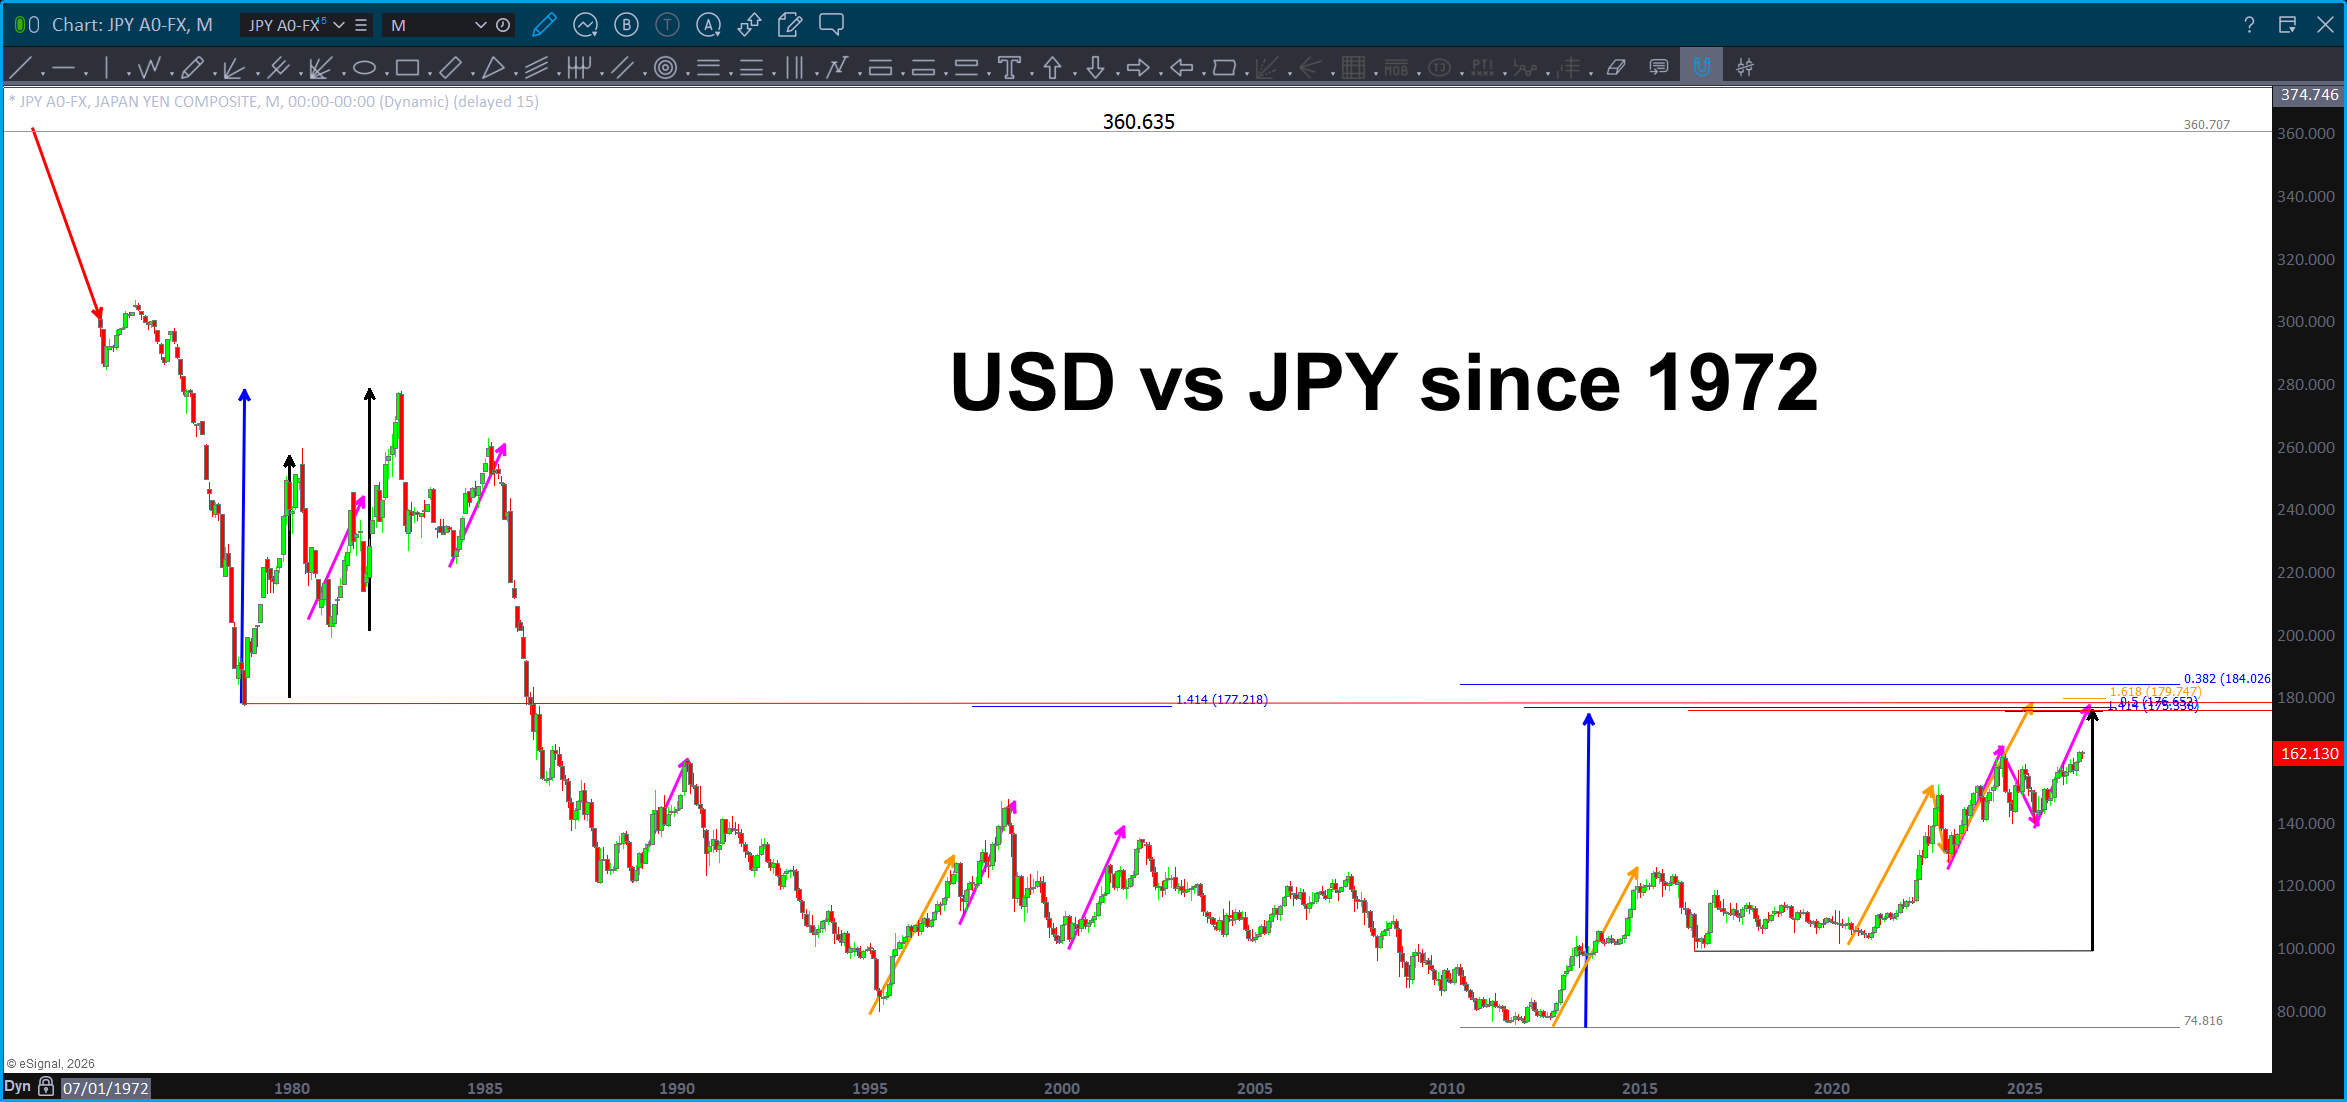
Tons of confluence a little higher BUT … are we going to make it there?
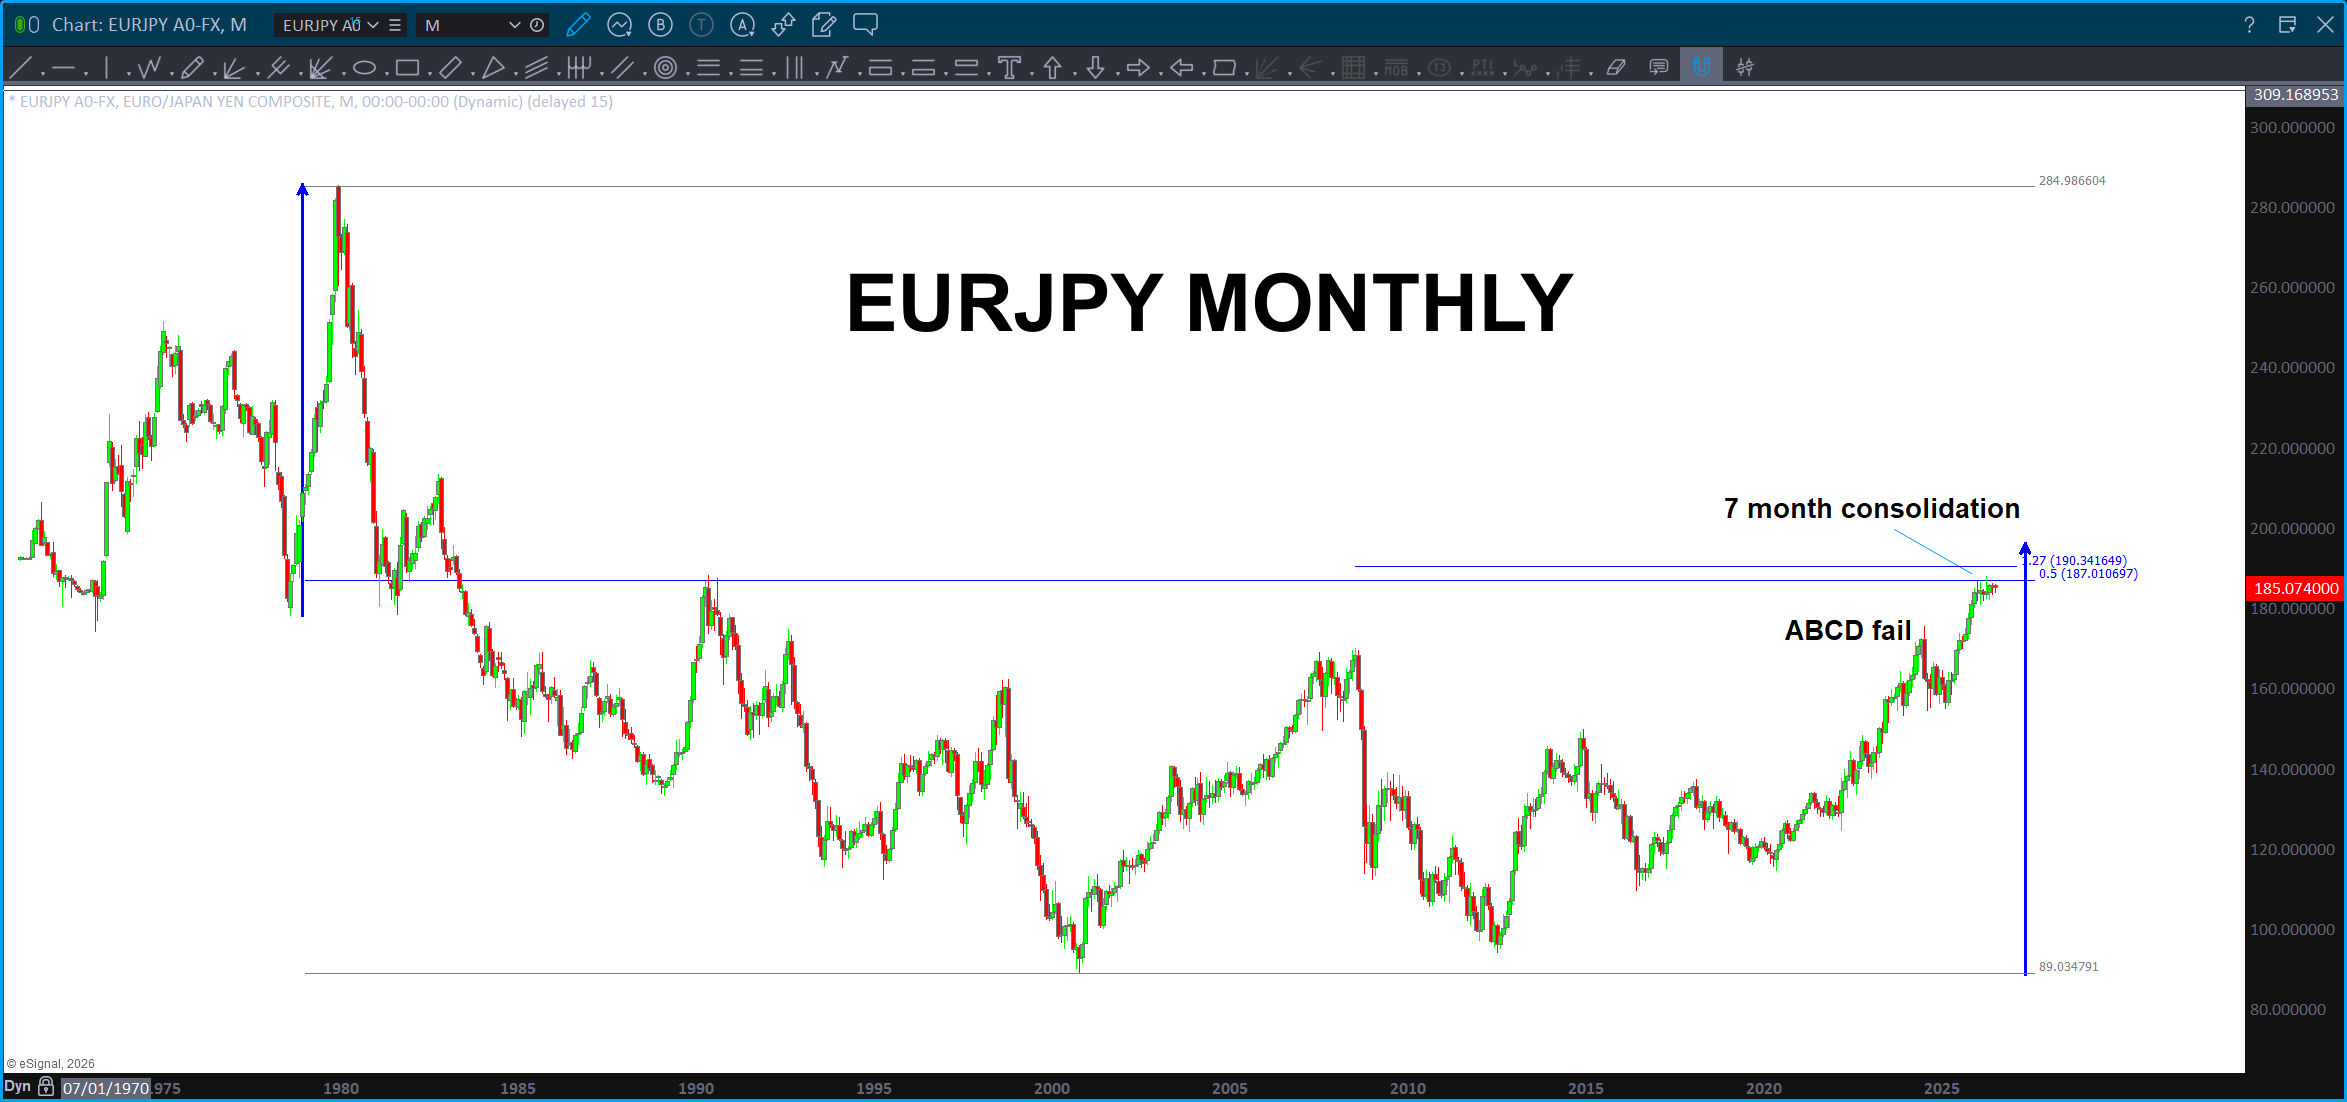
EURJPY reacted, initially, w/ the ABCD and it was literally a day or so prior to the rate announcement – however – it has run into strong resistance and has been sitting ‘waiting’ for 7 months.
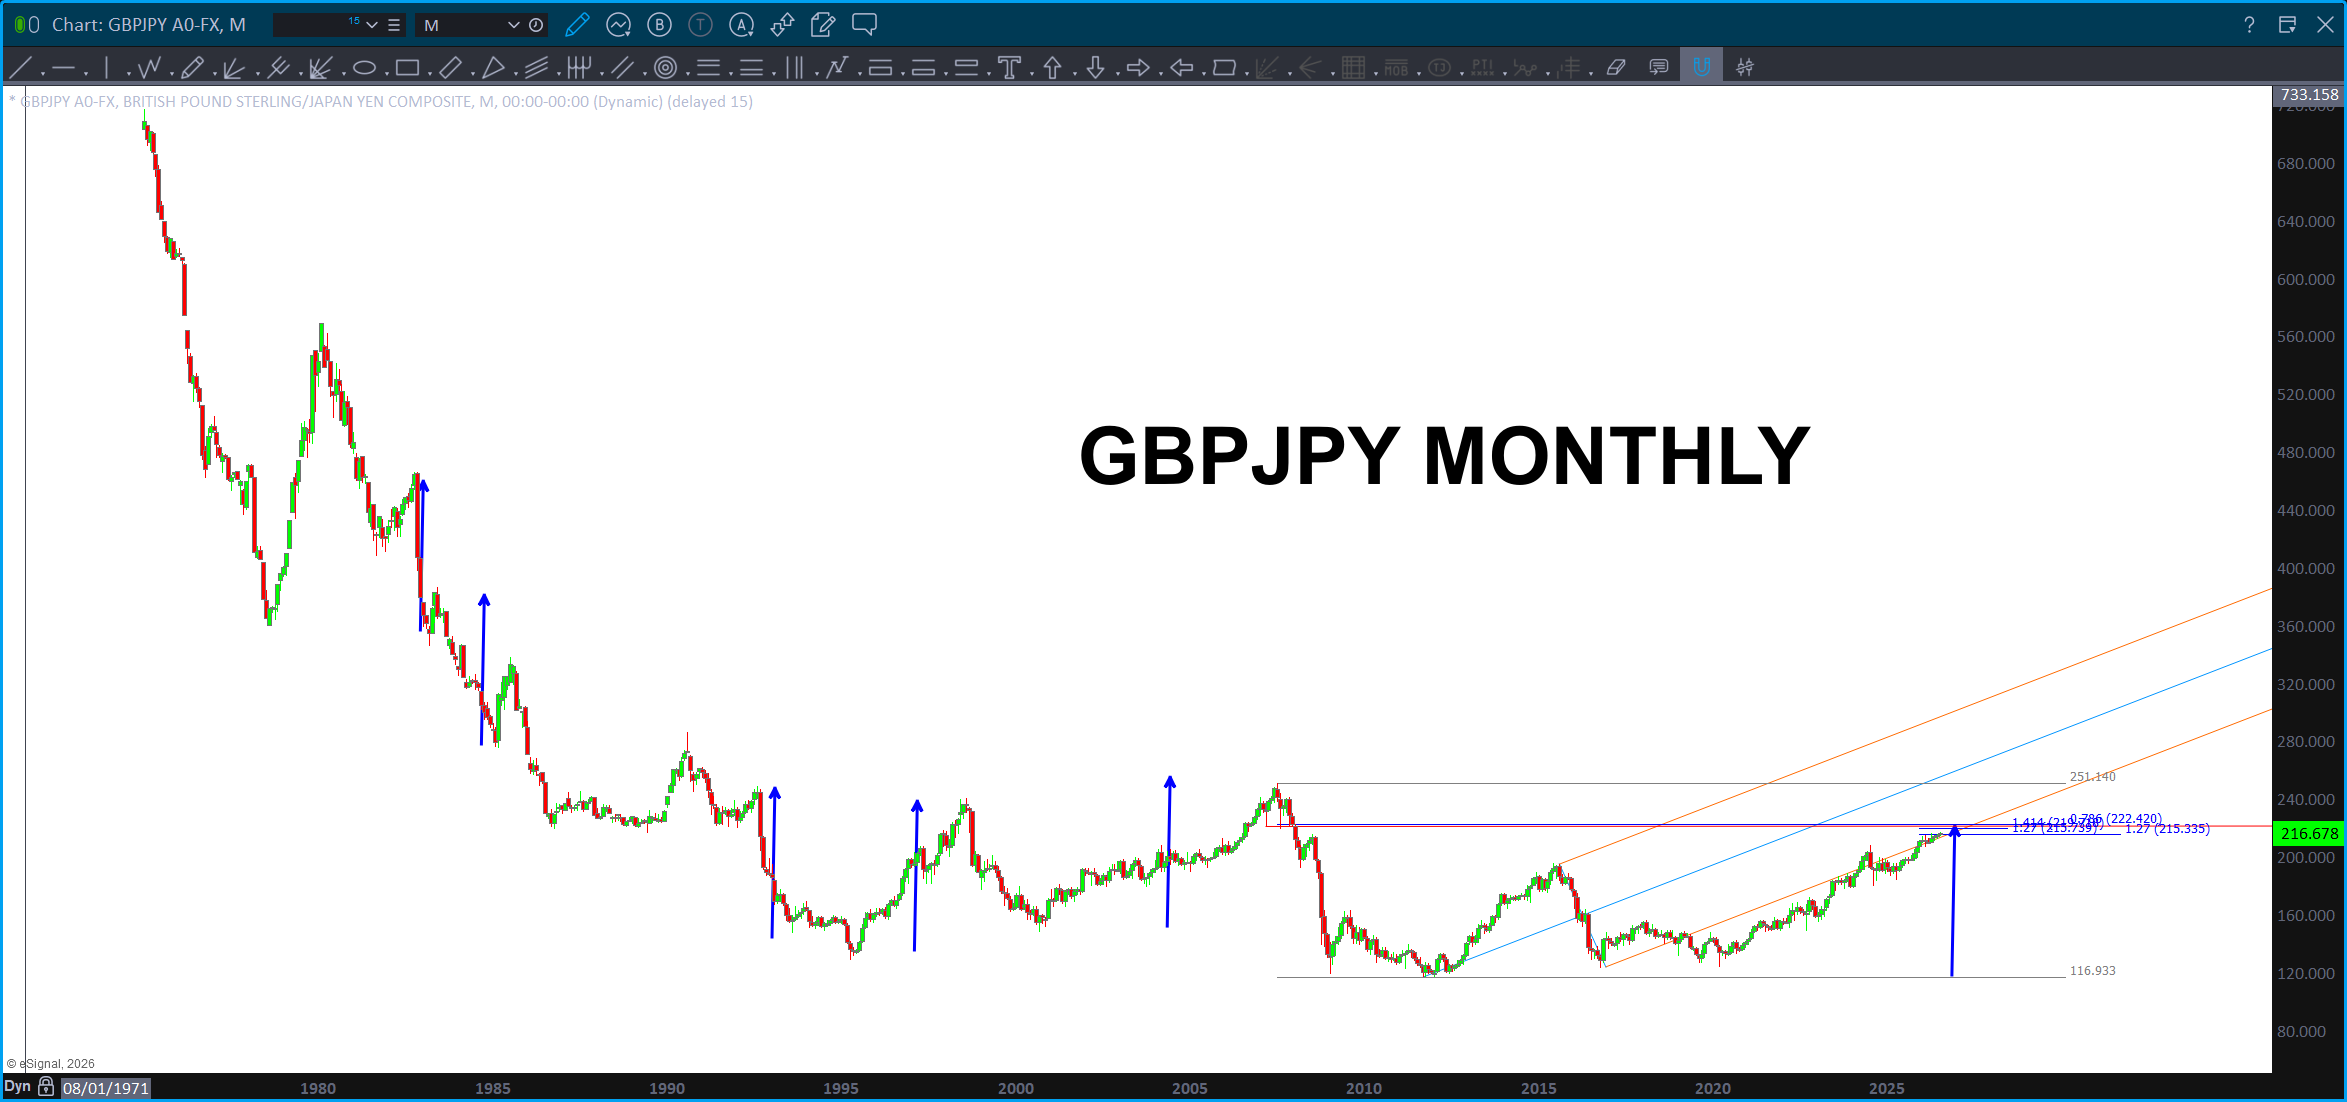
GBPJPY – reacted to the pattern but has since gone higher but, again, is smacking into resistance.
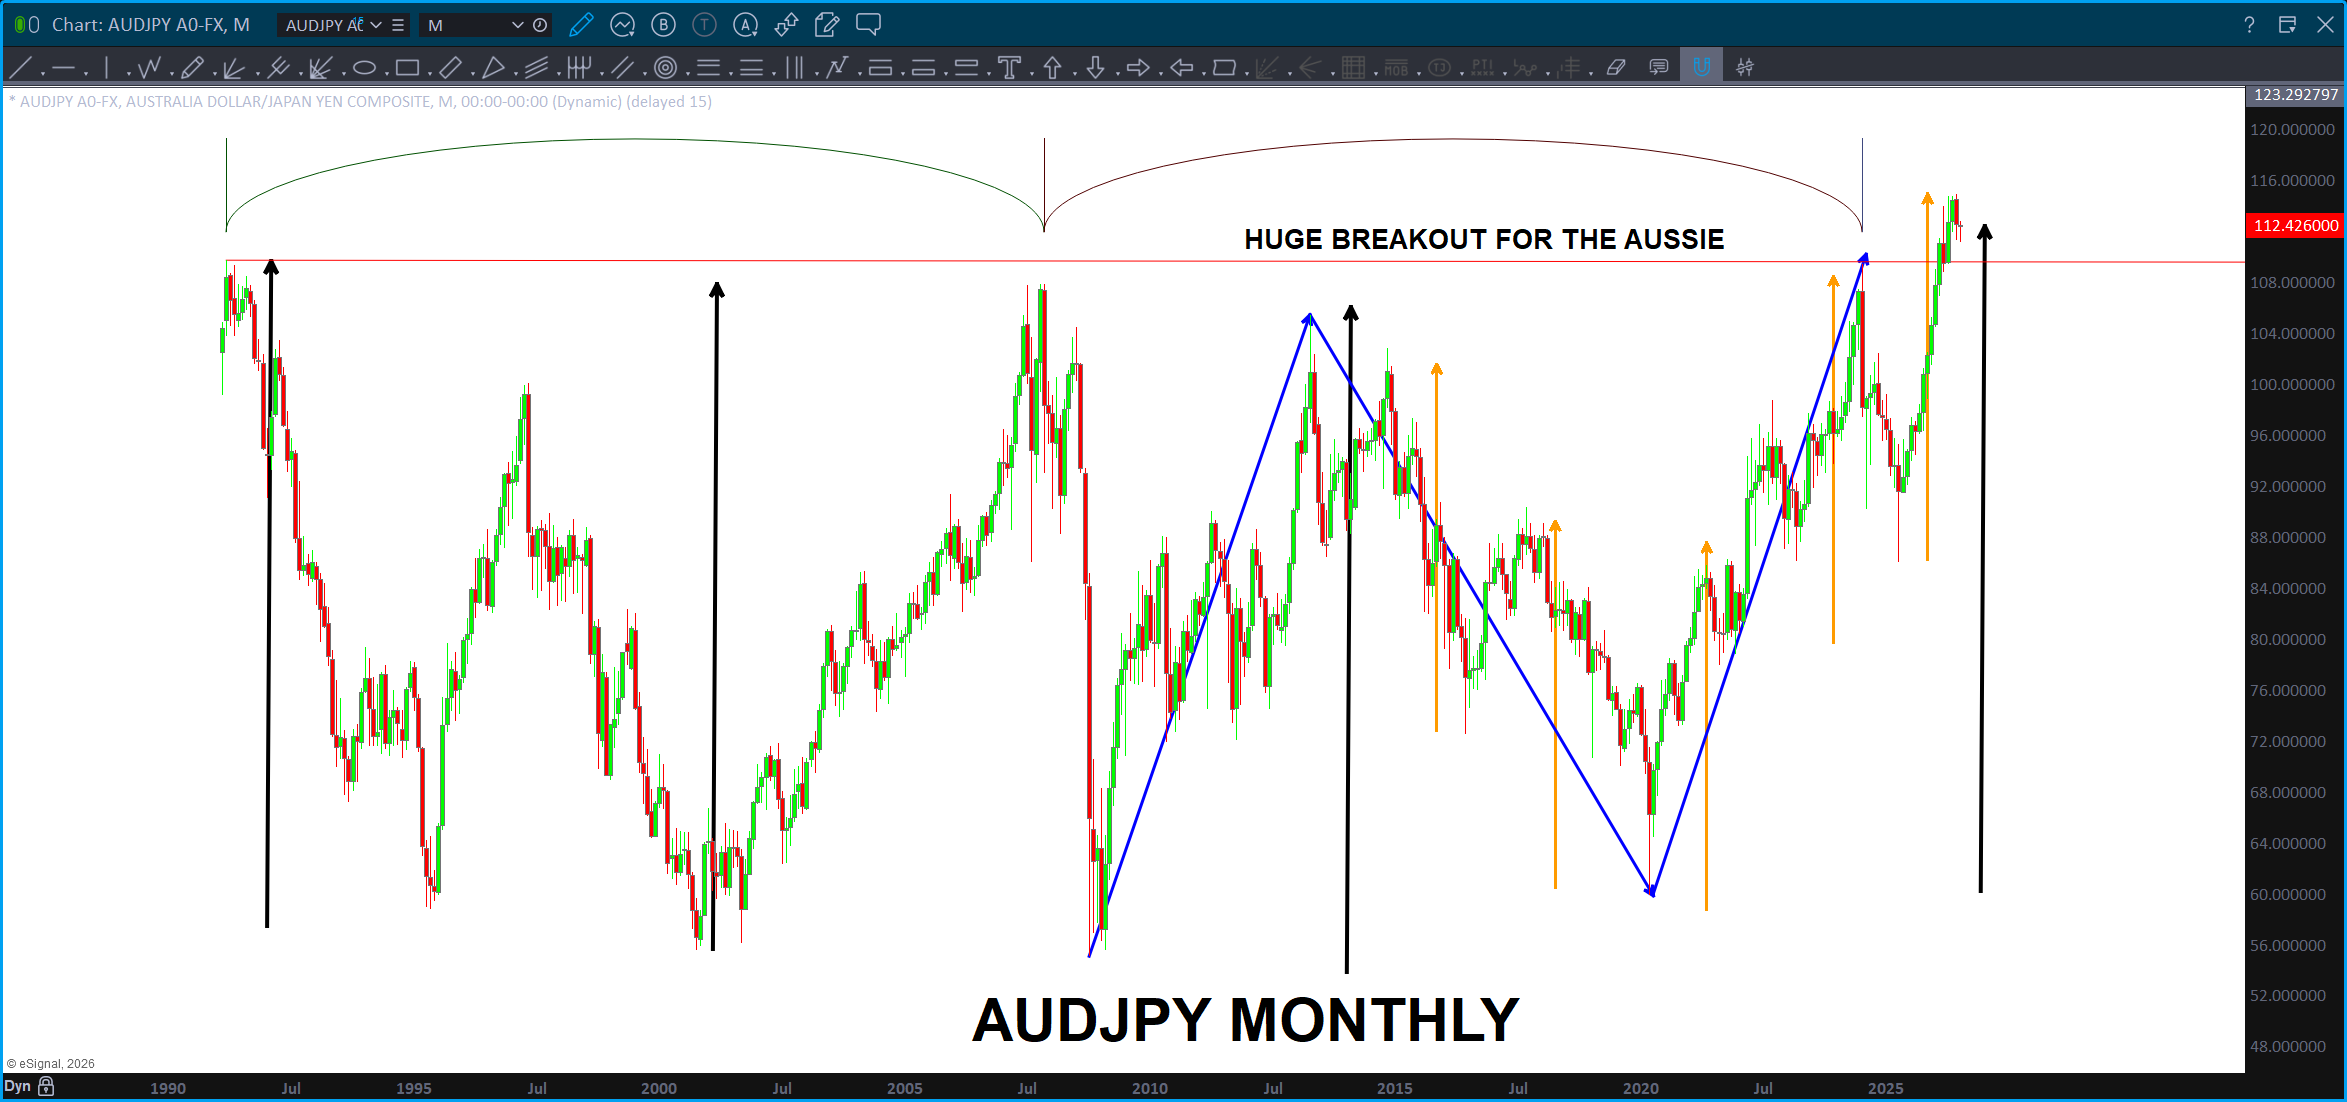
The Aussie broke out against the YEN for the first time in 35 years. I find that a ‘big deal’ as 1/ the AUDJPY did smack into the pattern BUT it has since regained that level and taken out a major resistance level. Note, we had a static time cycle along w/ the ABCD projection so the fact that it broke out after all that … showing some strength. If the AUDJPY closes below that ‘huge breakout” level then something ain’t right at the circle K. Also, note, while this was a NICE time and price confluence it was NOT the BIG turn like the past ones …that’s what we are searching the platonic space for … the geometric confluence of price and time that, literally, completes the platonic solid which encapsulates this collective conciousness investing in the AUDJPY. It went right to the attractor and sold off BUT it was not THE level … the price worked, but it wasn’t TIME. 😉 That’s what I’m working on … time/price confluence in the platonic space which provides the geometric conversion of sacred geometry into price and TIME patterns.
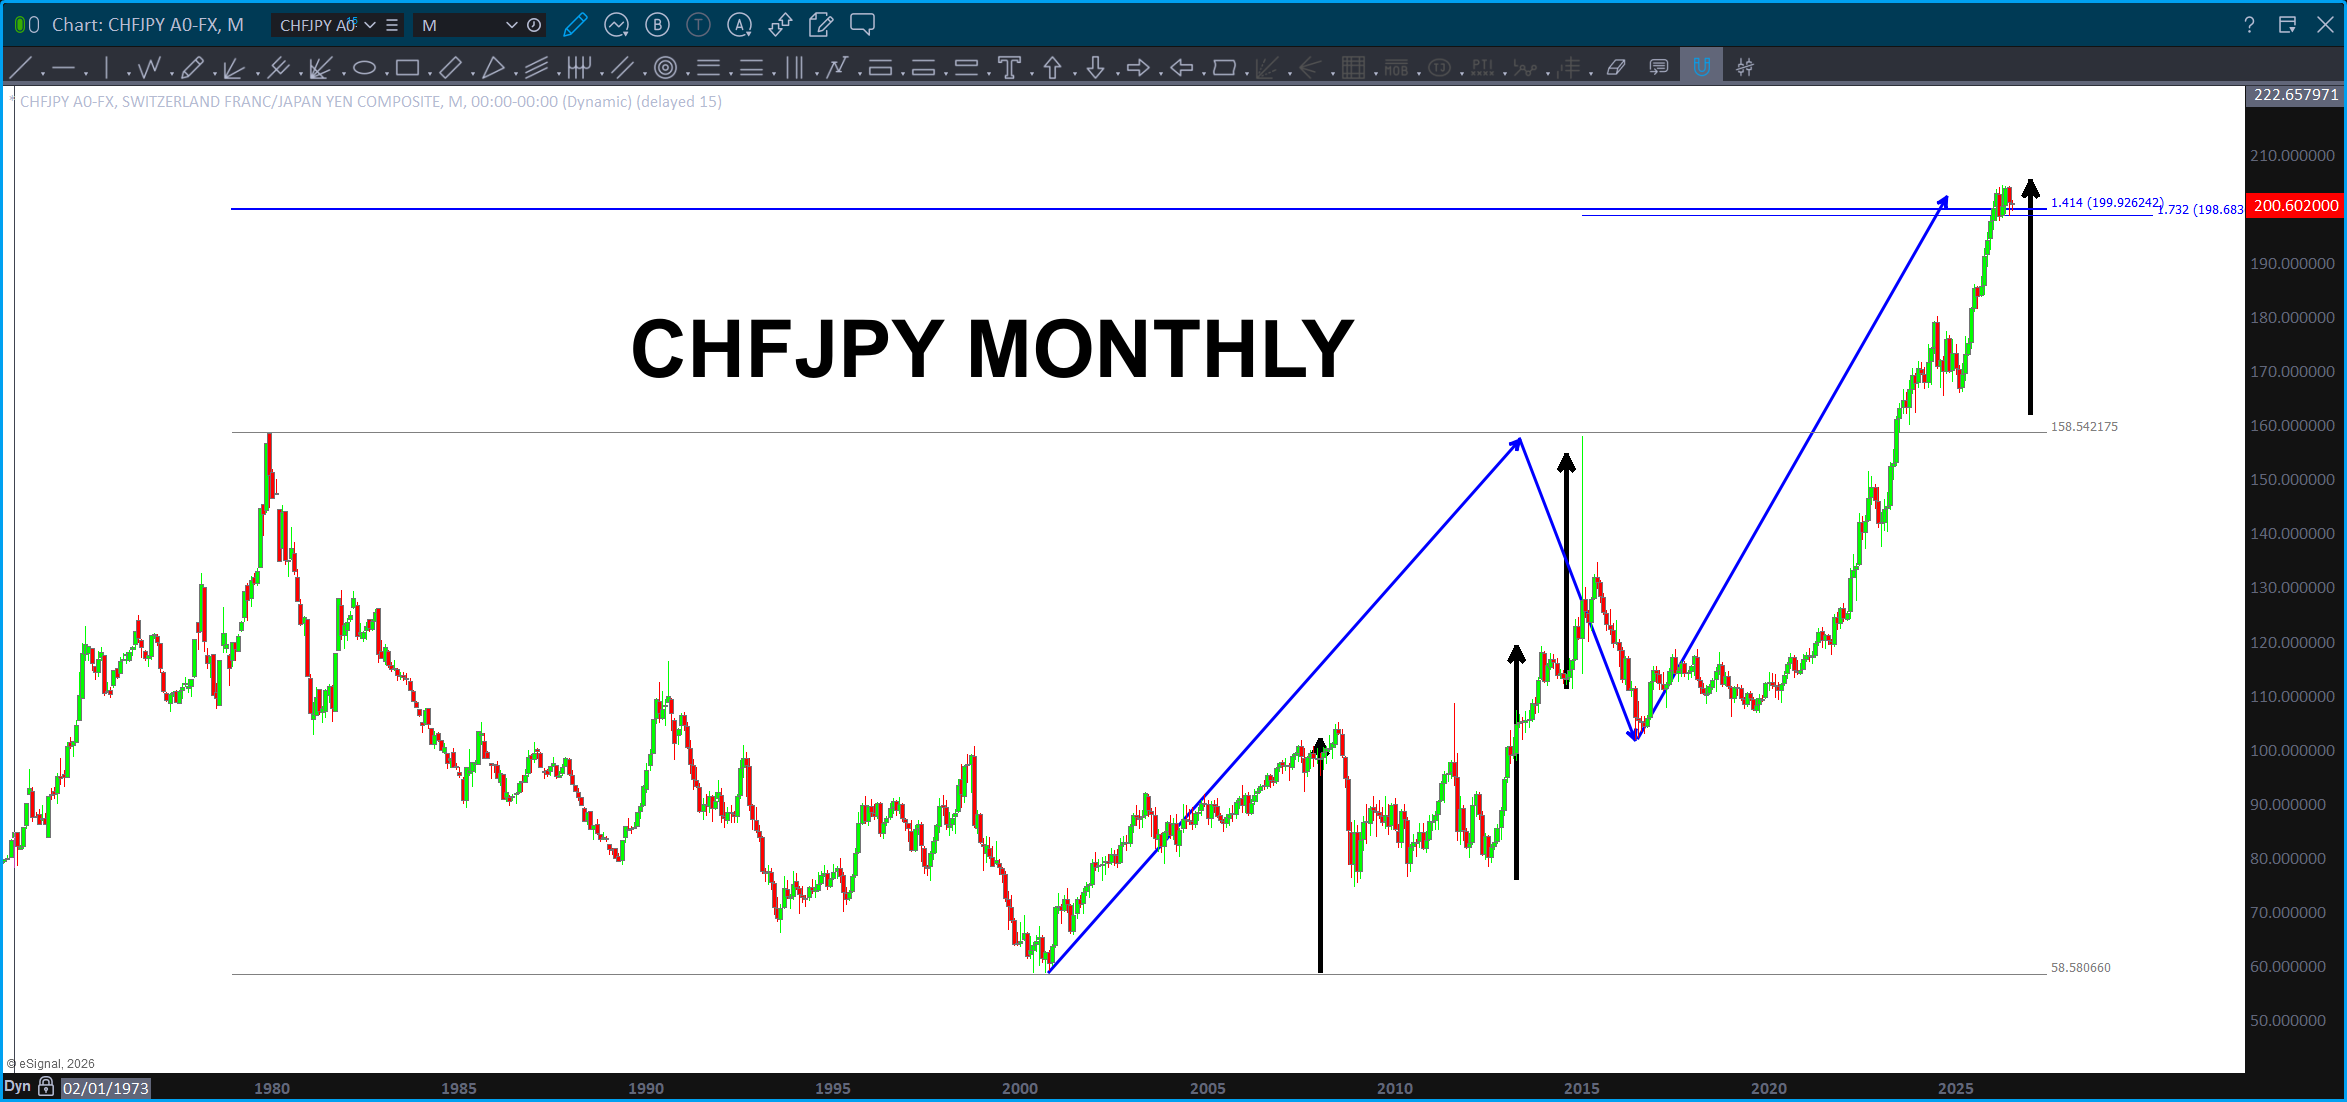
Here’s the CHFJPY … not sure why, but I totally missed the larger ABCD shown w/ the blue arrows … monthly CHFJPY ABCD and now another 7 months of consolidation.
Folks, the FX crosses w/ the YEN appears to be hitting major resistance …
One last, these were big patterns that HIT and allowed for some good financial opportunities but the patterns all eventually failed … except, the USDJPY. Yes, it’s gone just a wee bit higher BUT ultimately, the dollar has been the weakest of the currencies versus the YEN. Hmmmmm ….
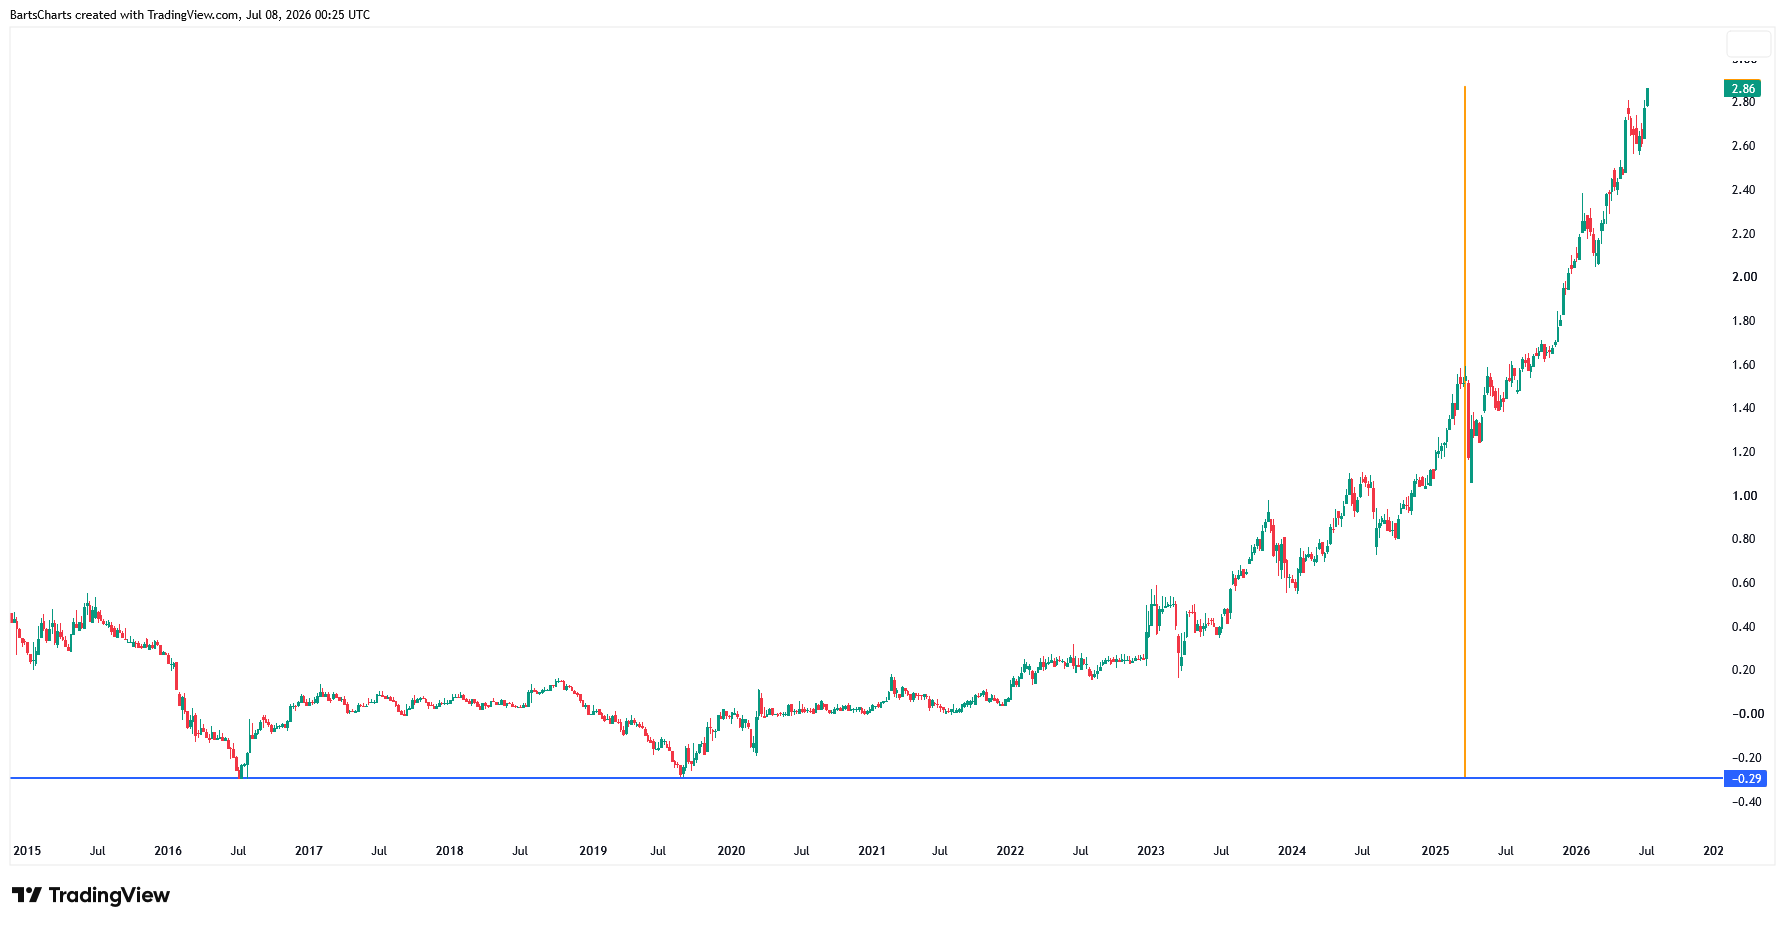
Here is a look at the culprit of all this mess … above is the 10 year rates for Japan. Folks, their interest rates are up over 1,000% !!!!
This is going to be very interesting, for sure.
Crude Oil – July 7, 2026

Well, looks like they are bombing Iran, again …
Did the bombing of Iran cause oil to find support or was the attractor ‘sitting’ in the platonic space waiting to be discovered? Who knows and, frankly, who cares.
Either way, here’s a Crude Oil Chart posted on April 8th, 2026 looking for the BUY in/around 68-70.

Here’s the updated chart from today. Honestly, I totally missed this … when I heard they were bombing again I just went “shoot, I had posted on Crude months ago … wonder what level it bottomed?”

Folks, crude bottomed 5 days ago … went right to the attractor.
Crude: new highs ahead, stop out below the low 5 days ago if we reverse and blow thru to the downside. Look above and you will see the next level to BUY if this level does not hold.
Right now, there is a member of our Armed Forces in harms way, let’s never forget that …
 Bart's Charts