Financials – it’s pretty much all that matters – right now
they lead us UP and they lead us DOWN. the banks, financials … it’s that simple.
that being said, the move since March 2020 has been strong and straight up .. kaboom that’s a face ripper higher and, frankly, caught me off guard. why?
well … the ZIRP, the multiple trillions (yes I just typed MULTIPLE trillions) of sovereign debt is beyond anything that we could EVER imagine. folks we are in unchartered territory. again, we are in the vapor ware of experiential historical construct and, from where I sit, it’s UGLY.
but, the band plays on … right?
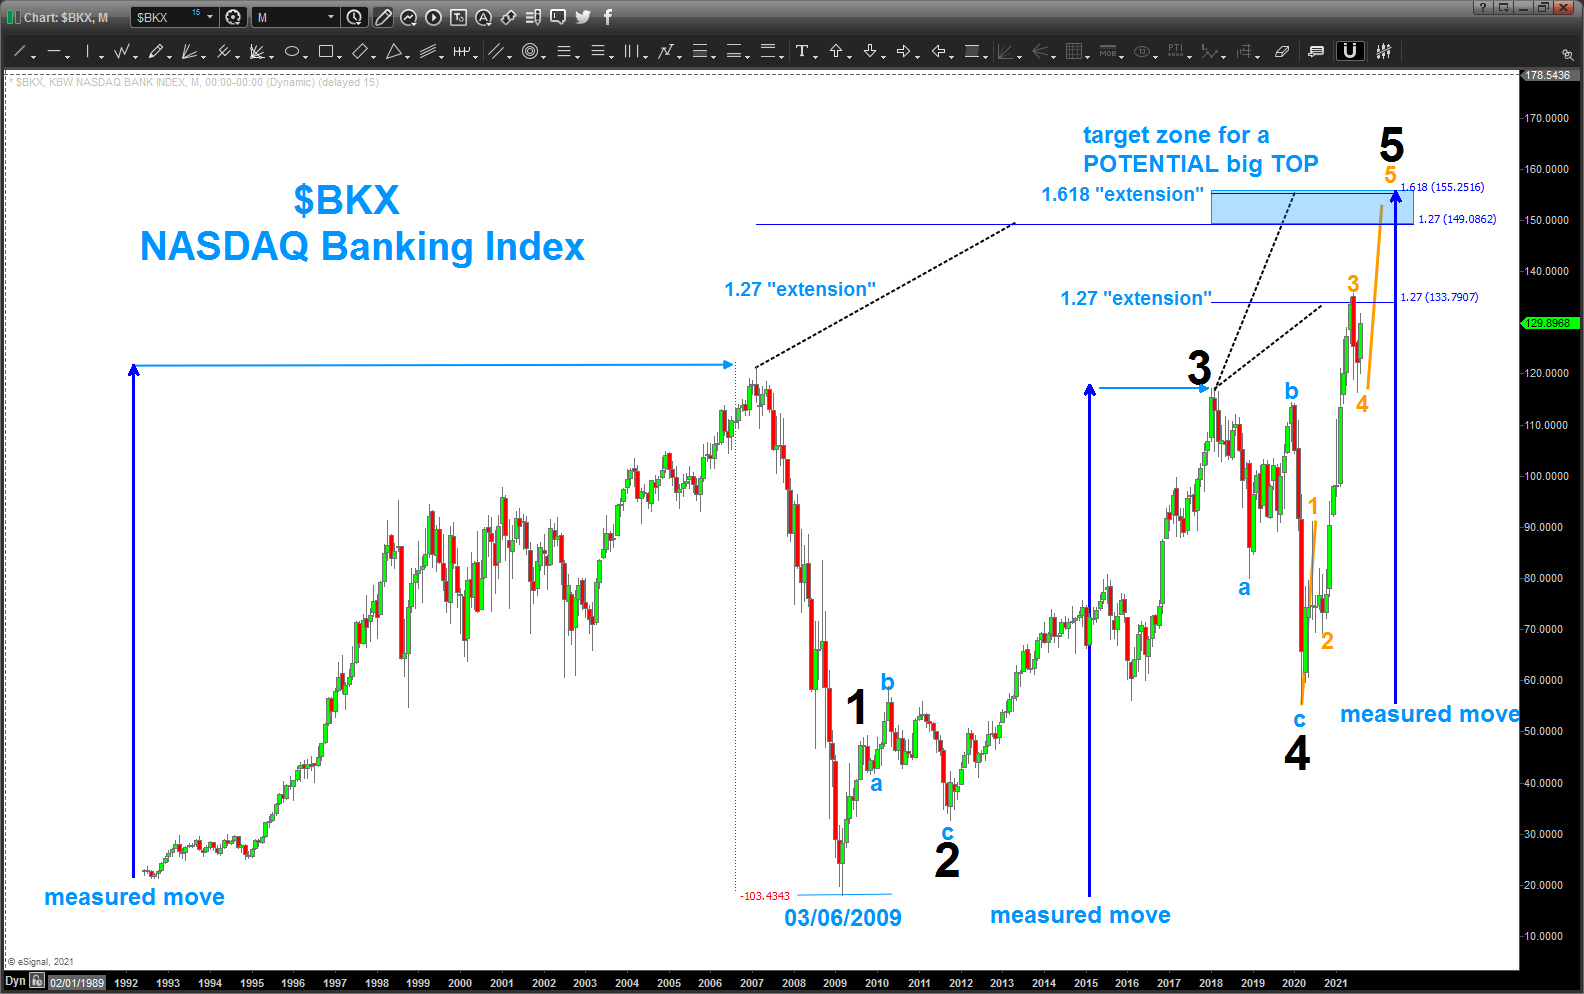
so, I present, more than likely the most important chart out there .. the banking index.
I had the opportunity and that is what it is .. an an opportunity to sit down w/ JC yesterday and chat … it was blast. but what came to me is while I have all these followers – thank you!- nobody really knows what I’m showing so I’m going to break it down …
BLUE VERTICAL ARROWS – they are measured moves .. every move UP has ended at their conclusion .. so, note around the 155 level – make it simple
DASHED BLACK LINES – just showing you where we take the key nodes and EXTEND from those points … NOTE that 149-155 we have some confluence.
ELLIOTT WAVE – love it, when it works … seriously. if your going to go down that rabbit hole, just learn the corrections … anyway, a VALID (trust me, doesn’t mean it’s a correct count LOL) count shows us finishing 5 waves in around the level sighted before. NOTE – the orange lines is the current wave that we are counting and 1=5 in our target zone.
so, 149-555 BIG DEAL for the financials ….
now .. go on … rock on, capture your stoke folks …
B