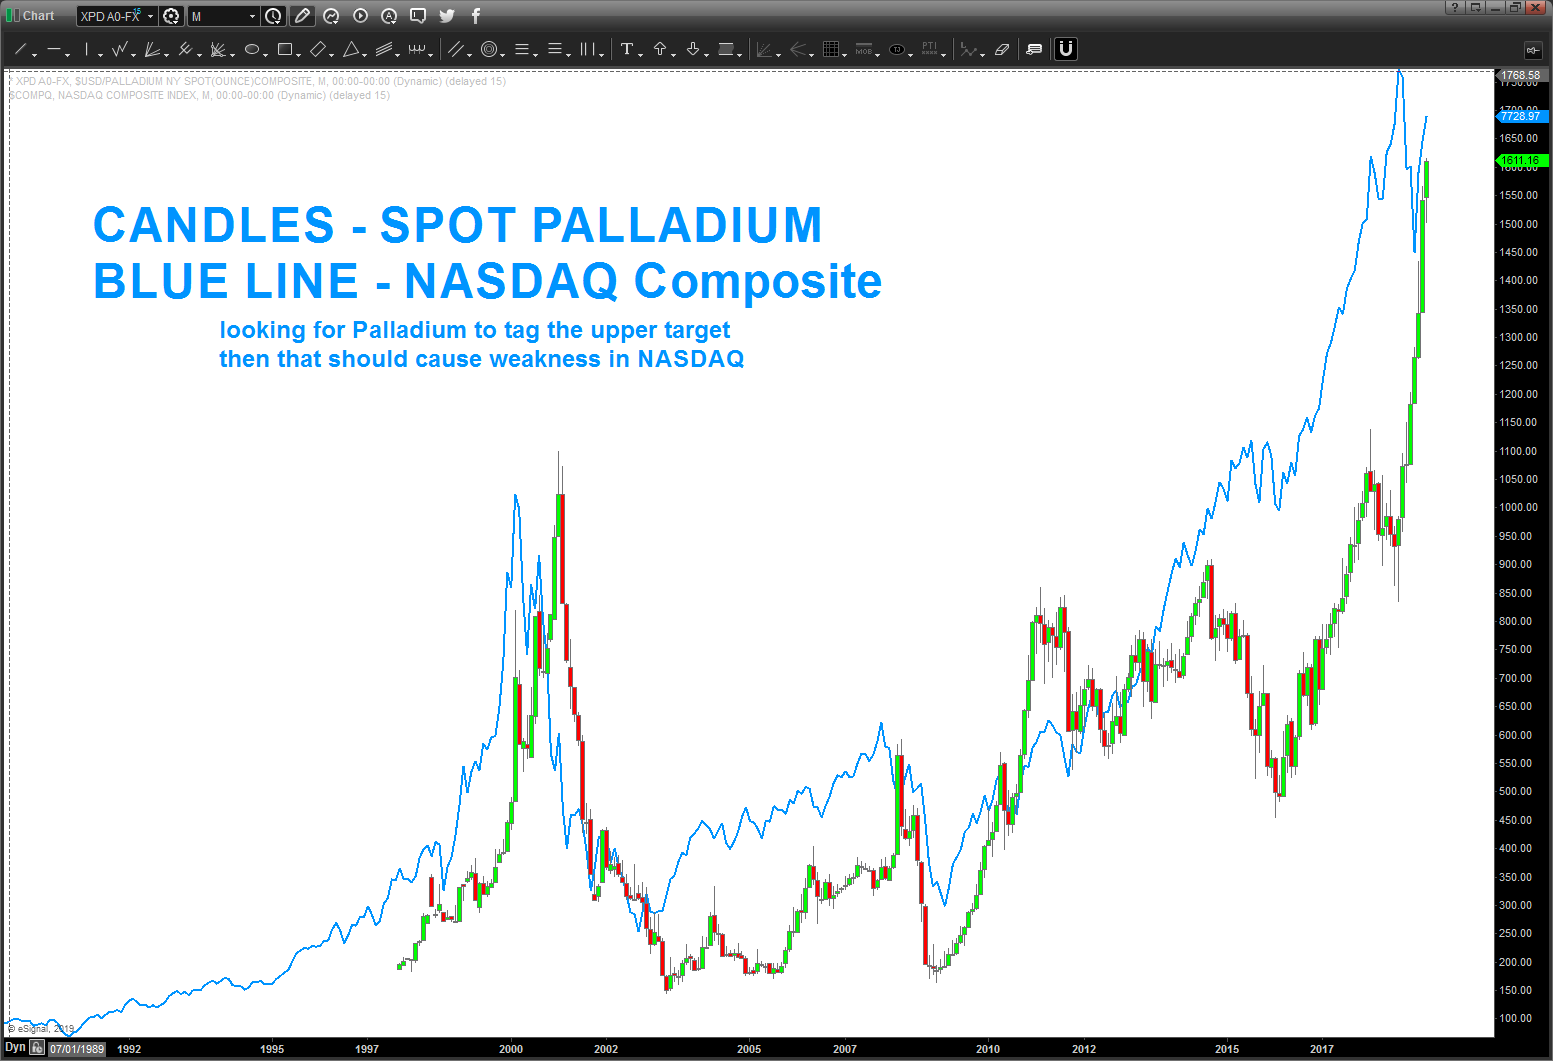
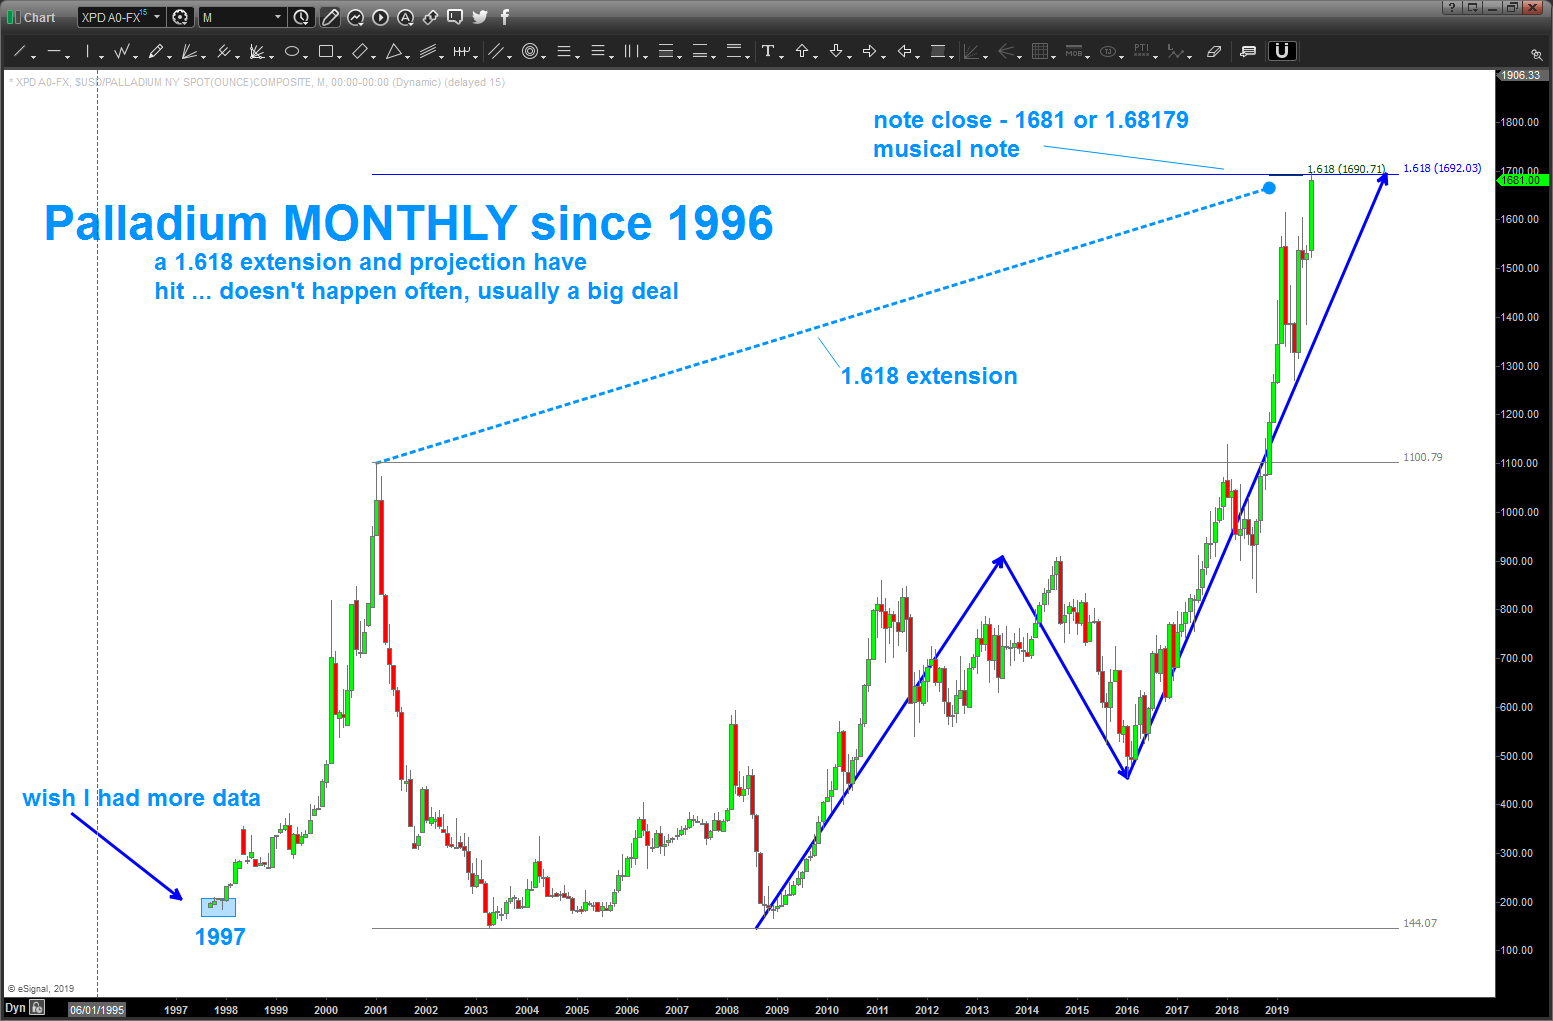
Pay Attention to Palladium and the target that it hit …
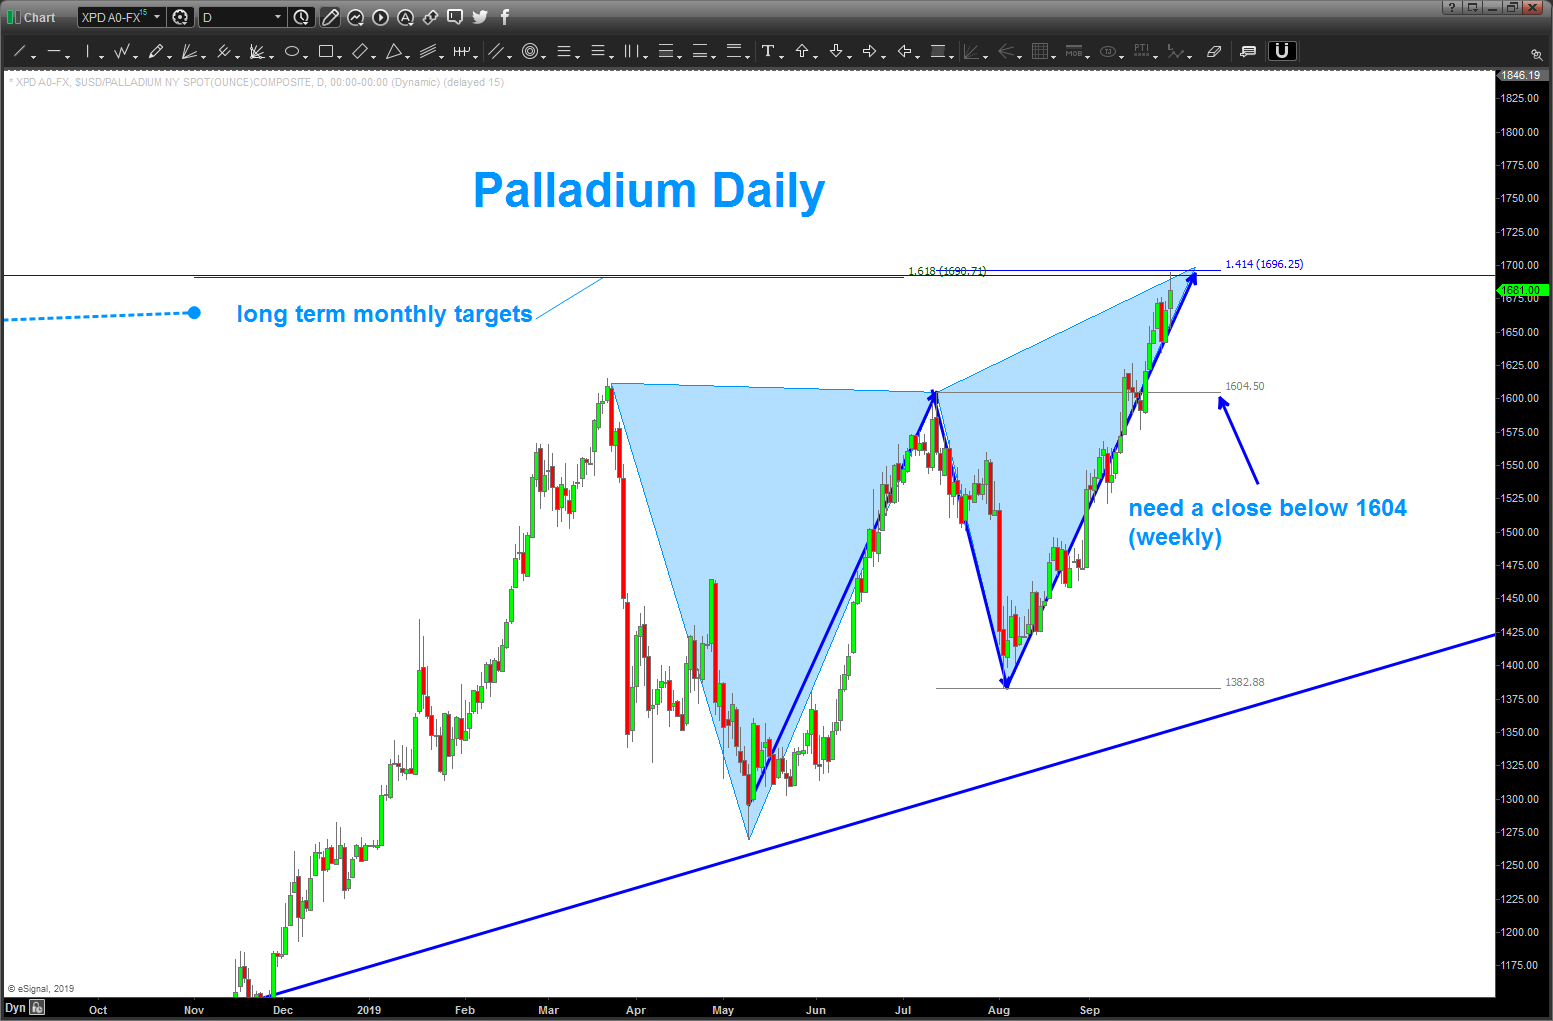
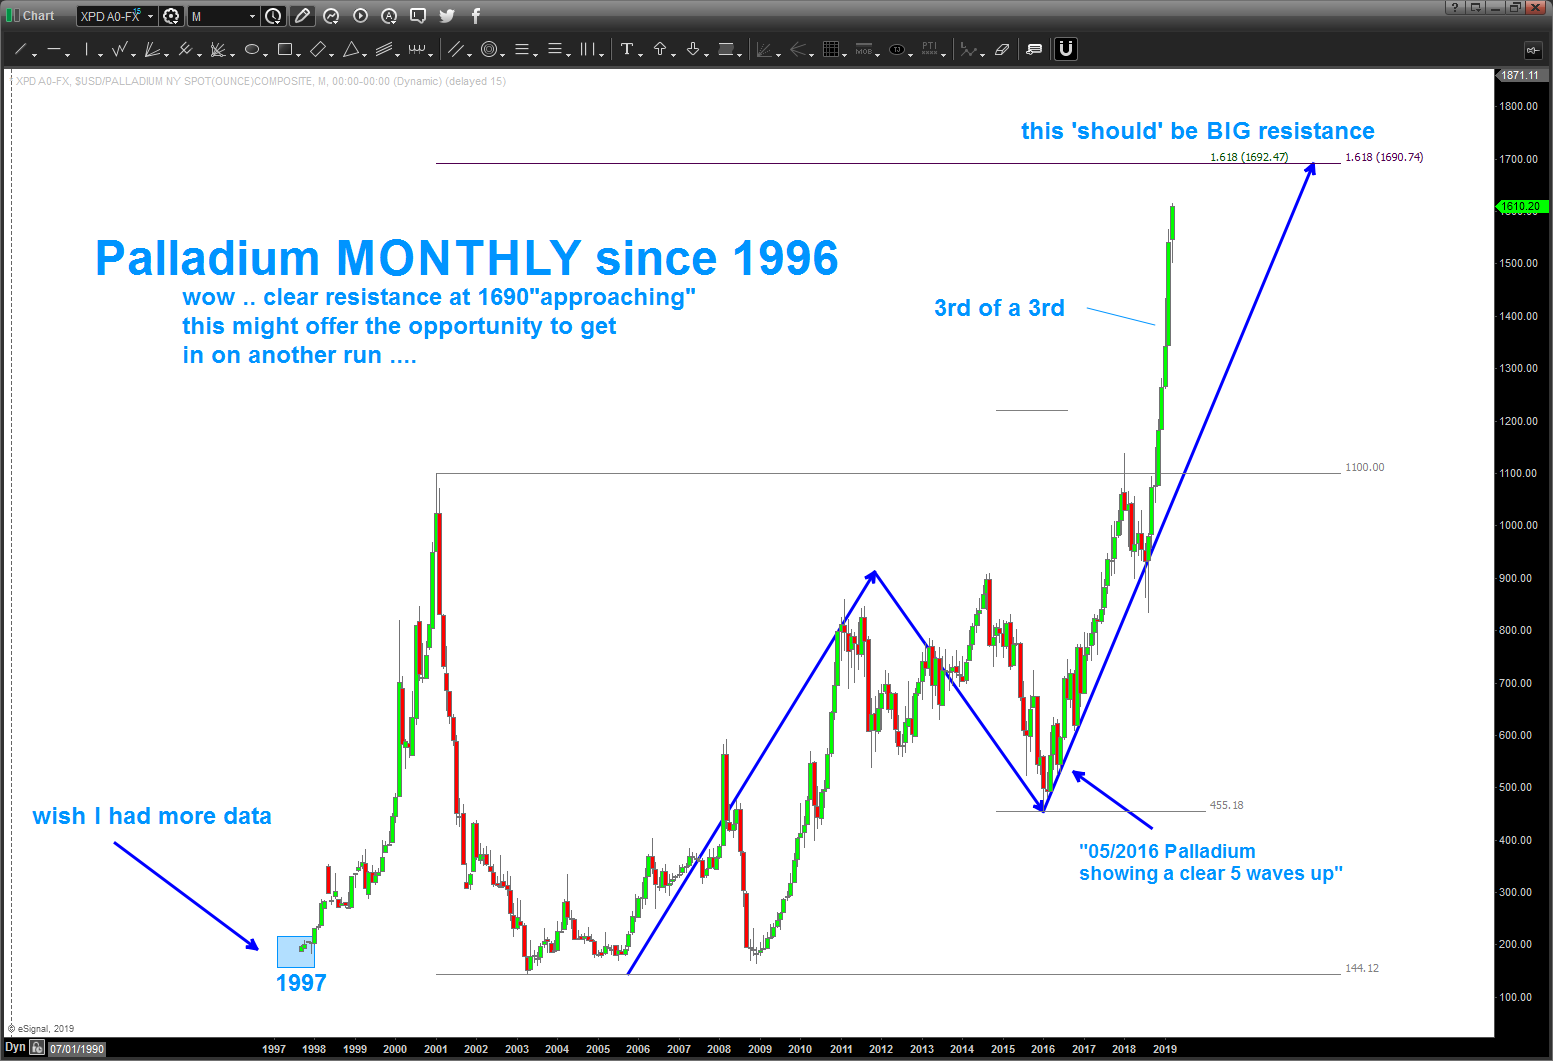
09/28/2019 – we blogged about this long term target back in March. It was hit on Friday. When we have two 1.618 projections and extensions coming together – it should be a big deal. The other to note is the fact that we have what’s called a “butterfly sell” pattern that hit on the daily and smacked right into the long term targets from 1996. If we get a weekly close below the 1604 ish level, then advise to become defensive. Updated charts below:
———————————————————————————————————————-
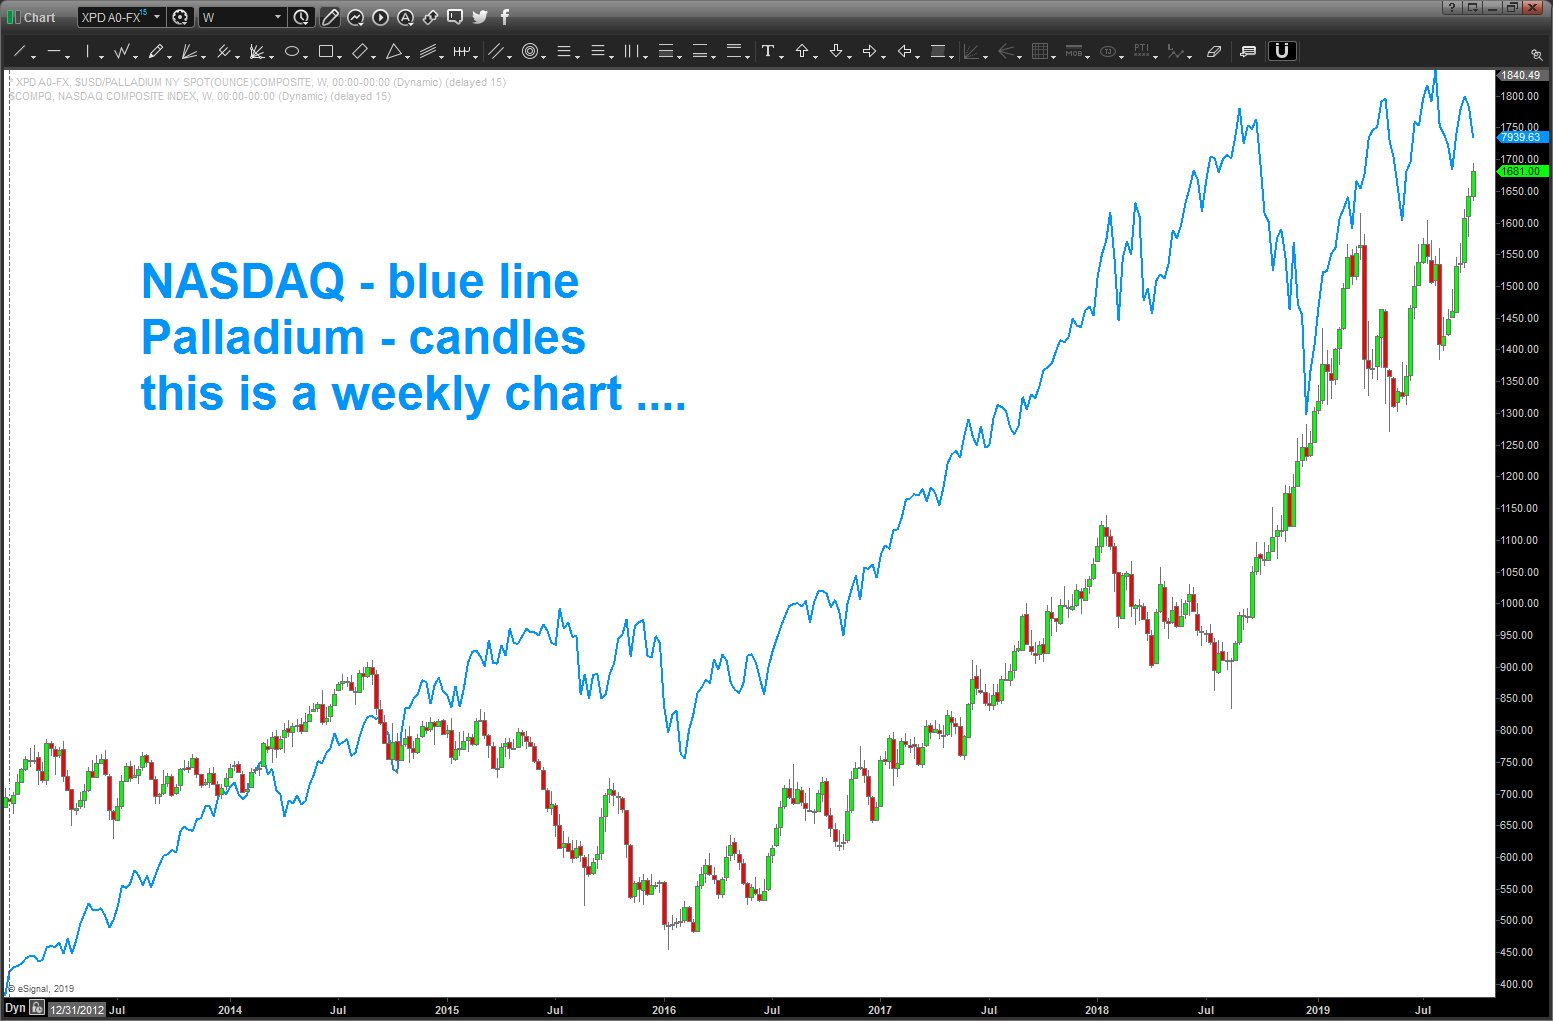
would watch the target above, very closely, along w/ the NASDAQ weakness in the coming days/weeks.