Global Dow – inflection point update
05/29/2019 UPDATE
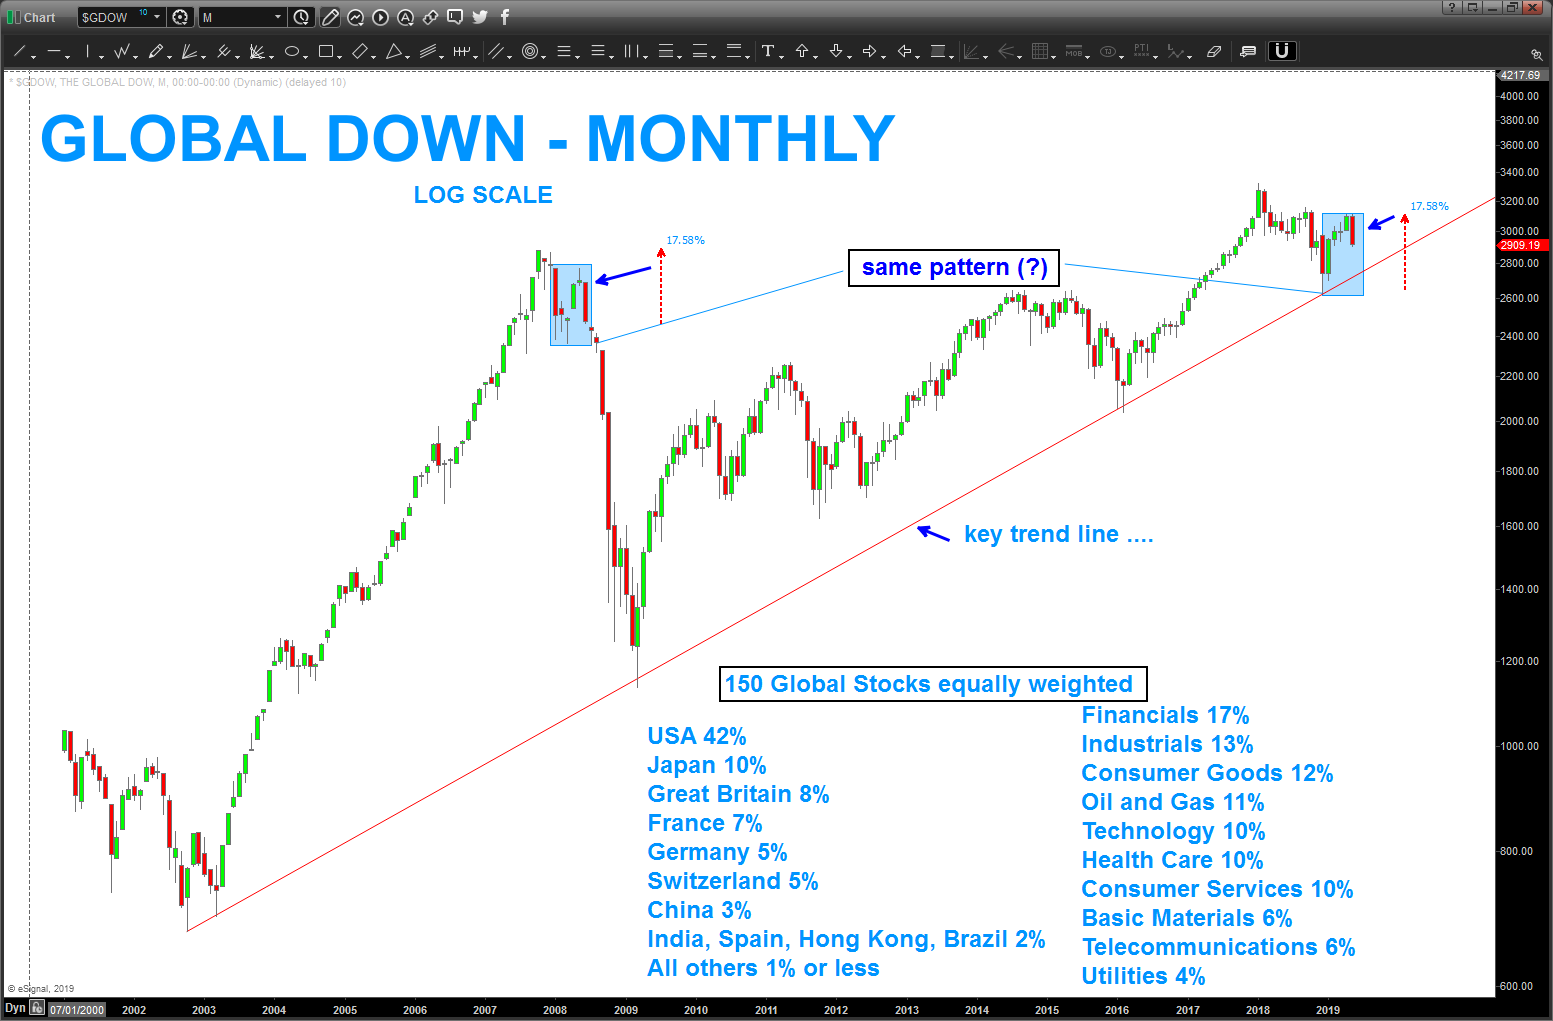
note, from our last post in April we correctly ID’d the ‘roughly’ 17-18% move (corrective) up in the GLOBAL DOW and I have annotated “same pattern” to simply show this chart acting like the 2007-2009 period, thus far. the key here is the long term LOG trend line that is coming up from the 2002 lows. would expect, based on the monthly candle forming right now, that it should get tested in the coming weeks. breaking that trend line (MONTHLY close below) would be an ‘other’
as for the US DOW, that’s setting up a totally different and, potentially, bullish pattern so we’ll have to put it all together over the coming weeks.
___________________________________________________________________________________________________________________________________________________________
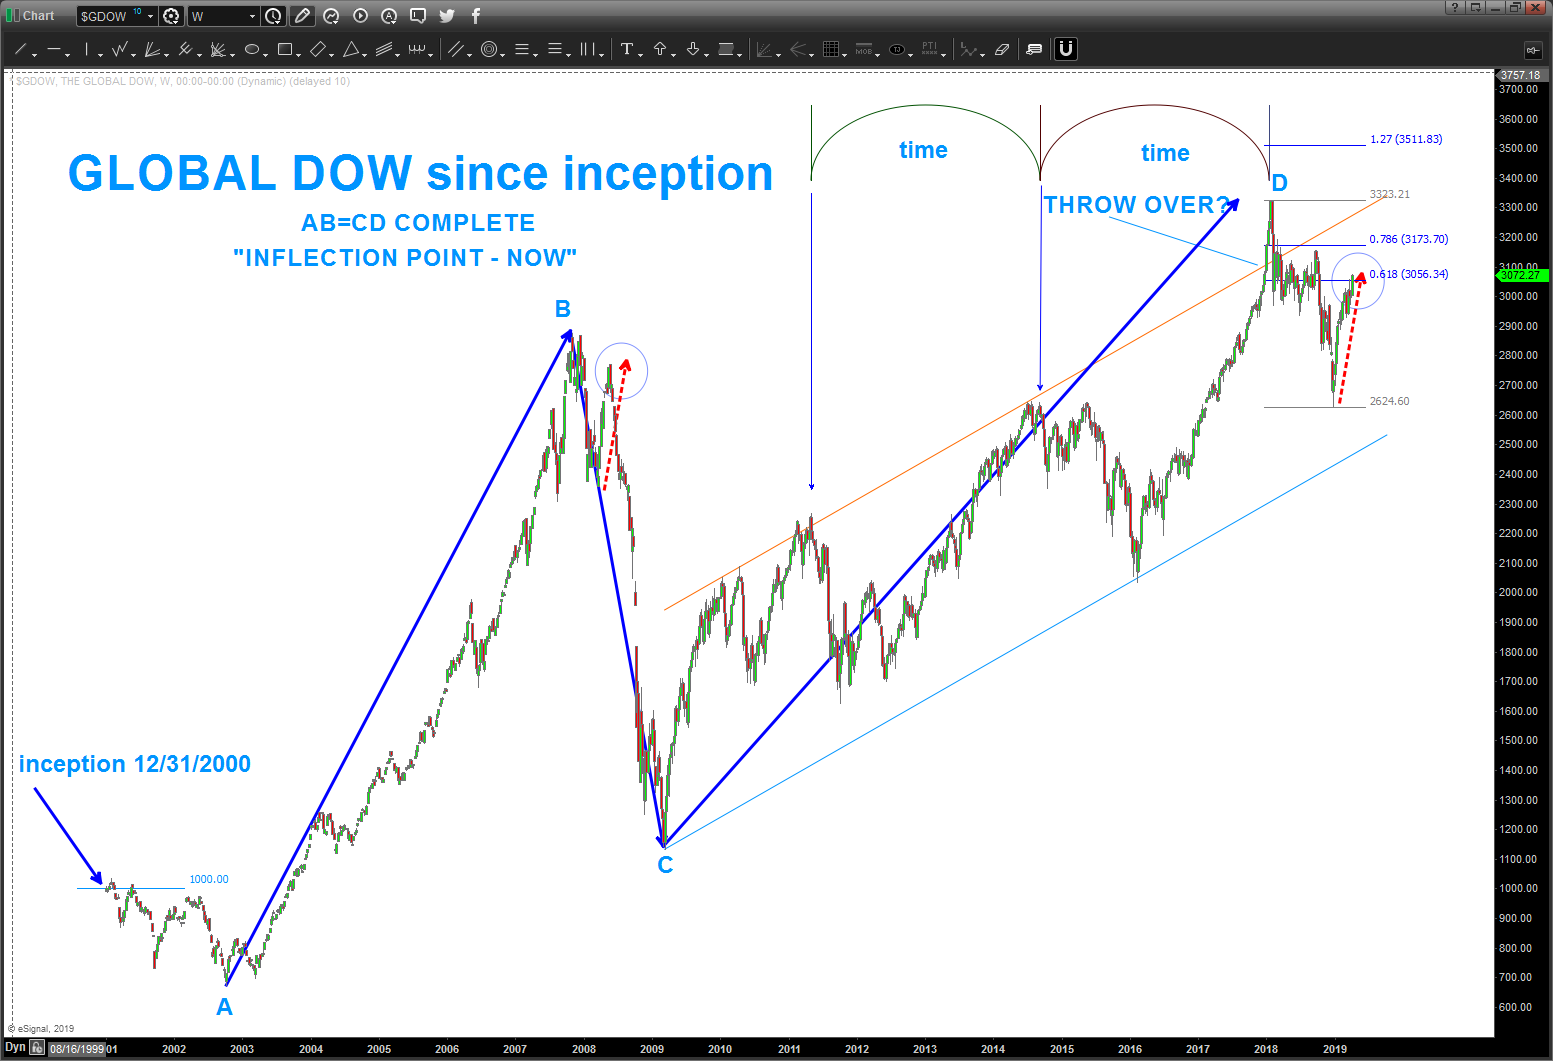
note the AB=CD pattern that completed on the Global Dow.
note the dashed red arrow rally … well, we are pretty much there in regards to price and time.
should be an interesting week …
Bart