03/08/2020 Asian Open Update

the USD vs YEN cross rate is a BIG FX pair to monitor for equity strength and weakness. we had a nice ‘nominal’ 1100 point gap down to the open the DOW futures in Asia and a 20 percent drop in crude. rocking and rolling folks …

as the night progresses, just watch 102.06-103.20 on the USD vs JPY and, a little lower 100.62. We’ve already sliced thru 2 years of support – easily – but do look for these levels to offer a modicum of support over the coming hours/day (s?)

watch the USD vs JPY YEN chart below and these key levels for support of the US equities

USD vs Japanese Yen coming close to resolution (?)

10/22/2017 – we discussed the ‘RSI SHIFT’ below.  taking note of it again …have been on the sidelines w/ regards to the USD vs YEN as I’m waiting for resolution of the downtrend line shown …

note: still in the ‘maybe’ camp of 2 being done … so were going to be watching the YEN very closely in the coming days/weeks.  In the past, YEN strength hasn’t been too good for US Stocks …

—————————————————————————————————————————————————————————

here’s some work that I’ve been doing on the YEN: https://bartscharts.com//?s=yen

just taking a look at the weekly RSI and, when I trained under Constance Brown she said “the market will tell you when it’s shifting, watch the RSI zones for clues.”

as you can see below … the, what I believe, multi-decade wave 5 occurred in 10/2011 and a VERY powerful advance occurred.  You’ve read about my chaos w/in the YEN and how I got stopped out something like 6-8 times (I’ve tried to flush it from my memory) in around 76 ..(yes, 76! and, no one said this was going to be easy!) for what I was expecting was going to be a monstrous ride.

anyway, note how support SHIFTED up after the decades long bear trend … (see dashed green lines) and how, after this correction – which might be pretty much complete it the support and resistance has now shifted down (see dashed red lines) ….

I’m in no mans land right  now .. while I believe another advance of the USD against the YEN may be forthcoming I would have really liked to see the RSI resistance SHIFT back up into the 80’s.  So .. while our ‘count’ isn’t complete in this wave, I’m going to step aside and see what happens the rest of the month.

as you can see w/ the ???? it’s time to sit on my hands and see what plays out … that’s only me. you do what you want and follow our plan, as always.

Bart

page_17-02-12_13-43-04


USD vs Japanese Yen

here’s some work that I’ve been doing on the YEN: https://bartscharts.com//?s=yen

just taking a look at the weekly RSI and, when I trained under Constance Brown she said “the market will tell you when it’s shifting, watch the RSI zones for clues.”

as you can see below … the, what I believe, multi-decade wave 5 occurred in 10/2011 and a VERY powerful advance occurred.  You’ve read about my chaos w/in the YEN and how I got stopped out something like 6-8 times (I’ve tried to flush it from my memory) in around 76 ..(yes, 76! and, no one said this was going to be easy!) for what I was expecting was going to be a monstrous ride.

anyway, note how support SHIFTED up after the decades long bear trend … (see dashed green lines) and how, after this correction – which might be pretty much complete it the support and resistance has now shifted down (see dashed red lines) ….

I’m in no mans land right  now .. while I believe another advance of the USD against the YEN may be forthcoming I would have really liked to see the RSI resistance SHIFT back up into the 80’s.  So .. while our ‘count’ isn’t complete in this wave, I’m going to step aside and see what happens the rest of the month.

as you can see w/ the ???? it’s time to sit on my hands and see what plays out … that’s only me. you do what you want and follow our plan, as always.

Bart

page_17-02-12_13-43-04


Truncation … low in USD vs JPY in place?

the more I look at:

  • USD Index “low” in place and advancing …
  • thrust/momentum from the lows in the USD vs JPY …

the more a case can be made for truncation as shown below … so, here’s the other side of the coin.  going to have to go for it w/ a stop and see what happens … just waiting for a buy pattern to test the thesis.

Bart

Page_16-09-05_16-30-50

Have you ever been in a draw down?

Note the title of this post … I know draw down and it hits you to the core.  The reason I bring this up because, once again, I’m taking a hard look at the USD vs JPY. Why drawdown’s and the YEN? Well, because as a CTA I went into my first draw down – EVER – trying to go long the USD vs JPY in/around 75.  TILT – all the way back down at 75?  YES all the way down at 75.  For those of you beginning this journey, you’ll say to yourself “you suck.” And for those of you who have been at it for a while you said “you’ll come away stronger …”  I NEVER risk more than 1-2% on a trade … I didn’t then, I DO NOT now, but I lost something like 8 times in a row and went into an 18 percent draw down.  It sucks … so anytime I start looking at the YEN I say “you sure you want to do this …?”  YES, I DO and WILL ….

so, I really really like my count up at 125 …. and I really really like the long and deep retracement we are having.  the question we have in front of us is … is this the end of it?

Michael Jenkins taught me his 1/8th Signal Reversal Candle technique – it’s SO SIMPLE yet the theory behind it’s so advanced.  Let’s keep it simple:

  • go to a weekly or monthly and look for the SIGNAL REVERSAL CANDLE. In this case, the LOW of the HIGH candle is taken out on close.
  • from there simply subdivide that candle and bracket it w/ 7/8ths or .875.  when you get to the last 1/8th division that SHOULD be big time support.
  • note, in this case it was … try it, you’ll like it.

Here’s what I DO NOT like ... I DO NOT LIKE that the rally UP has been a clear three waves …so, crap that says one more low on the USD vs JPY. SO I WAIT … WHAT AM I MISSING HERE?  🙂

Page_16-09-04_18-58-17 Page_16-09-04_19-01-40

YEN is about to get really interesting …

CLIFF NOTES: 99.40-99.80 is where we “should” see some support come in … take a review at the charts below.  as you can see we have finished 5 waves up at the 105.40 handle.  (note, see this chart below as the 5th wave was completing we were calling for it) so, since we have finished 5 waves up we are either at a 1 w/ 3,5 up to come and we are tracing out 2…or we just did an A and now we are correcting B for a C wave UP.  Also note, we are a couple days (max) away from the same amount of TIME that the triangle shown below formed and completed.  So … it’s going to get interesting, to say the least.  Personally, I wish this pattern was completing lower as the DEPTH of the correction isn’t as big as I would think but is that a sign of the overarching bullishness? hard to say ..but from a TIME perspective we are finishing up the same amount as the triangle.  Keep an eye on this one ….

Here’s is the TOP (real time):

JPY top at 105.40
JPY top at 105.40

here’s a revisit of the long term picture and then, finally, the DAILY pattern that is forming:

Long Term Monthly Picture

WEEKLY
WEEKLY


Daily Pattern Completing a little LOWER

the Japanese Yen in charts …

Cliff notes: can “see” why recent YEN weakness has paused and ran into resistance on the charts.  that being said, some MAJOR patterns completing just a little farther away (note: CHFJPY)  Also, note that YEN strength usually shows volatility spiking.  I expect mid-April to be interesting across the entire circle of life.

Also, have found this a great resource to check accuracy of long term data: http://fxtop.com/en/historical-exchange-rates-graph-zoom.php?C1=CHF&C2=JPY&A=1&DD1=01&MM1=01&YYYY1=1953&DD2=31&MM2=03&YYYY2=2014&LARGE=1&LANG=en&CJ=0


Nzdjpy april 01 2014 CADJPY April 01 2014 USDJPY april 01 2014 AUDJPY MONTLY AUDJPY April 01 2014 GBPJPY april 01 2014 april 01 2014 EURJPY April 01 2014 CHFJPY

Japanese Yen Advance

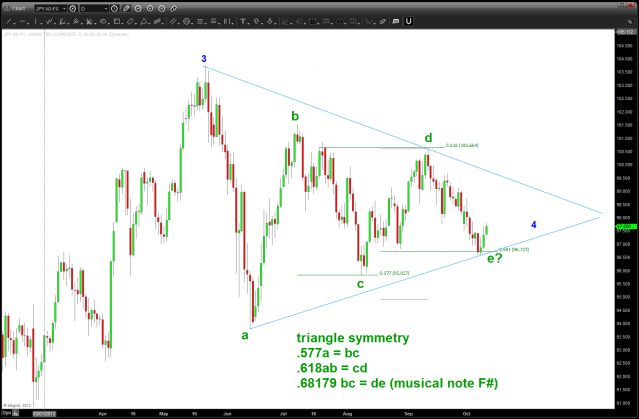
I have been following this pattern closely … after an amazing move upward, we have been consolidating in what looks like a multi-month triangle.  From a counting perspective it does fit the  characteristics of a 4th wave so we’ll have to watch it closely for signs of the triangle being complete.  At this point, right now, I don’t know.  The symmetry of the ratio’s of the legs is “close” to the rules (they are supposed to be .618 of each leg) and the most latest low of yesterday finished a very nice buy pattern.  For now I will sit on my hands … but the move is coming for weakness of the JPY versus the USD.

long term count
long term count


daily chart of triangle ratio's and potentiality
daily chart of triangle ratio’s and potentiality


other targets
other targets


pattern complete
pattern complete


60 min chart as of 0400 10/10/2013 ... pullback coming to buy (?)
60 min chart as of 0400 10/10/2013 … pullback coming to buy (?)