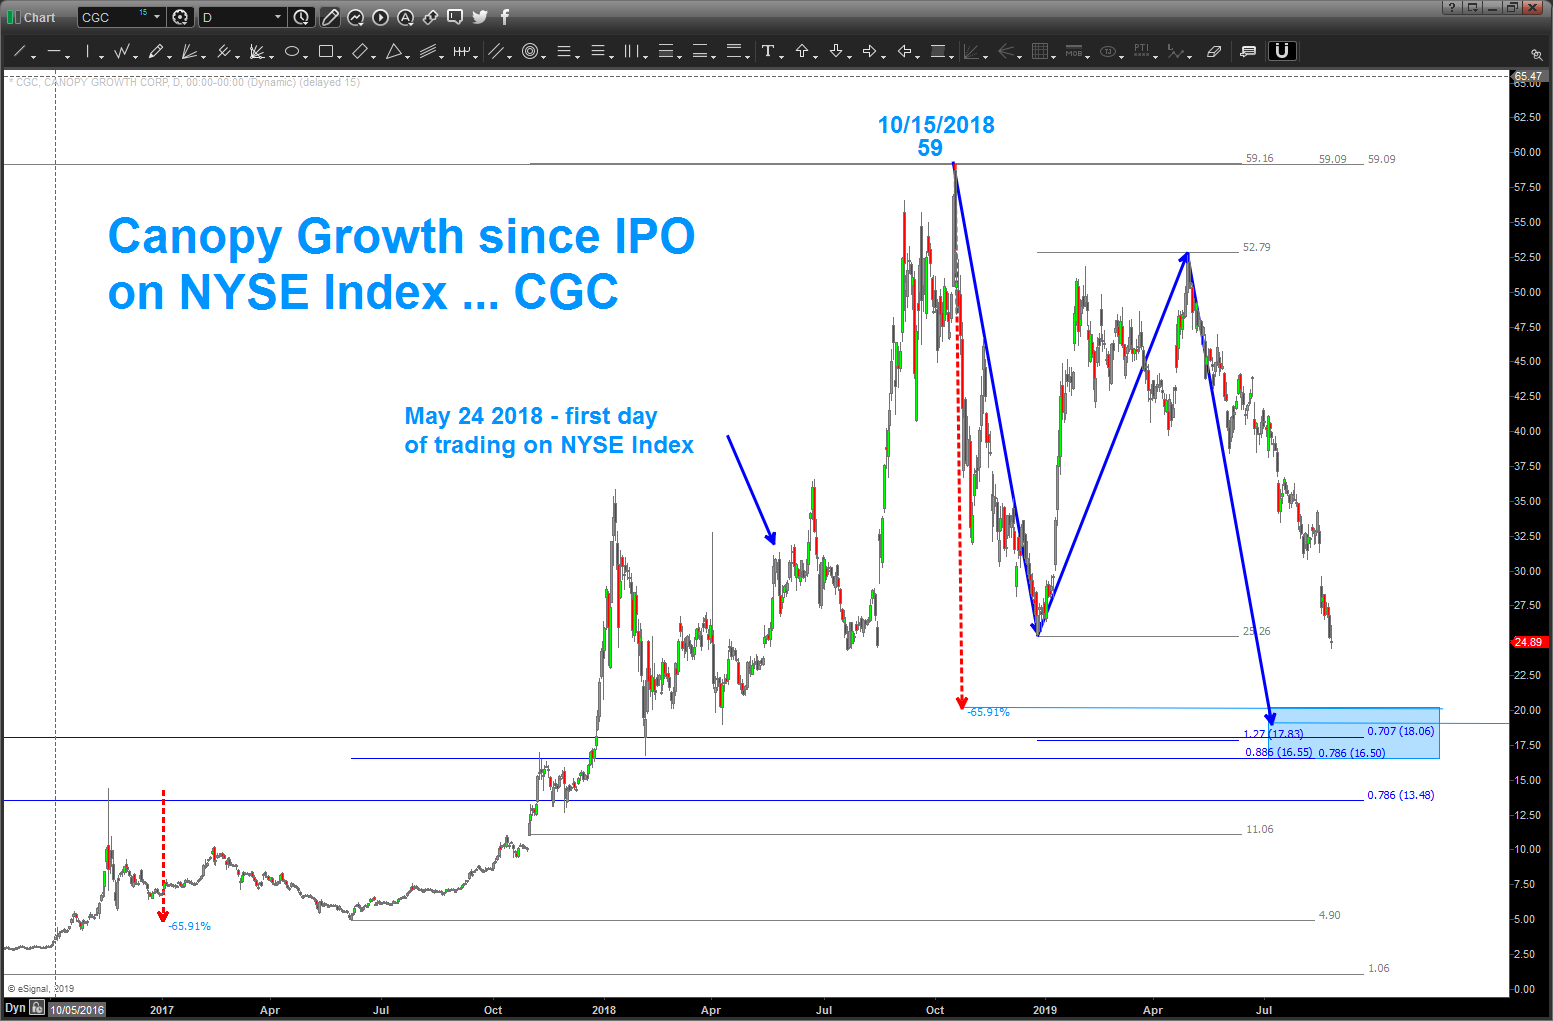
Canopy Growth
when looking for a pattern (BUY or SELL) we do 3 things .. project, extend, retrace.
in the case of CGC we have a ‘zone’ of support in/around 16.50-20 to look for a buy pattern.
the projection – in this case the simple one is the blue arrow and we have the classic AB=CD or measured moves of equality …
the extension is 1.27 and it lands on the .707
the retracements are drawn from multiple nodes (lows, all time lows, gaps, etc) and they all come in around our zone. the .707 retracement is a by product of the square root of 2 = 1.4142 and it’s inverse 1/1.4142 = .707. Square root of 2 is a big deal w/ regards to numerology.
when we put all this together we get the zone sighted above .. .additionally, note that back in 2017 (when it was only traded on the Canadian Stock Exchange) the largest correction was roughly 65%. if we take a look at the dashed red lines we see that same corrective move – 65% – is present in/around our pattern level.
I’m ‘bullish’ cannabis in general and this appears to be a nice opportunity to get LONG CGC.
hope you had a good weekend.

Pingback: Canopy Growth – BUY pattern complete | Bart's Charts