TSLA-rocket ship – updated – updated-update-update resolved
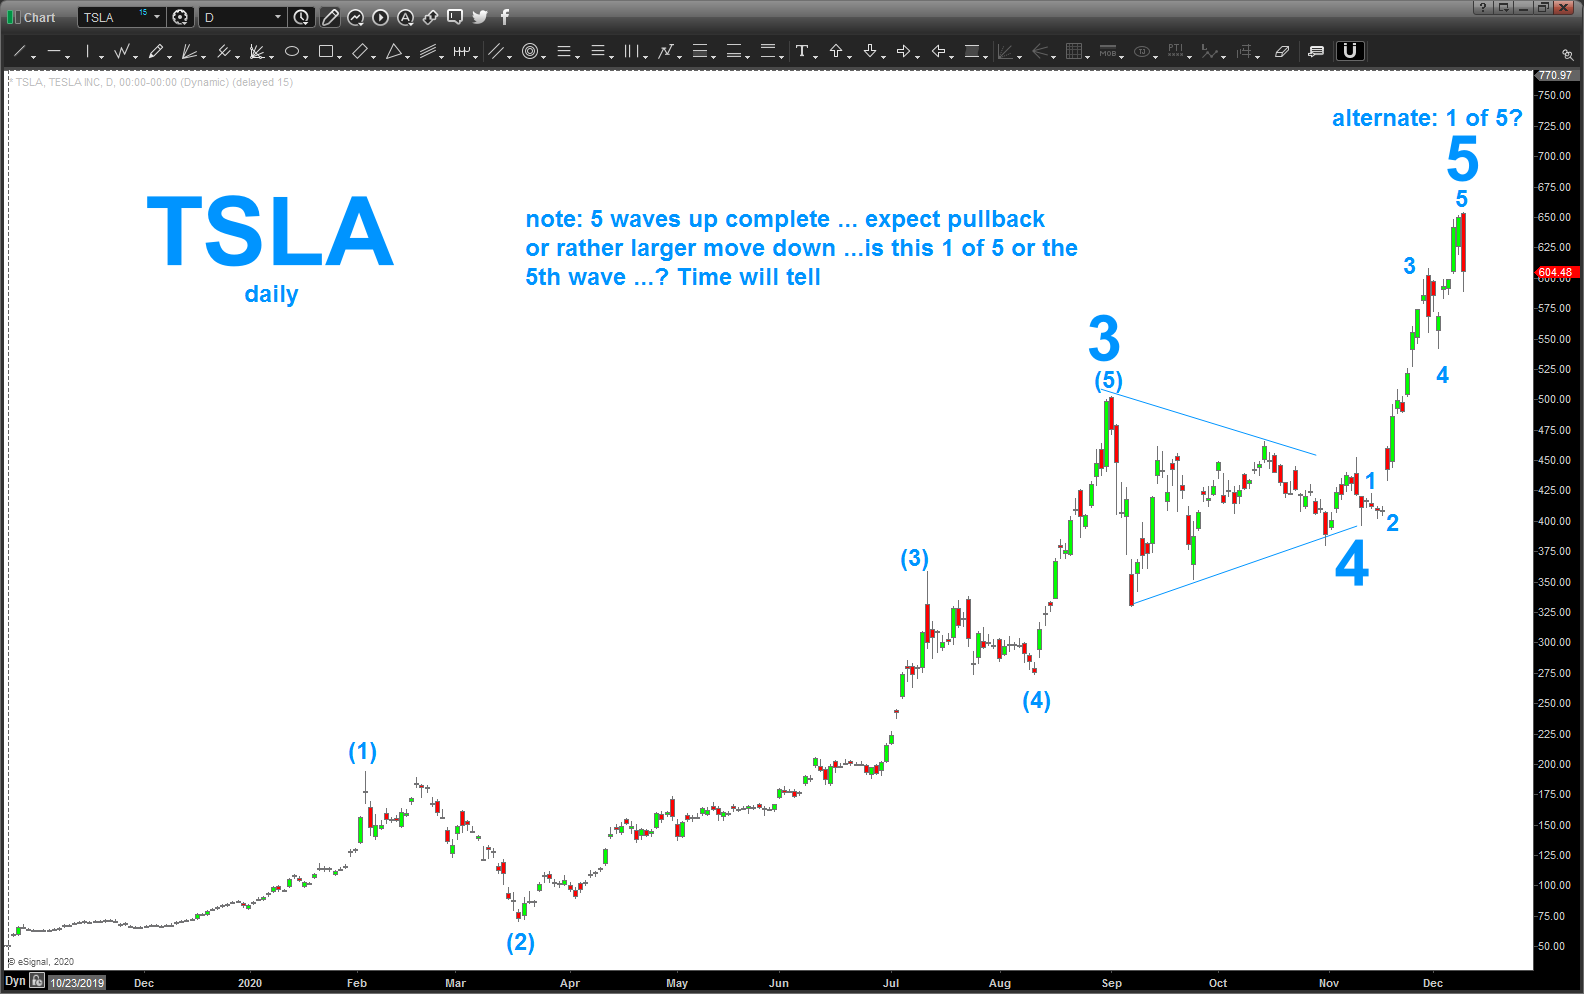
12/9 – 5 waves up complete .. is this the 5 or 1 of 5? don’t know and don’t care. expect a pullback from here … lot’s of gaps on the way up so stand by …
_______________________________________________
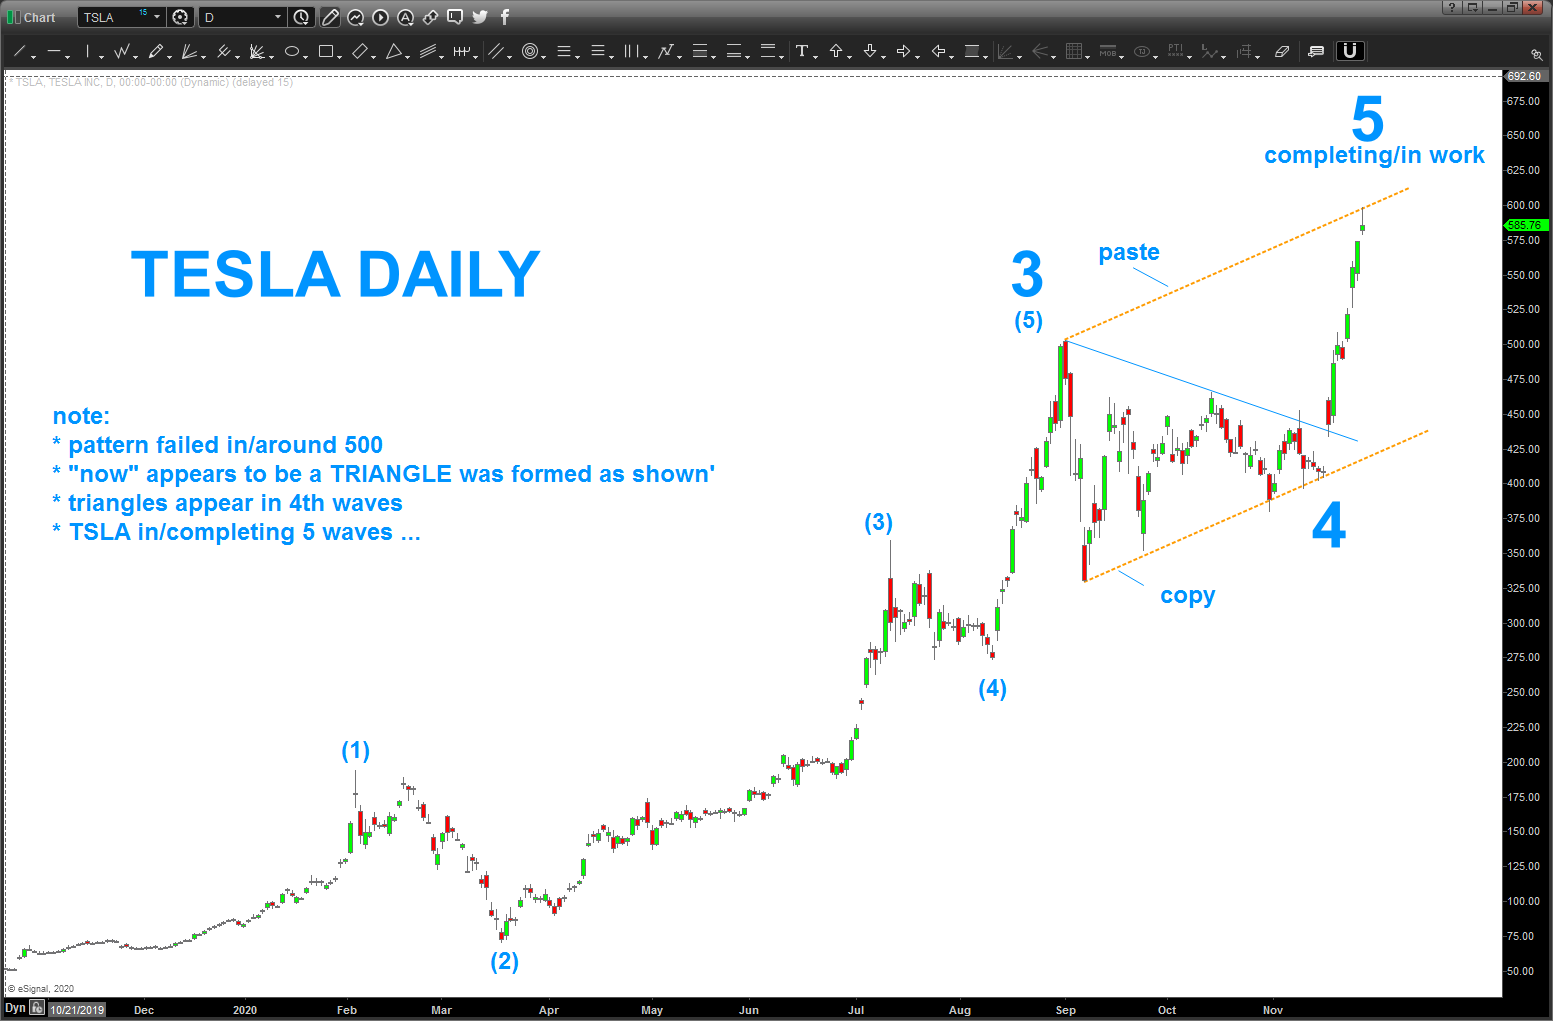
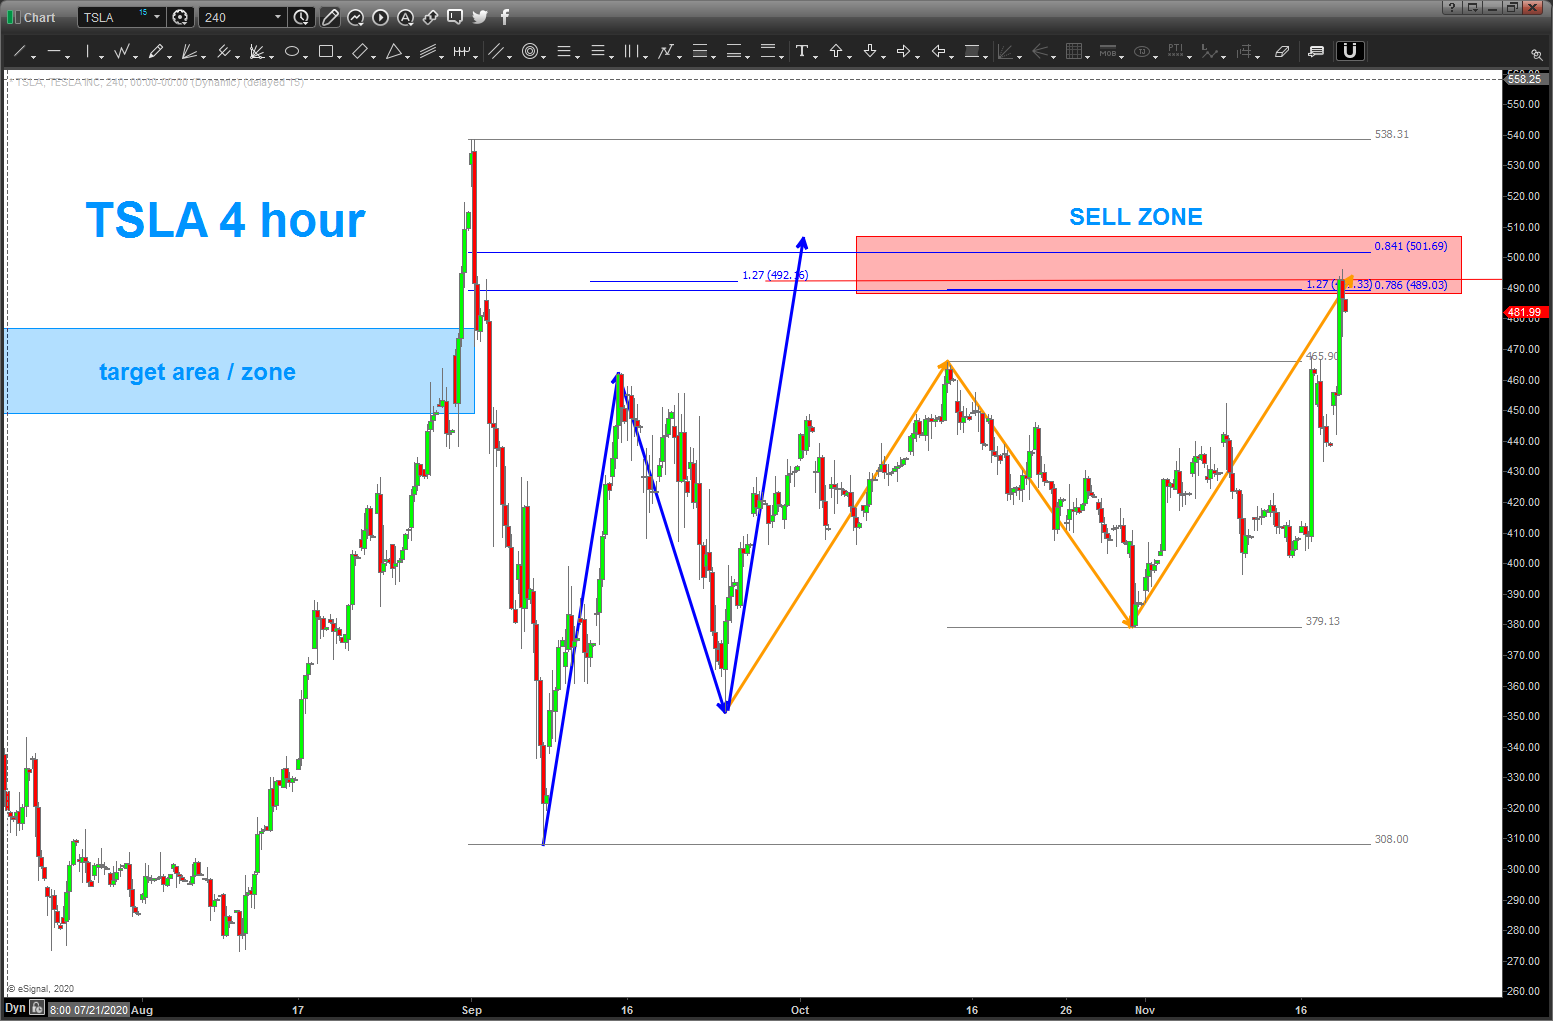
11/29 – TSLA blew thru the SELL PATTERNS shown below (11/19/20). the way it just took off made me rethink and look at the chart and, as Triangles usually do, after the fact (sorry about that) it appears to have been a 4th wave triangle. most of the time, you don’t realize your in a triangle – if you ever do real time – till after the fact or in the “e” wave …all this means… TSLA is completing/ has completed a 5th wave.
the PATTERN/CHARTS saying the risk is now on the long side … a correction down to 400 ish is not out of the question.
_______________________________________________
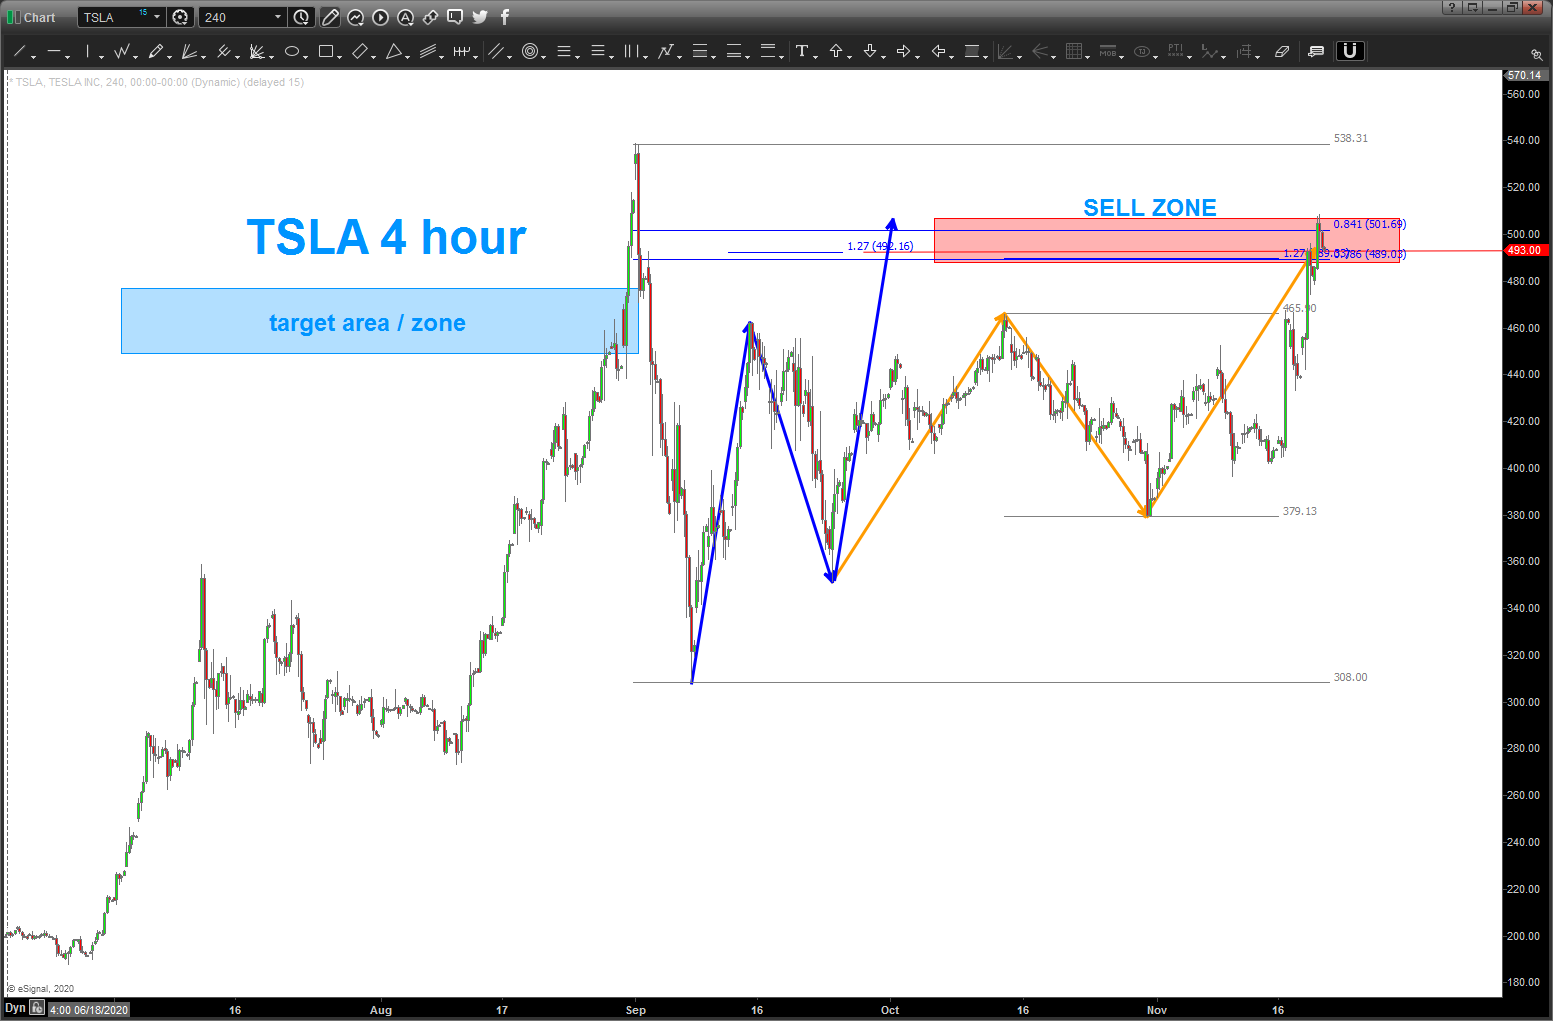
11/19 – today, TSLA ran into the top edge of the “sell zone” and backed away … keep an eye on this one as it’s not a “no brainer” long, right now.
_______________________________________________
11/18 – today, TSLA ran into a strong sell pattern. if, we start down from here it will be a BUY but not after a potential “large” drop. a daily close ABOVE the sighted “SELL ZONE” would be continually bullish and strong.
_______________________________________________
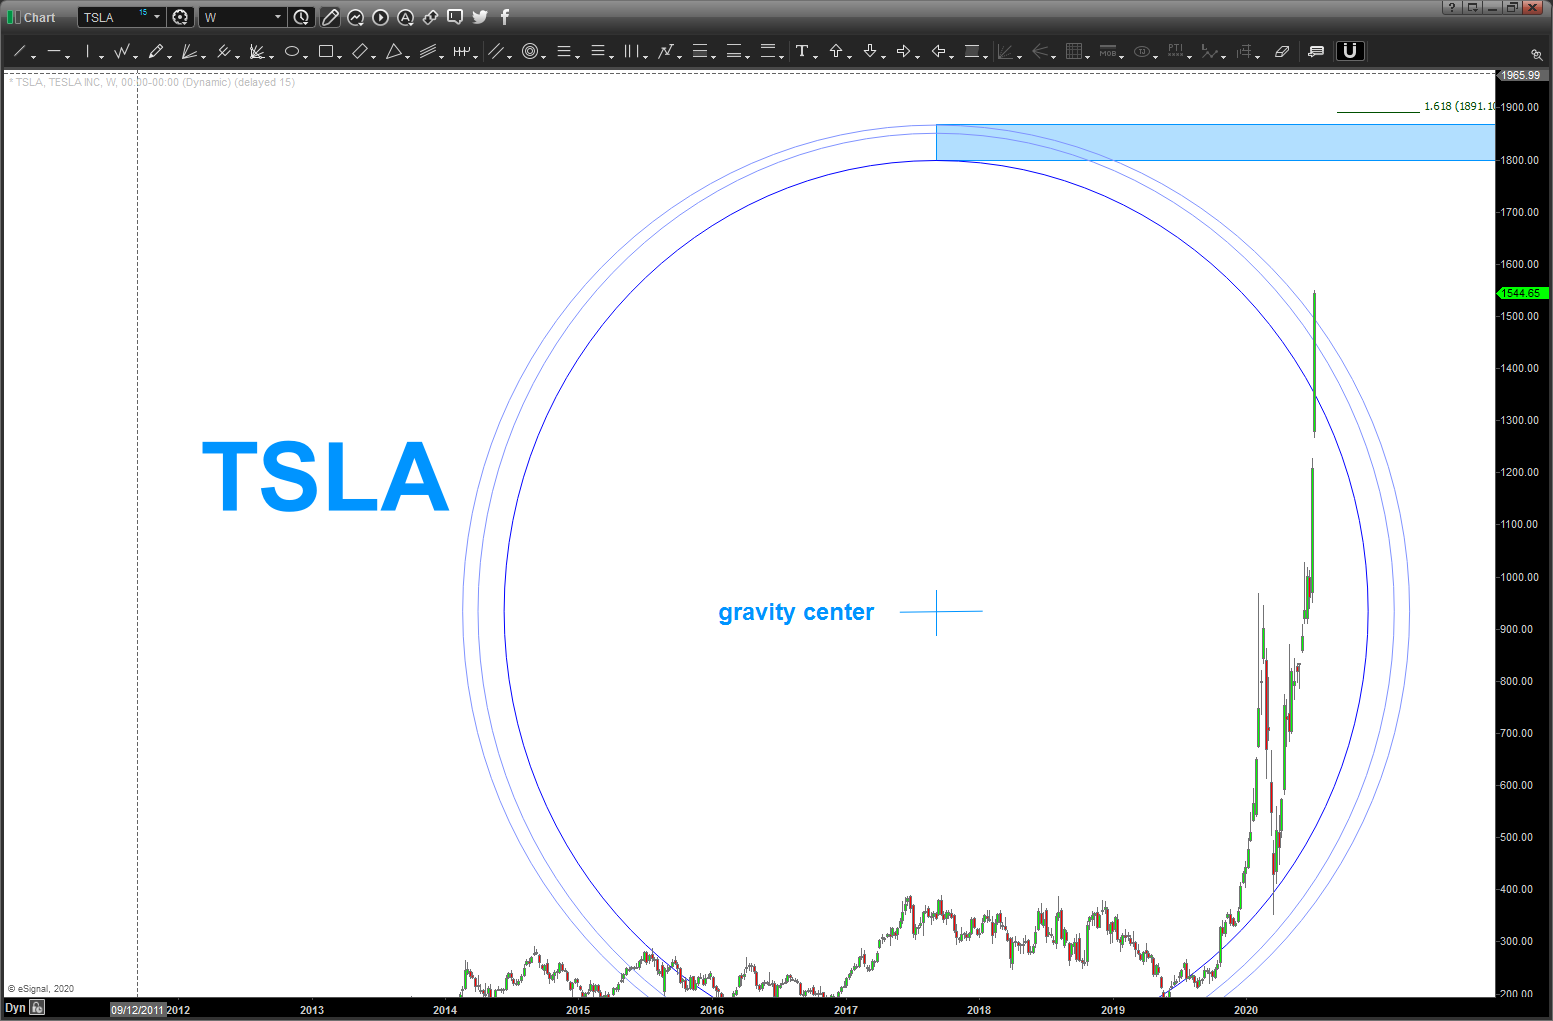
as I’ve shown in the past on the blog, these type of parabolic – in this case appears like a rocket they built launching into space – moves ALWAYS end in a big liquidation.
I’ve used what we learned in kindergarten on how to create a circle using 3 points and have the 1800’s a being pretty significant resistance for TSLA. that target zone is roughly 15% away. folks, let’s put THAT into perspective, on Friday the stock (in a single day) was up 12% so is 15% or so that unrealistic?
great to be long but … don’t get greedy, this puppy could flip bearish on a dime …let’s face it, this is unsustainable.
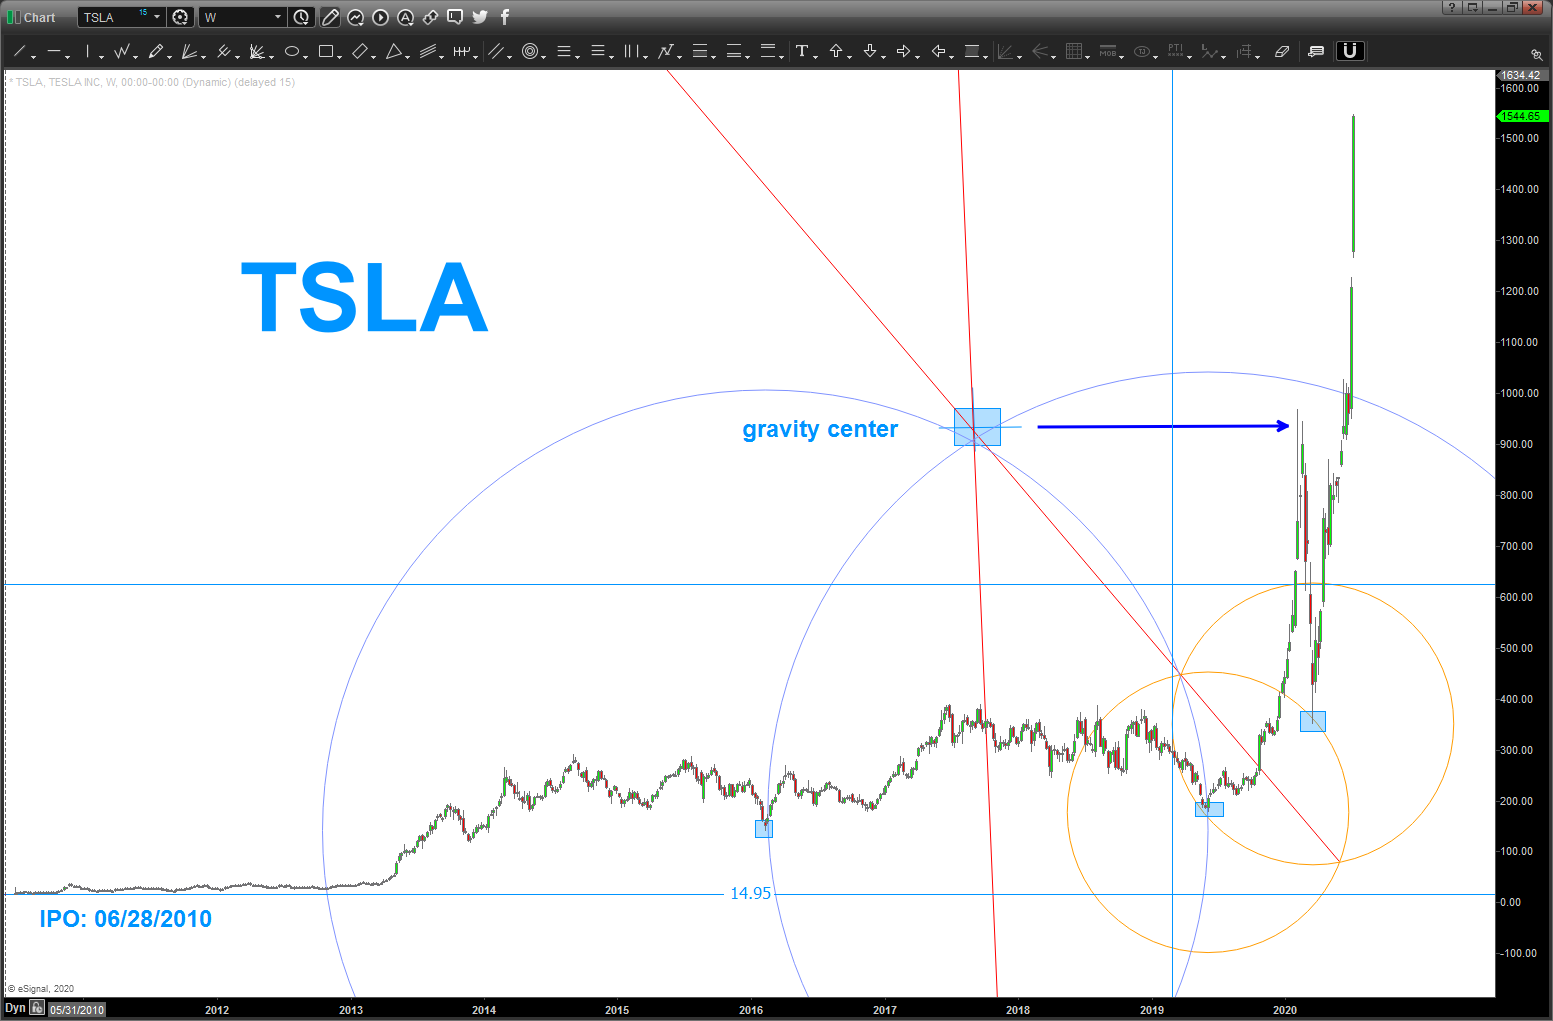
note, do believe we have a good “gravity center” as the point in time/space was the reason (from a pattern perspective) for the top shown by the bold blue arrow.